The Gaseous ISM: Observations with the Wisconsin H Mapper (WHAM)
Abstract
The Wisconsin H Mapper (WHAM) is a new facility dedicated to the study of faint optical emission lines from diffuse interstellar gas. During its first 18 months of operation, WHAM carried out a survey of the interstellar H emission associated with the warm, ionized component of the interstellar medium. The observations consisted of 37,000 spectra obtained with a one degree diameter beam on a 0o.98 0o.85 grid (), covering the sky above declination –30o. This survey provides for the first time a detailed picture of the distribution and kinematics of the diffuse ionized hydrogen through the H line comparable to surveys of the neutral hydrogen obtained through the 21 cm line. Preliminary reduction of the data from selected portions of the sky reveal that the interstellar H II has a complex distribution, with long filaments and loop-like structures extending to high Galactic latitudes and superposed on a more diffuse background. Apart from the H sky survey, WHAM also has detected for the first time faint diagnostic emission lines in selected directions, [O I] 6300, [O III] 5007, and He I 5876, which provide information about the physical state of the gas and clues about the source of the ionization. Maps of [S II] 6716 and [N II] 6584 over limited regions of the sky are providing information about variations in the temperature and ionization conditions within the Galactic disk, and the detection of faint optical emission lines from high velocity clouds is probing conditions in the halo. Finally, WHAM has the capability to explore the smaller scale structure of the medium through very narrow band (12 km s-1), 1′ angular resolution images within selected 1o fields. This facility is currently located at Kitt Peak National Observatory near Tucson, Arizona and operated remotely from Madison, Wisconsin.
Astronomy Department, University of Wisconsin, Madison, WI 53706
1. Properties of the Warm Ionized Medium
Diffuse ionized gas is a major, yet little understood component of the interstellar medium, which consists of regions of warm (104 K), low-density (10-1 cm-3), nearly fully ionized hydrogen that occupy approximately 20% of the volume within a 2 kpc thick layer about the Galactic midplane (e.g., Reynolds 1991, 1993a). Hoyle & Ellis (1963) were the first to suggest the existence of an extensive layer of warm H II surrounding the Galactic disk, based on the spatial and spectral characteristics of the Galactic synchrotron background at very low radio frequencies (2-10 MHz). However, it was not until the discovery of pulsars a few years later that the existence of widespread H II in the diffuse interstellar medium became generally accepted (see review by Guélin 1974). This was soon followed by the detection of faint, diffuse, optical line emission from the Galaxy (Reynolds, Roesler, & Scherb 1974), which provided information about the temperature, ionization state, kinematics, spatial distribution, and power requirements of the gas within 2–3 kpc of the sun. More recent narrow band filter imaging has revealed that widespread ionized hydrogen is also present in other galaxies (e.g., Rand, Kulkarni, and Hester 1990; Dettmar 1992; Hunter and Gallagher 1990; Walterbos and Braun 1994; Ferguson et al 1996; and Rossa and Dettmar at this meeting).
At the Galactic midplane, the space averaged density of H II is less than 5% that of the H I. However, because of its greater scale height, the total column density of interstellar H II along high Galactic latitude sight lines is relatively large, 1/4 to 1/2 that of the H I, and one kiloparsec above the midplane, warm H II may be the dominant state of the interstellar medium (Reynolds 1991). The existence of this ionized medium can have a significant effect upon the interstellar pressure near the Galactic midplane (Cox 1989) and upon the dynamics of hot (105 – 106 K), “coronal” gas far above the midplane (e.g., Heiles 1990).
Neither the source of the ionization nor the relationship of this gas to the other components of the medium, such as the H I, is understood. The intensity of the H background at high Galactic latitude implies an average of H-ionizations s-1 per cm2 column perpendicular to the Galactic disk (Reynolds 1992), which corresponds to a power input of at least ergs s-1 cm-2 (at 13.6 eV per ionization). Of the known sources of ionization within the Galaxy, only O stars, which produce ionizing photons s-1 cm-2 (e.g., Abbott 1982; Vacca et al 1996) comfortably exceed this requirement. Supernovae, which inject approximately ergs s-1 cm-2 of kinetic energy into the interstellar medium, cannot be the primary source unless the ionization process is nearly 100% efficient, or unless supernovae in the Galaxy are significantly more numerous and energetic than the generally assumed Galactic values of ergs per 40 years. Models by Miller & Cox (1993) and Dove & Shull (1993) have shown that for certain distributions of the H I clouds and intercloud medium, Lyman continuum photons from O stars and OB associations could travel far from the midplane, ionizing large volumes of interstellar space. Therefore, it is tempting to conclude that O stars must be the source, and that the regions of diffuse H II are very extended “Strömgren Spheres” in a diffuse intercloud medium as first suggested by Davidson & Terzian (1969).
However, if O stars are to account for the ionization, then their photons must travel not only large distances above the midplane, but also within the H I cloud layer, which would require significantly fewer H I clouds per kpc than the “standard model”, at least along the one sightline that was examined (Miller & Cox 1993; also Reynolds 1993b). Furthermore, the ionization conditions within the diffuse ionized gas appear to differ significantly from conditions within O star H II regions. The anomalously strong [S II] 6716/ H and weak [O III] 5007/ H emission line ratios (compared to O and B star H II regions) indicate a low state of excitation with few ions present that require ionization energies greater than 23 eV (Reynolds 1985b, 1988). This is supported by the low ionization fraction of helium in the diffuse H II (Tufte 1997; Reynolds & Tufte 1995; Heiles et al 1996), which implies that the spectrum of the diffuse interstellar radiation field that ionizes the hydrogen is significantly softer than that from the Galactic O star population. The combination of high [S II] intensities, low [O I] 6300 intensites (Reynolds et al 1998b; Dettmar & Schulz 1992), and low He I intensities relative to H are not accounted for simultaneously by current O star photoionization models (e.g., Domgörgen & Mathis 1994; Sokolowski 1994). The data seem to require either a softening of the radiation after it leaves the vicinity of the O star, with an additional source of heating within the diffuse ionized regions, or an ionizing source other than O stars (see Rand 1997, 1998). Suggested sources other than O stars have included, for example, galactic flares (Raymond 1992), turbulent mixing between the hot and warm phases (e.g., Slavin, Shull, & Begelman 1993), cosmic ray electrons (Ramaty & Skibo 1993), and the decay of dark matter (Sciama 1993).
2. The Wisconsin H Mapper Facility
The Wisconsin H Mapper (WHAM) is a recently completed facility (funded by the National Science Foundation) for the detection and study of faint emission lines from diffuse ionized gas in the disk and halo of the Galaxy. WHAM consists of a 15 cm aperture, dual etalon Fabry-Perot spectrometer coupled to a dedicated 0.6 m light bucket telescope, which provide a one degree diameter beam on the sky and produce a 12 km s-1 resolution spectrum across a 200 km s-1 spectral window (Reynolds et al 1990; Tufte 1997). The spectral window can be set to any wavelength between 4800 Å and 7200 Å using a gas pressure control system to tune the Fabry-Perot etalons and a filter wheel to provide the correct isolating interference filter. The tandem etalons greatly extend the effective “free spectral range” of the spectrometer and suppress the multi-order Fabry-Perot ghosts, especially those arising from the relatively bright atmospheric OH emission lines within the pass band of the interference filter. A high quantum efficiency (78% at H), low noise ( 3 e- rms) CCD camera serves as a multichannel detector, recording the spectrum as a Fabry-Perot “ring image” (Reynolds et al 1990). The combination of high spectral resolution, the largest available Fabry-Perot etalons, and a high efficiency CCD on a dedicated telescope make WHAM a powerful instrument for exploring many aspects of the the warm ionized medium.
The WHAM facility is located on Kitt Peak near Tucson Arizona. The siderostat, the CCD camera and LN2 camera filling system, the etalon pressure system, the interference filter wheel, the calibration light sources and their flip mirror, plus a number of environmental sensors can provide information to and can be controlled by a single workstation. By incorporating the messaging system developed for the WIYN telescope (Percival 1994), the entire WHAM facility, including opening and closing the telescope, can be operated from a remote location. This capability allows WHAM to have the benefits of a clear air site, operating about 70 clear, dark of the moon nights per year with relatively little travel for the observers. Normal operation requires a part-time, on-site technician/observer for minor maintenance, trouble shooting, and monitoring sky conditions, plus an occasional trip from Wisconsin for special calibrations, and changes to special filters not on the wheel.
3. Observations
A number of new investigations have been started with this facility, including the H sky survey, mapping portions of the sky in forbidden lines, studies of optical emission lines from high velocity clouds and cloud complexes, the detection of extremely faint emission lines that probe physical conditions within the gas, and high angular resolution (1′), high velocity resolution (12 km s-1) imaging.
3.1. The H Sky Survey
Between January 1997 and September 1998, WHAM carried out one of its primary missions, a northern sky H survey of the warm ionized medium. This survey consists of approximately 37,000 spectra above declination , sampling the sky on a 0o.85 0o.98 grid with a 1o beam. Each spectrum has a 30 s integration time and covers a 4.4 Å (200 km s-1) spectral interval centered near the LSR at a resolution of 0.26 Å (12 km s-1). All observations were carried out during dark of the moon to avoid contamination by features in the solar spectrum. This survey has provided the first detailed view of the distribution and kinematics of the diffuse hydrogen through the optical H line comparable to the large scale survey maps of the hydrogen obtained through the radio 21 cm line.
Figure 1 illustrates a sample spectrum from the survey at
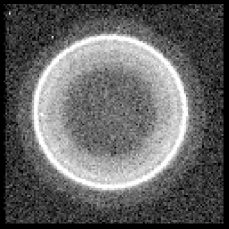


, , showing both the raw CCD image and resulting H spectra. The geocoronal H line, produced by solar excitation of atomic hydrogen in the earth’s upper atmosphere, is the thin, bright annulus in the CCD “ring spectrum”. This emission appears as a prominent, relatively narrow line in the center frame of Figure 1. The interstellar emission is the broader feature inside the geocoronal ring, appearing in this case to consist of two blended velocity components at +30 km s-1 and +60 km s-1 with respect to the geocoronal line. In general, the separation between the interstellar emission and the geocoronal line is due to a combination of the earth’s orbital velocity, the sun’s peculiar velocity, and intrinsic motions of the interstellar gas, including Galactic differential rotation. The two interstellar components have intensities of about 2 R and 4 R, where a Rayleigh, 1 R = 2.41 erg cm-2 s-1 sr-1 at H and corresponds to an emission measure of 2.3 cm-6 pc for a temperature of 8000 K. The geocoronal line is removed from the data by fitting each spectrum with gaussian components and then subtracting from the spectrum the fitted gaussian associated with the geocorona. The resulting interstellar spectrum is shown in the third frame of Figure 1. The absolute intensity calibration is obtained by comparison with standard astronomical sources (e.g., Scherb 1981).
A portion of the survey data is presented in Figure 2 as a gray scale
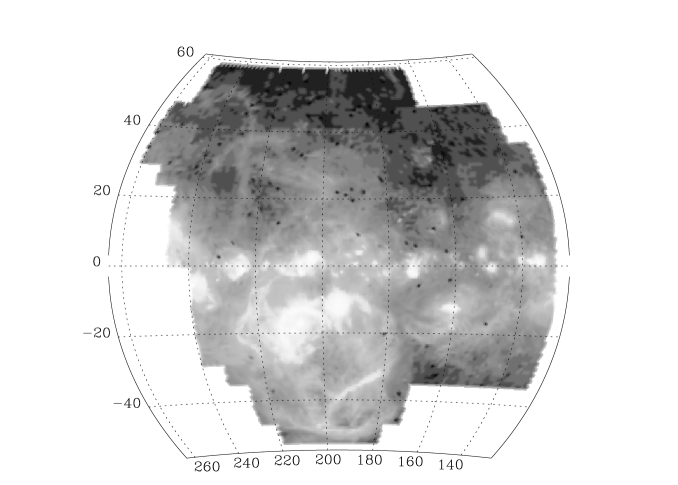
map of the total intensity of the interstellar H emission. This map, synthesized from approximately 13,000 H spectra, covers the region of the sky between about 130o to 240o Galactic longitude and 50o Galactic latitude. The gray scaling and stretch have been adjusted to reveal the fainter high latitude emission along with the brighter regions near the plane. Interstellar H emission is detected in every direction, with intensities that range from thousands of Rayleighs near the Orion nebula ( 209o,) and 100–200 R in Barnard’s loop and the large Ori H II region (195o, ) to 0.5 R in some of the fainter high latitude regions (e.g., 220o, +45o). The map reveals numerous large scale filaments superposed on a fainter H background. A number of “classical” H II regions also dot the map near the Galactic equator. Some of the filamentary features are associated with the Orion-Eridanus bubble, which fills the sky from = 180o to 210o and to and includes Barnard’s Loop near its northern boundary. Many of the Orion-Eridanus filaments are correlated with emission features at 21 cm and x-ray wavelengths (see, for example, Reynolds & Ogden 1979; Brown, Hartmann, & Burton 1995; Burrows et al 1993; Heiles, this meeting). However, other filaments on the map have no obvious correspondence to any previously known structures, for example, the 1 R feature rising vertically from 226o, +10o.
This latter filament is approximately 2o wide and at least 80o long, terminating at the southern boundary of the survey, = 270o, = +42o (see Haffner, Reynolds, and Tufte 1998). The vertical portion of this feature between and +25o is associated with a single radial velocity component centered at +16 km s-1 (LSR). As the feature arches toward higher longitudes the velocity decreases, reaching about –20 km s-1 at the southern limit of the survey. Where the filament appears to meet the Galactic plane near = 225o, it is directly above the H II region surrounding the CMa OB1 association, which has a radial velocity similar to that of the filament just above it. The coincidence in location and radial velocity of one end of the filament with this energetic source in the Galactic midplane suggests a possible connection between them. However, the nature of the connection is not clear, because the photoionizing flux from the O stars in the association and the recombination and kinematic time scales for the gas in the filament appear to be inconsistent with ejection or ionization by the association (see discussion in Haffner et al 1998). Although the origin of this and other filaments revealed by the survey has not yet been identified, their existence provides important new clues about the nature of the ionized medium at high latitudes.
Once the reduction of the survey data is completed (mid 1999), it will be possible to carry out for the first time a detailed comparison of the distribution and kinematics of the H II with that of the H I. One question such a comparison may help to address is the basic structure of the interstellar medium: the distribution and topology of clouds, the warm “intercloud” medium, and the hot coronal gas. For example, it is not yet know whether the warm component (the warm neutral medium and the warm ionized medium) is confined to isolated clouds embedded within a pervasive hot medium (McKee & Ostriker 1977) or whether the warm component is in fact the pervasive medium with the hot gas confined to relatively small, isolated bubbles within it (Heiles 1990; Slavin & Cox 1993). The distribution of the warm diffuse H II and its spatial and kinematic relationship to the H I has a direct bearing on this question. In the McKee & Ostriker model, the warm H II is located in the envelopes of H I clouds and therefore is a tracer of the between the warm and the hot, “coronal” phases. On the other hand, if warm intercloud gas is the pervasive medium, then the H II will have a fundamentally different distribution, occupying extensive regions the H I clouds (e.g., Miller & Cox 1993).
In addition to the 21 cm studies, this H survey also may impact the interpretation of other observations, including:
-
•
the cosmic microwave background, which is contaminated by the free-free continuum emission associated with the diffuse H II (e.g., Gundersen et al 1996; Bennett et al 1992);
-
•
the far-UV background, which has a significant ( 10% – 20%) contribution from the hydrogen two-photon continuum emitted by the diffuse H II (Reynolds 1992);
-
•
the 100 MeV diffuse -ray background, produced by the interaction of cosmic rays with interstellar matter, including the H II (Bloemen 1989), which is 0.26 – 0.63 of the H I column density at high latitudes;
-
•
the far-IR emission line background such as [N II] 205 m and [C II] 158 m (Petuchowski & Bennett 1993; Heiles 1994);
-
•
UV absorption line studies, including the origin and location of moderate to low ions such as S+, C+, Al++, etc. (e.g., Spitzer & Fitzpatrick 1993; Savage & Howk 1998);
-
•
rotation measures, radio scintillation, and angular broadening observations (e.g., Minter & Spangler 1996);
-
•
pulsar dispersion measures and distances (Taylor & Cordes 1993); and
-
•
other, complementary H surveys that map the structure of the ionized gas at higher angular resolution, but lack velocity resolution and an absolute intensity scale (e.g., Gaustad et al 1996; Simonetti et al 1996; Parker & Phillipps 1998).
3.2. Maps of [S II] 6716 and [N II] 6584
Another program involves mapping limited regions of the sky in emission lines other than H. The forbidden lines, [S II] 6716 and [N II] 6584 are the two brightest optical lines in the interstellar background after H, with intensities typically about 40% that of H, and they are a probe of physical conditions within the ionized medium. The [S II] line, for example, is about five times brighter relative to H in the diffuse interstellar medium than in traditional H II regions surrounding O and B stars (e.g., Haffner 1998; Reynolds 1985b, 1988). Elevated [S II]/H (and [N II]/H) intensity ratios have also been found to be a characteristic of the warm ionized medium in other galaxies (e.g., Walterbos & Braun 1992), with ratios increasing as a function of distance from the midplane (Dettmar & Schulz 1992; Golla, Dettmar, & Domgörgen 1996; Rand 1997). In the Milky Way there also are real variations in the [S II]/ H ratio, ranging from about 0.2 to 1.0 from sightline to sightline (Haffner 1998). Even along a single sightline the [S II]/H ratio can vary greatly from one radial velocity component to the next. A preliminary map of the [S II]/H ratio in a 1000 square degree region bounded by reveals large scale variations in the ratio that are anticorrelated with the H surface brightness (Haffner 1998).
The reason for the anomalously high line ratios and their variations is not well understood, but they are potentially important clues to the excitation and ionization conditions within the gas. Photoionization models (Domgörgen & Mathis 1994; and Sokolowski 1994) indicate that a low ionization parameter, the ratio of photon density to gas density, is probably one of the principal factors producing elevated [S II]/ H and [N II] /H ratios. However, the models are not successful at explaining the low [O I] and He I intensities (see below), and, therefore, other factors such as electron temperature and the spectrum of the radiation field may also be important (Rand 1997, 1998). Because nitrogen and sulfur have different ionization potentials, they respond differently to changes in ionization conditions. On the other hand, because the two emission lines, [N II] 6584 and [S II] 6716, are associated with metastable states that have nearly the same energy above the ground state, their intensities should respond nearly identically to variations in electron temperature. Therefore, maps of [S II] and [N II] in addition to the H, in combination with photoionization models, can probe ionization and excitation conditions and their variations throughout the disk and halo.
3.3. Optical Emission Line Studies of High Velocity Clouds
Although their existence has been known for many years, the origin of High Velocity Clouds (HVCs) is still a mystery (e.g., Wakker et al. 1996). This is due at least in part to the fact that until relatively recently, HVCs could only be studied via the 21 cm emission line. Absorption line observations have now begun to place significant constraints on the distance and metallicity of some of the clouds (e.g., Danly, Albert, & Kuntz 1993; Wakker et al 1996, 1998), and there has even been evidence recently presented for associated soft x-ray emission (Herbstmeier et al. 1995).
The detection of HVCs in optical emission at H (Kutyrev & Reynolds 1989) and, with WHAM, in [S II] 6716 in addition to H (Tufte et al 1998) have opened a new window through which to explore the nature of these objects. Initial studies of the M I cloud with WHAM have shown, for example, that the H emission, while clearly associated spatially and kinematically with the 21 cm emission, does not correlate closely with the H I column density. In the M I cloud there is some indication that the ionized gas producing the H emission envelops the neutral gas; however, the “H II halo”, if present, is not large. Furthermore, the [S II]/H ratio varies significantly, indicating large variations in the ionization/excitation conditions within the cloud. The line widths imply a temperature near 104 K and low ( km s-1) nonthermal velocities, suggesting photoionization rather than shock excitation. Finally, because at least some HVCs are located far from the Galactic midplane (Wakker et al 1996), the optical line observations provide the opportunity to probe the environment far outside the Galactic disk (see, for example, discussions by Weiner & Williams 1996 and Bland-Hawthorn & Maloney 1998).
3.4. Extremely Faint Diagnostic Lines
WHAM provides the opportunity to study emission lines that are too faint to have been detected previously. The intensities, line widths, and radial velocities of these lines give information on the physical conditions within the gas and place strong constraints on theoretical models. Examples of such diagnostic lines include:
-
He I
5876 – This line is interesting because recombination lines of He I in the diffuse ionized gas of the Galaxy appear to be significantly fainter relative to those of hydrogen than O star ionization models predict (Tufte 1997; Reynolds & Tufte 1995; Heiles et al 1996; Domgörgen & Mathis 1994). He I in the edge-on galaxy NGC 891 is stronger than in the Milky Way (Rand 1997, 1998), but the basic conclusion is the same as for the Milky Way, namely, the ionizing spectrum appears to be significantly softer than that of the assumed source spectrum (O stars). This presents a challenge to the O star models for the warm ionized medium, especially since the models seem to require a spectrum than O stars to explain the relatively high forbidden line intensities (Sokolowski 1994; Rand 1998).
-
[ O I
] 6300 – The ionization fraction of oxygen is tied closely to that of hydrogen through the large H+ + O Ho + O+ charge exchange cross section, such that the [O I] 6300/ H intensity ratio is an accurate measure of the hydrogen ionization fraction H+/H within the warm ionized medium. Observations of this line, whose intensity relative to H ranges from less than 0.01 to about 0.04 (Reynolds et al 1998b; Dettmer & Schulz 1992), imply that the hydrogen within the H emitting regions is nearly fully ionized. These observations also provide strong constraints on the photoionization models, forcing the incorporation of optically thin (to Lyman continuum radiation) clouds and the escape of a significant fraction of the ionizing radiation from the galaxy (Domgörgen & Mathis 1994; Sokolowski 1994).
-
[ O III
] 5007 – At low Galactic latitudes the optical [O III]/ H intensity ratio is significantly fainter in the Galactic background than in traditional H II regions (Reynolds 1985a), consistent with the apparently low ionization state of the warm ionized medium and the 35 eV ionization potential of O+. Preliminary observations with WHAM have detected for the first time the optical [O III] line at high Galactic latitudes (Haffner et al 1996). Now that it has been detected, an important question is whether the emission is associated with the warm component or with the hotter (105 K) “coronal” gas component of the interstellar medium. The [O III] 5007 intensities at high latitude are, in fact, comparable to the 5007 intensities that are predicted from the hotter medium (Haffner et al 1996) based on the intensities of the O III] 1663 emission measured toward six high latitude sightlines by Martin & Bowyer (1990) during the Berkeley UVX Shuttle mission. The high latitude O III] 1663 emission (along with C IV 1550) is associated with the 105 K phase of the medium (Martin & Bowyer 1990). If the optical (5007) line is also associated with the hot gas, it would provide a unique opportunity to map the distribution and kinematics of this gas, which is believed to occupy a transition region between the 104 K and 106 K phases.
3.5. Deep, High Angular Resolution Imaging
In addition to spectra, the WHAM spectrometer can obtain very narrow-band, deep images at 1′ – 2′ angular resolution within a 1o circular field. In the normal “spectrum mode” only the spectrum of the source, averaged within the beam, is imaged on the detector. This eliminates confusion between spectral features and spatial features (including stars) within the 1o beam. However, with the insertion of additional lenses into the optical path, a monochromatic image of the sky within the 1o diameter beam is recorded on the detector. The spectral width of the image can be adjusted by an iris diaphram to any value between 10 km s-1 (0.2 Å at H) and 200 km s-1 (4.4 Å). This allows imaging in selected radial velocity components and even portions of a line profile (e.g., red side vs blue side), if desired. This imaging mode has been used to study the distribution and kinematics of ions in comets (e.g., Scherb et al 1996), but has not yet been applied to observations of the interstellar medium. Narrow band imaging of the warm ionized medium, when combined with DRAO 21 cm survey observations, for example, could probe the relationship between the H II and the H I phases at sub parsec scales. An earlier (pre WHAM) comparison of 3′ resolution H and 21 cm images in one field () containing a moderate velocity ( km s-1) cloud, revealed a close relationship, both spatially and kinematically, between the H II and H I in the cloud, but also indicated that the regions of ionized and neutral gas are spatially separated (Reynolds et al 1995).
4. Conclusions
High-throughput, high spectral resolution Fabry-Perot spectroscopy of faint interstellar emission lines at optical wavelengths is providing new information about the distribution, kinematics, and physical conditions of the diffuse ionized component of the interstellar medium. The comparison of these optical emission line data with observations at other wavelengths, particularly observations that probe other phases of the medium, should lead to an improved understanding of the composition and structure of the interstellar medium and the principal sources of ionization and heating within the Galactic disk and halo.
Acknowledgments.
We thank N. R. Hausen, M. Quigley, K. Jaehnig, J. Percival, and T. Tilleman for their very important contributions to the WHAM program. WHAM is funded by the National Science Foundation through grant AST 96-19424.
References
Abbott, D. C. 1982, ApJ 263, 723
Bennett et al 1992, ApJ 396, L7
Bland-Hawthorn, J. & Maloney, P. R. 1996, Publ. Ast. Soc. Australia 14, 59
Bloemen, H. 1989, ARA&A 27, 469
Brown, A. G. A., Hartmann, D., & Burton, W. B. 1995, A&A 300, 903
Burrows, D. N., Singh, K. P., Nousek, J. A., Garmire, G. P., & Good, J. 1993, ApJ 406, 97
Cox, D. P. 1989, in Structure and Dynamics of the Interstellar Medium, eds. G. Tenorio-Tagle, M. Moles, & J. Melnick (Springer-Verlag), p. 500
Danly, L., Albert, C. E., & Kuntz, K. D. 1993, ApJ 416, L29
Davidson, K. & Terzian, Y. 1969, Nature 221, 729
Dettmar, R.-J., 1992, Fund. Cosmic Phy., 15, 143
Dettmar, R.-J. & Schulz, H. 1992, A&A 254, L25
Domgörgen, H. & Mathis, J. S. 1994, ApJ 428, 647
Dove, J. B. & Shull, J. M. 1994, ApJ 430, 222
Ferguson, A. M. N., Wyse, R. F. G., Gallagher, J. S., & Hunter, D. A. 1996, AJ 111, 2265
Gaustad,J. E., McCullough, P. R., & Van Buren, D. 1996, PASP 108, 351
Golla, G., Dettmar, R.-J., & Domgörgen, H. 1996, A&A 313, 439
Guélin, M. 1974, in Galactic Radio Astronomy, IAU Symp. No. 60, ed., F. J. Kerr & S. C. Simonson (Dordrecht:Ridel), p. 51
Gunderson, J. O. et al. 1996, ApJ 443, L57
Haffner, L. M. 1998, in preparation
Haffner, L. M., Reynolds, R. J., & Tufte, S. L. 1996, BAAS 28, 890.
Haffner, L. M., Reynolds, R. J., & Tufte, S. L. 1998, ApJ 501, L83
Heiles, C. 1990, ApJ 354, 483
Heiles, C. 1994, ApJ 436, 720
Heiles, C., Koo, B.-C., Levenson, N. A., & Reach, W. T. 1996, ApJ 462, 326.
Herbstmeier, U., Mebold, U., Snowden, S. L., Hartmann, D., Burton, W. B., Moritz, P., Kalberla, P. M. W., & Egger, R. 1995, A&A 298, 606
Hoyle, F. & Ellis, G. R. A. 1963, Australian J. Phys. 16, 1
Hunter, D. A. & Gallagher, J. S.,III 1990, ApJ 362, 480
Kutyrev, A. S. & Reynolds, R. J. 1989, ApJ 344, L11
Martin, C. & Bowyer, S. 1990, ApJ 350, 242
McKee, C. F. & Ostriker, J. P. 1977, ApJ 218, 148
Miller, W. W.,III & Cox, D. P. 1993, ApJ 417, 579
Minter, A. H. & Spangler, S. R. 1996, ApJ 458, 194
Parker, Q. A. & Phillipps, S. 1998 Publ. Ast. Soc. Australia 15, 28
Percival, J. W. 1994, in Proceedings of the 4th Conference on Astronomical Data Analysis Software and Systems.
Petuchowski, S. J. & Bennett, C. L., ApJ 405, 591
Rand, R. J. 1997, ApJ 474, 129
Rand, R. J. 1998, 501, 137
Rand, R. J., Kulkarni, S. R., & Hester, J. J. 1990, ApJ 352, L1
Raymond, J. C. 1992, ApJ 384, 502
Reynolds, R. J. 1985a, ApJ 298, L27
Reynolds, R. J. 1985b, ApJ 294, 256
Reynolds, R. J. 1988, ApJ 333, 341
Reynolds, R. J. 1989, ApJ 339, L29
Reynolds, R. J. 1991, in The Interstellar Disk-Halo Connection in Galaxies, IAU Symp. No. 144, ed. H. Bloemen (Dordrecht:Kluwer), p.67
Reynolds, R. J. 1992, ApJ 392, L35
Reynolds, R. J. 1993a, in Back to the Galaxy, AIP Proc. 278, eds. S. S. Holt & F. Verter, (New York:AIP), p. 156
Reynolds, R. J. 1993b, in Massive Stars: Their Lives in the Interstellar Medium, ASP Conf. Ser. Vol. 35, eds. J. P. Cassinelli & E. B. Churchwell (ASP), p. 338
Reynolds, R. J., Hausen, N. R., Tufte, S. L., & Haffner, L.M. 1998b, ApJ 494, L102
Reynolds, R. J. & Ogden, P. M. 1979, ApJ 229, 942
Reynolds, R. J., Roesler, F. L., & Scherb, F. 1974, ApJ 192, L53
Reynolds, R. J., Roesler, F. L., Scherb, F., & Harlander, J. 1990, in SPIE Proc. Vol. 1235, p. 610
Reynolds, R. J. & Tufte, S. L. 1995, ApJ 439, L17
Reynolds, R. J., Tufte, S. L., Kung, D. T., McCullough, P. R., & Heiles, C. 1995, ApJ 448, 715
Savage, B. D. & Howk, C 1998, preprint
Scherb, F. 1981 ApJ243, 644
Scherb, F., Roesler, F. L., Tufte, S. L., & Haffner, L. M. 1996, BAAS 28, 927
Sciama, D. W. 1993, ApJ 409, L25
Simonetti, J. H., Dennison, B., & Topsana, G. A. 1996, ApJ 458, L1.
Skibo, J. G. & Ramaty, R. 1993 A&AS 97, 145
Slavin, J. D. & Cox, D. P. 1993, ApJ 417, 187
Slavin, J. D., Shull, J. M., & Begelman, M. C. 1993, ApJ 407, 83
Sokolowski, J. 1994, ‘Photoionization in Galactic Halos: The Formation of Enhanced, Low-Ionization Emission in NGC 891 and the Milky Way”, preprint
Spitzer, L, Jr., & Fitzpatrick, E. 1993, ApJ 409, 299
Taylor, J. H. & Cordes, J. M. 1993, ApJ 411, 674
Tufte, S. L. 1997, PhD Thesis, University of Wisconsin
Tufte, S. L., Reynolds, R. J., & Haffner, L. M. 1998, ApJ 504, 773
Vacca, W. D., Garmany, C. D., & Shull, J. M. 1996, ApJ 460, 914
Wakker, B.P., Howk, J.C., Savage, B.D., Tufte, S.R., Reynolds, R.J., van Woerden, H., Schwarz, U.J., & Peletier, R.F. 1998, preprint
Wakker, B., Howk, C., Schwarz, U., van Woerden, H., Beers, T., Wilhelm, R., & Danly, L. 1996 ApJ 473, 834
Walterbos, R. A. M., & Braun, R. 1992, A&AS 92, 625
Walterbos, R. A. M., & Braun, R. 1994, ApJ 431, 156
Weiner, B. J. & Williams, T. B. 1996, AJ 111, 1156