Probing Interstellar Turbulence in the Warm Ionized Medium using Emission Lines
Abstract
The nature of turbulence in the warm ionized component of the interstellar medium (WIM) can be investigated using Fabry-Perot spectroscopy of optical emission lines. The H intensity provides the emission measure (EM) along a line of sight, which is used in conjunction with the scattering measure, rotation measure, and dispersion measure to study interstellar turbulence. Observations at high spectral resolution ( 10 km s-1) allow measurements of the bulk radial velocity structure of the emitting gas and investigations of thermal and non-thermal (turbulent) broadening mechanisms through the line widths. By measuring the widths of the H line and an emission line from a heavier atom (e.g. the [S II] 6716 line), one can separate the thermal and non-thermal contributions to the line width. Preliminary studies using this method have shown that the broad range of H line widths (typically 15 – 50 km s-1) is mostly due to differences in the non-thermal component of the width and that along many lines of sight this component dominates. The Wisconsin H Mapper (WHAM) is in the process of producing a very sensitive kinematic map of the northern sky in H at 1o angular resolution and 12 km s-1 spectral resolution. WHAM is also mapping emission lines from heavier atoms such as sulfur and nitrogen for selected regions of the sky. This data set will provide unique new information concerning turbulence in the WIM.
1 Introduction
The presence of ionized gas in the Galaxy has traditionally been associated with the bright ionized regions near hot stars called Strömgren spheres or classical H II regions. We now know that these classical H II regions contain only about 10% of the of the ionized hydrogen in the Galaxy. The remaining 90% is in the form of warm ( 104 K), low density ( 0.1 cm-3), fully ionized regions which fill approximately 20% of the volume within a 2 kpc thick layer about the Galactic plane. This warm ionized medium or WIM (sometimes also referred to as the Diffuse Ionized Gas or DIG), is now recognized as a major component of the interstellar medium (e.g. [Kulkani & Heiles 1987]).
The primary sources of information about the WIM are pulsar dispersion measures and faint optical emission lines, most notably the H line. The amount of dispersion in pulsar signals is directly related to the quantity of free electrons along the line of sight toward the pulsar, quantified by the dispersion measure DM ne . The H emission results from recombination in ionized regions and is thusly related to the integrated electron density squared, quantified by the emission measure EM n .
The physical properties of interest for studies of turbulence in the WIM are the fluctuations in the electron density, magnetic field, and velocity field. The electron density fluctuations ne are the easiest to probe and are thought to trace the dynamically more important magnetic field and velocity fluctuations. These electron density fluctuations are quantified through the scattering measure SM. This quantity is observationally probed using radio frequency measurements of intensity scintillations and angular broadening of galactic and extragalactic sources (see the Cordes paper in this volume for details).
This paper will summarize the potential of the new Wisconsin H-Alpha Mapper (WHAM) facility for increasing our understanding of interstellar turbulence in the WIM. The relevance of the WHAM data to turbulence studies is three fold: 1) the H survey provides measurements of the emission measure EM for the entire northern sky for correlation studies with turbulent parameters such as the scattering measure, 2) the WHAM maps allow the study of spatial fluctuations in the WIM, and 3) the high spectral resolution of the WHAM spectrometer provides the opportunity to study both the bulk velocity structure of the WIM through velocity interval maps and thermal and non-thermal line broadening mechanisms through study of the spectral line widths. Each of these topics is explored further below.
2 The WHAM Facility
The recently completed Wisconsin H-Alpha Mapper (WHAM) facility is a powerful new tool for the study of very faint optical emission lines from the diffuse interstellar medium ([Reynolds et al. 1997]). WHAM consists of a 15-cm aperture, dual-etalon Fabry-Perot spectrometer coupled to a 0.6-m aperture siderostat. WHAM is located at Kitt Peak, AZ and is operated remotely from Madison, WI.
The primary purpose of the WHAM facility is to conduct a sensitive kinematic survey of the northern sky ( ) in the H line with 1o spatial resolution and 12 km s-1 spectral resolution over a 200 km s-1 wide spectral window centered near the local standard of rest velocity. The WHAM H survey will provide the first detailed look at the distribution and kinematics of the ionized gas in the Galaxy. This data set will be compared to existing H I surveys, which will allow study of the detailed inter-relationship between the neutral and ionized gas in the interstellar medium. The data for the survey have now been collected and the data reduction and calibration are currently being refined towards producing accurate all-sky maps to distribute to the astronomical community. Although WHAM has been used primarily for observations of H, the spectrometer can be tuned to any wavelength between 4800 and 7200 . In fact, observations of [S II] 6716 and [N II] 6584 have recently begun for selected areas of the sky ([Haffner et al. 1998]).
The spectra measured by the new WHAM instrument are much like the previous Wisconsin Fabry-Perot spectrometer, but the new instrument can measure a spectrum with the same signal-to-noise ratio in 100 times shorter integration time. This tremendous increase in sensitivity is realized through the technique of imaging the ring pattern passed by the Fabry-Perot etalons onto a CCD camera. The previous instrument used a single element (PMT) detector and therefore could only measure one spectral element at a time. The new method utilizes the dependence of the wavelength on the off-axis angle to measure the entire spectrum (approximately 4.4 ) all at once.
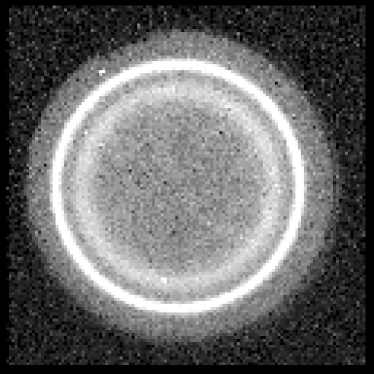
An example of data collected by the WHAM spectrometer is shown in the left panel of Figure 1. This is the raw CCD image of the ring pattern passed by the Fabry-Perot etalons acquired during a 30 second exposure toward the direction , (galactic coordinates) using the WHAM system. The outer ring is from H emission from the earth’s outer atmosphere (geocoronal emission) and the inner ring shows H emission from the diffuse interstellar medium of our Galaxy. The right panel of Figure 1 shows the spectrum derived from this image by summing pixels in concentric annuli (the red end of the spectrum is from the center of the ring image and the blue end from the edge.) The offset between the two components is largely due to the earth’s orbital velocity. Blending between the geocoronal and Galactic emission for a given direction can be minimized by carrying out the observation when the component of the earth’s orbital velocity vector along the line of sight is a maximum.

3 The Emission Measure
The H intensity along a line of sight is directly related to the emission measure, EM n (neglecting extinction due to dust). A study by [Spangler & Reynolds (1990)] investigated the relationship between the emission measure and the radio scattering disk at 1 GHz (a measure of the strength of scattering and directly related to the scattering measure SM). This study found a correlation between EM and SM, indicating that the two observations probe the same plasma. The study also found significant scatter about the expected relationship suggesting that the properties of the turbulence varied from sightline to sightline. These findings were confirmed by [Cordes et al. (1991)] in a study which compared SM to DM. The latter study found a clear correlation between SM and DM which steepened significantly beyond DM 80 pc cm-3. These studies make clear that in order to isolate the behavior of the turbulent properties of the ionized interstellar medium, it is important to know the amount of ionized gas along the lines of sight in addition to measures of the fluctuations. The WHAM H survey data will provide a rich resource for use in future studies of this sort.
Another way in which the EM has been used is to separate the ne and B components of variations seen in the Faraday rotation measures (RM ds) toward extragalactic radio sources. [Minter & Spangler (1996)] measured Faraday rotation measures toward 38 extragalactic sources in a region of the sky for which H intensity maps existed ([Reynolds 1980]). This allowed the first measurement of the magnetic field fluctuations in the WIM. This information combined with measurements of the outer scale and spectrum of the turbulent fluctuations allowed the calculation of the energy density in the turbulence. For a more detailed report on these findings, see Minter & Balser (this volume).
4 Non-thermal Line Broadening in the WIM
The measured widths of the H line from the WIM range from 15 to 50 km s-1 and result from thermal and non-thermal broadening mechanisms. By measuring spectra of both H and emission from a heavier atom such as the [S II] 6716 line, one can separate the thermal and non-thermal contributions to the line width. [Reynolds (1985)] carried out such a study of the warm ionized medium using data from 21 directions observed with the PMT based spectrometer. This pilot study showed that the temperature, while not tightly constrained, appears to be around 8000 K and that the non-thermal velocities have a broad range vnt 10 - 30 km s-1.
The WHAM spectrometer has already mapped a large region of the sky ( 2000 spectra) in the [S II] 6716 line with higher signal-to-noise than was possible with the previous spectrometer. Using these new data together with the H survey data, we will be able to form maps of the non-thermal velocity widths, allowing detailed study of the spatial and kinematic behavior of this quantity. Some of the non-thermal velocity width is due to smearing caused by differential Galactic rotation, but at high latitudes and at certain galactic longitudes, this effect is minimized allowing the study of the “turbulent” broadening component. It will be interesting to see how well vnt correlates with the scattering measure, for example.
5 Turbulent Heating in the WIM?
Using the results of [Minter & Spangler (1996)], [Minter & Spangler (1997)] have shown that the dissipation of turbulent energy in the WIM is a potentially important additional source of heating. [Minter & Balser (1997)] were able to reproduce the peculiar line ratios seen in the WIM using a model incorporating the dissipation of turbulence as an additional heating source. As a further indication that this may in fact be occurring, note that in data taken from [Reynolds (1985)], the [S II] 6716 / H ratio has been found to correlate with the non-thermal width vnt discussed above (Fig. 2; also see Fig. 2 in the Minter & Balser paper in this volume). Since the [S II] 6716 line is excited by thermal electrons, it will be brighter in regions with higher temperature. The correlation with vnt suggests that regions with strong turbulence have higher temperature, corroborating the suggestion that dissipation of turbulence is a source of heating. It should be noted, however, that variations in the brightness of the [S II] 6716 line can also occur due to ionization effects (i.e. variations in the fraction of sulfur that is in the singly ionized state.) The relationship between [S II] / H and vnt will be further investigated using the much more extensive and higher signal-to-noise WHAM data. Also, the [N II] 6584 / H ratio can simultaneously be measured as a control on whether the [S II] 6716 / H ratio is changing due to temperature variations, or an ionization effect. We have, in fact, already mapped approximately 1000 square degrees of the sky in all three of these lines ([Haffner et al. 1998]).

6 Large-scale Spatial and Velocity Structure
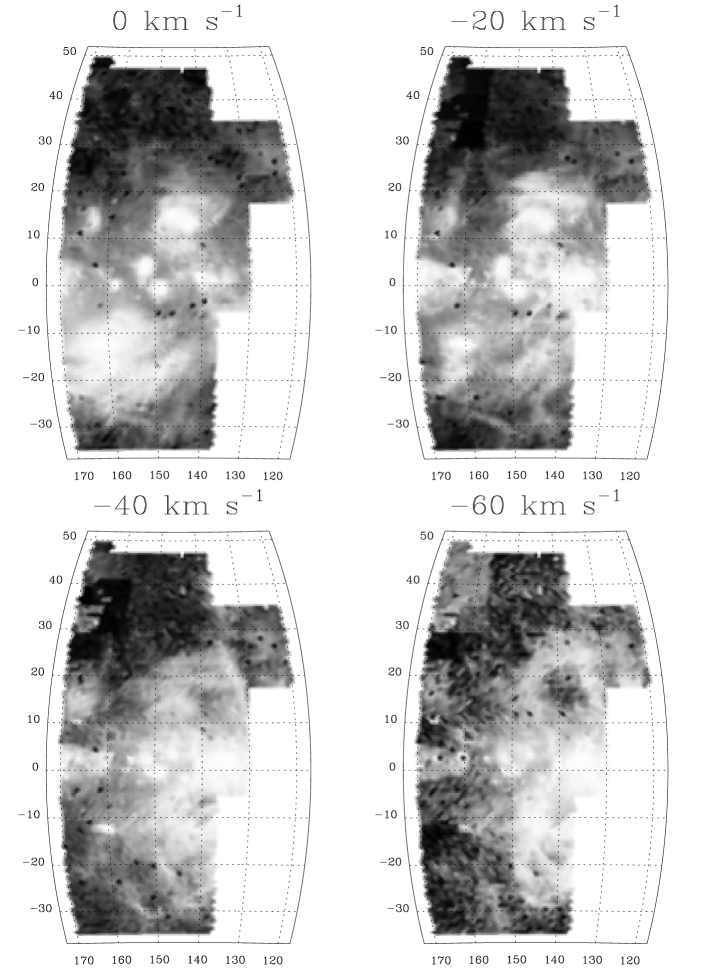
The ultimate energy source for turbulence in the interstellar medium is believed to be a combination of supernova explosions, winds from massive stars, and differential Galactic rotation. In all cases the energy is input on large spatial scales and must in some way cascade to smaller scales until it ultimately is thermalized and appears as heat. Fluctuations on the intermediate spatial scales can be investigated with the WHAM survey data in two ways. First, the spatial structure revealed in the survey data will reveal how clumpy the WIM is on scales larger than 1o. Second, the velocity structure revealed by the velocity interval maps measures the kinematics of the emission regions. This is illustrated in Figure 3, which shows WHAM velocity interval maps from a region of the sky toward the Perseus Arm. The four selected velocity interval maps are 12 km s-1 wide and are centered at velocities ranging from 0 km s-1 to –60 km s-1. Near the local standard of rest (0 km s-1) the maps reveal the structure and kinematics of local gas within a few hundred parsecs of the Sun. Two large, low surface brightness H II regions associated with high-latitude O stars, Cam at = 144o, = +14o and Per at = 160o, = -13o, dominate large portions of this map. At higher negative velocities (-40 km s-1 to -60 km s-1) the region is dominated by the diffuse ionized hydrogen in the Perseus spiral arm located 2 – 3 kpc from the Sun. Much of this gas appears to be associated with enormous arch-like features extending 1300 pc (30o) away from the Galactic midplane. Rich kinematic structure within these features is revealed by a comparison between the -40 km s-1 map and the -60 km s-1 map.
Acknowledgements.
This work has been supported by the National Science Foundation through grants AST9619424 and AST9122701.References
- Cordes et al. (1991) CORDES, J. M., WEISBERG, J. M., FRAIL, D. A., SPANGLER, S. R., & RYAN, M. 1991, Nature, 354, 121.
- Haffner et al. 1998 HAFFNER, L. M., REYNOLDS, R. J., & TUFTE, S. L. 1998, in preparation.
- Kulkani & Heiles 1987 KULKARNI, S. & HEILES, C. 1987, in Interstellar Processes, ed. D. J. Hollenbach & H. A. Thronson, Jr. (Dordrecht:Reidel), 87.
- Minter & Balser (1997) MINTER, A. H. & BALSER, D. S. 1997, ApJ, 484, L133.
- Minter & Spangler (1996) MINTER, A. H. & SPANGLER, S. R. 1996, ApJ, 458, 194.
- Minter & Spangler (1997) MINTER, A. H. & SPANGLER, S. R. 1997, 485, 182.
- Reynolds 1980 REYNOLDS, R. J. 1980, ApJ, 236, 153.
- Reynolds (1985) REYNOLDS, R. J. 1985, ApJ, 294, 256.
- Reynolds et al. 1997 REYNOLDS, R. J., TUFTE, S. L., HAFFNER, L. M., JAEHNIG, K., & PERCIVAL, J. W. 1997, Publications of the Astronomical Society of Australia.
- Spangler & Reynolds (1990) SPANGLER, S. R. & REYNOLDS, R. J. 1990, ApJ, 361, 116.