Contribution of Bright Extragalactic Radio Sources to
Microwave Anisotropy
Abstract
We estimate the contribution of extragalactic radio sources to fluctuations in sky temperature over the range of frequencies (10-300 GHz) used for Cosmic Microwave Background (CMB) anisotropy measurements. CMB anisotropy observations at high resolution and low frequencies are especially sensitive to this foreground. We have compiled a catalog of 2207 bright radio sources, including 758 sources with flux measurements at 90 GHz. We develop a method to extrapolate the source spectra and predict skymaps of extragalactic radio sources at instrument resolutions of FWHM. Our results indicate that the brightest radio sources will dominate microwave anisotropy for a wide range of resolutions and frequencies. Our skymaps predict the location and flux of the brightest radio sources at each frequency, making it straightforward to develop a template for masking the pixels containing them. This masking should be sufficient to protect high resolution CMB anisotropy observations from unacceptable radio source confusion.
submitted to the Astrophysical Journal
1 Introduction
The Cosmic Microwave Background Explorer (COBE) detection of large angle CMB anisotropy (Smoot et al. 1992) has sparked a drive to measure the anisotropy on smaller angular scales with the goal of determining crucial information about the density and expansion rate of the universe, the nature of dark matter, and the spectrum of primordial density perturbations. COBE DMR observations were basically unaffected by extragalactic foreground sources (Banday et al. 1996, Kogut et al. 1994) due to the large beam size ( FWHM). Because the contribution of a point source increases with the inverse of the beam area, observations at higher angular resolution are more sensitive to extragalactic foregrounds, including radio galaxies, bright infrared galaxies (Gawiser & Smoot 1997), high-redshift infrared galaxies (Blain et al. 1998, Gawiser, Jaffe, & Silk 1998, hereafter GJS), and the Sunyaev-Zeldovich effect from galaxy clusters (Aghanim et al. 1997). Estimates of extragalactic foreground confusion are critical as many ground-based, balloon-borne, and satellite experiments (MAP, Planck Surveyor) plan to study CMB anisotropies at angular scales from 5 to , and preliminary results are already available (e.g. Netterfield et al. 1997, Scott et al. 1996).
To evaluate the impact of known radio sources on CMB anisotropy observations, we use flux data from a variety of catalogs (see 2), including recent measurements, to construct models of source spectra as a function of frequency. We analyze simulated skymaps at frequencies from 10 to 300 GHz to determine the expected contribution of radio galaxies to foreground confusion of CMB temperature anisotropy. This information will be useful when choosing frequencies and regions of the sky to observe CMB fluctuations on small angular scales. This work represents a significant improvement over previous efforts (Toffolatti et al. 1995, 1998, Franceschini et al. 1989) which depended upon galactic evolution models to predict the contribution of simulated radio sources at microwave frequencies. Our catalog contains detailed observations of known sources and hence can be used to make a spatial template for masking out their emission, and we believe that this phenomenological approach will lead to greater accuracy in predicting source counts and the overall level of foreground anisotropy.
2 Our Catalog
The discrete radio sources used in this project were compiled from a number of separate catalogs. Our current catalog includes flux measurements and their corresponding errors at multiple frequencies for 2207 sources. We have focused our attention on obtaining all available radio observations at millimeter and sub-millimeter wavelengths, resulting in 5766 observations of 758 different sources at 90 GHz, 890 observations of 229 different sources from 100-200 GHz, and 2628 observations of 309 different sources at frequencies above 200 GHz. The sources are roughly isotropic in distribution, except for a significantly greater number of sources in the northern celestial hemisphere due to the anisotropic distribution of radio telescopes on Earth. In addition, there are noticeably fewer observations within of the galactic plane and the celestial north pole due to the difficulty of observing extragalactic radio sources in those locations.
Our catalog includes the full-sky 5 GHz-selected 1 Jy sample of Kühr et al. (1981). We add high-frequency ( GHz) measurements (Steppe et al. 1988, 1992, 1995; Tornikoski et al. 1996; Kreysa 1998; Antonucci, Barvainis, & Alloin 1990; Beichman et al. 1981; Chini et al. 1989; Gear et al. 1994; Edelson 1987; Holdaway, Owen, & Rupen 1994; Knapp & Patten 1991; Landau et al. 1980, 1983, 1986; Lawrence et al. 1991; Nartallo et al. 1997; Owen et al. 1978; Owen, Spangler, & Cotton 1980; Stevens, Robson, & Holland 1996; Chandler 1995; VLA Memo#193) and centimeter-wavelength observations (Herbig and Readhead 1992; Patnaik 1992; Wiren et al. 1992; Stanghellini et al. 1997; Perley 1982; Cotton 1980; Aller et al. 1985; VLA Calibrator Manual). An updated version of the catalog with more detail will be described by Gawiser, Sokasian, & Smoot (1998, hereafter GSS).
3 Spectral Fitting
Some extragalactic radio sources have complex spectra which cannot be approximated by simple functional forms due to emission from both compact and extended structures which dominate at different frequencies. In most radio galaxies, the emission comes from radio lobes located symmetrically around the core. The dominant emission mechanism, synchrotron, can be well approximated by a simple power law,
| (1) |
with a flux spectral index, , typically between 0.5 and 1.0 (Platania et al. 1997). Some radio sources have compact active nuclei which generate flat-spectrum radio emission. The spectra of these sources can be inverted () for most of the radio frequency range due to self-absorption of the lower frequency emission. Attempts to fit the observational data have yielded a variety of results. The central engine of a typical active galaxy may consist of a supermassive black hole surrounded by an accretion disk and accelerating a jet of relativistic particles perpendicular to the disk plane (e.g. Urry & Padovani 1991). Böttcher et al. (1997) proposed a model in which the inverted spectrum of NGC 3031 is assumed to be the emission of a jet component, becoming optically thin to the radio emission of a monoenergetic pair plasma at decreasing frequencies as it moves outward and expands.
For sources which lack direct high-frequency observations, we avoid trying to determine the nature of the emission mechanism. Instead, we use a phenomenological approach based on the expectation that the spectra of most radio sources approach power law behavior at frequencies higher than GHz (Verschuur & Kellerman 1988). This power law may then be used to extrapolate the spectrum to typical CMB observation frequencies. A previous phenomenological approach (Tegmark & Efstathiou 1996) extrapolated 1.4 GHz source counts by assuming flat-spectrum emission for all sources. Our method has the advantages of using the actual source locations, which can be turned into templates for masking the brightest pixels on the sky. To determine if there is any spectral index clustering, we use sources that have been measured near 1.4, 10, and 90 GHz and plot each source’s spectral index from 1.4 GHz to 10 GHz versus its index from 10 GHz to 90 GHz in Figure 1. There is a vague clustering of bright sources (circles) consistent with the notion that the brightest sources selected at low frequencies tend to have steep spectra. The overall scatter of source spectra in Figure 1 shows that it is wrong to categorize radio sources into template spectra or a narrow spectral index range. This motivates us to fit the spectra of each source individually.
To determine the frequency beyond which a power law (a line on a log-log plot) can be fitted to the spectra of a given source, we use an iterative model which starts with the best-fit line to the three highest frequency data points and repeatedly includes the next highest frequency data point to the set to which it fits a line. The fitting stops when the reduced starts to get worse or becomes acceptable (). There is little evidence that inverted spectra are common past 30 GHz (Steppe et al. 1995, Stanghellini et al. 1997), so we set the few inverted () high-frequency spectra in the catalog to flat () spectra. These inverted spectra appear to result from variable sources being observed at different epochs at different frequencies, and we find that most of the sources with in Figure 1 based on their mean 10 and 90 GHz fluxes are better fit by an power-law when all observations are taken into account. The average high-frequency spectral index was 0.5 with 27% of the sources in our catalog having steep spectra (), and 37% having flat spectra ().
To check the accuracy of this technique, we ran our extrapolation method on sources with observations at 90, 150, and 230 GHz while ignoring the observations above certain frequencies and then compared the measured fluxes with the extrapolated fluxes. The results (Table 1) show that the extrapolation method works best when there is at least one measurement at 20 GHz or greater, as expected since many spectra become power-law past 5 GHz. Table 1 shows that on average we overpredict the flux at 90 GHz by a factor of 1.6, even when measurements above 20 GHz are used. However, the median such error factor is only a factor of 1.1 overestimate, so we have roughly an equal number of over- and under-estimates. This is no longer the case at 230 GHz, where even the median error factor is 1.9; our extrapolation method is overestimating the typical flux due to flat spectra falling off to more typical synchrotron spectra at frequencies around 100 GHz (Gear et al. 1994). It is difficult to predict how far this fall-off will last, as thermal emission from low levels of dust in these radio-bright galaxies are expected to dominate their spectra by 500 GHz, except for the BL Lacs which have flat spectra up to infrared wavelengths (Knapp & Patten 1991, Chini et al. 1989, Landau et al. 1986). We therefore only trust our extrapolation in the range that has been tested, up to a maximum frequency of 300 GHz. As the radio sources that have been observed at 30-300 GHz were selected at lower frequencies for brightness and flat spectra, our errors are only good estimates for this type of radio sources. This selection effect is not a great concern, however, as those are exactly the type of radio sources that threaten CMB anisotropy observations. When interpolation is required, we use a cubic spline which passes through the mean fluxes at the observed frequencies. We visually inspected all 2207 sources to check the algorithm and eliminate any serious errors or outliers.
For planned CMB anisotropy experiments, an additional concern is that the flat-spectrum radio sources can vary by up to a factor of ten in flux since their emission comes from a compact, active core. Typical variations occur on timescales of one month to one year, although the overall spectrum shape is often preserved for a decade or longer (Tornikoski et al. 1993). We use the scatter in the observed fluxes of a source at each frequency to estimate the typical range of variability, which yields an error bar on the source’s flux at that frequency about the mean of all observations. Because the variations are not periodic, there is little more that can be done, unless sources are observed nearly simultaneously at higher resolution and nearby frequencies. GSS looks at the issue of variability in detail, including the possibility of extrapolating long-term drifts in source flux to the next epoch of observation. Radio sources are typically 4-7% polarized, and this polarization is variable (Nartallo et al. 1997), so radio-source foreground subtraction will be an important consideration for CMB polarization observations as well.
4 Results
We use the fitted spectra to predict the microwave flux of each radio galaxy in Jy ( Jy W/m2/Hz). To convert from flux to antenna temperature , we use
| (2) |
where is Boltzmann’s constant, is the wavelength, and is the effective beam size of the observing instrument. The antenna temperature of the Cosmic Microwave Background radiation, which has a thermodynamic temperature of TK, is given at frequency by
| (3) |
defining . Fluctuations in antenna temperature caused by point sources will appear as thermodynamic temperature fluctuations in the CMB according to
| (4) |
The intrinsic of the CMB found by COBE is and is expected to vary between that and at the angular resolutions considered here.
An analysis of source counts indicates that the northern celestial hemisphere subset of our catalog appears to be complete down to an extrapolated flux of 1.0 Jy at 90 GHz while the southern hemisphere is incomplete below 2.0 Jy at 90 GHz. For the purposes of statistical analysis we have concentrated on the northern hemisphere where we appear to have measurements of the 200 brightest sources in the hemisphere. We cannot rule out the existence of an unrelated population of sources peaking around 90 GHz which are not bright at lower frequencies, as 90 GHz observations have only been made for sources selected at frequencies below 10 GHz (this hypothetical source population is limited by GJS). The brightest sources will dominate the anisotropy unless they are masked, because uncertainty in their exact fluxes makes subtraction highly inaccurate. After masking, the brightest remaining sources will dominate unless non-Poissonian clustering becomes appreciable. Toffolatti et al. (1998) have shown that non-Poissonian clustering is not expected to make an important contribution to the foreground anisotropy from radio sources.
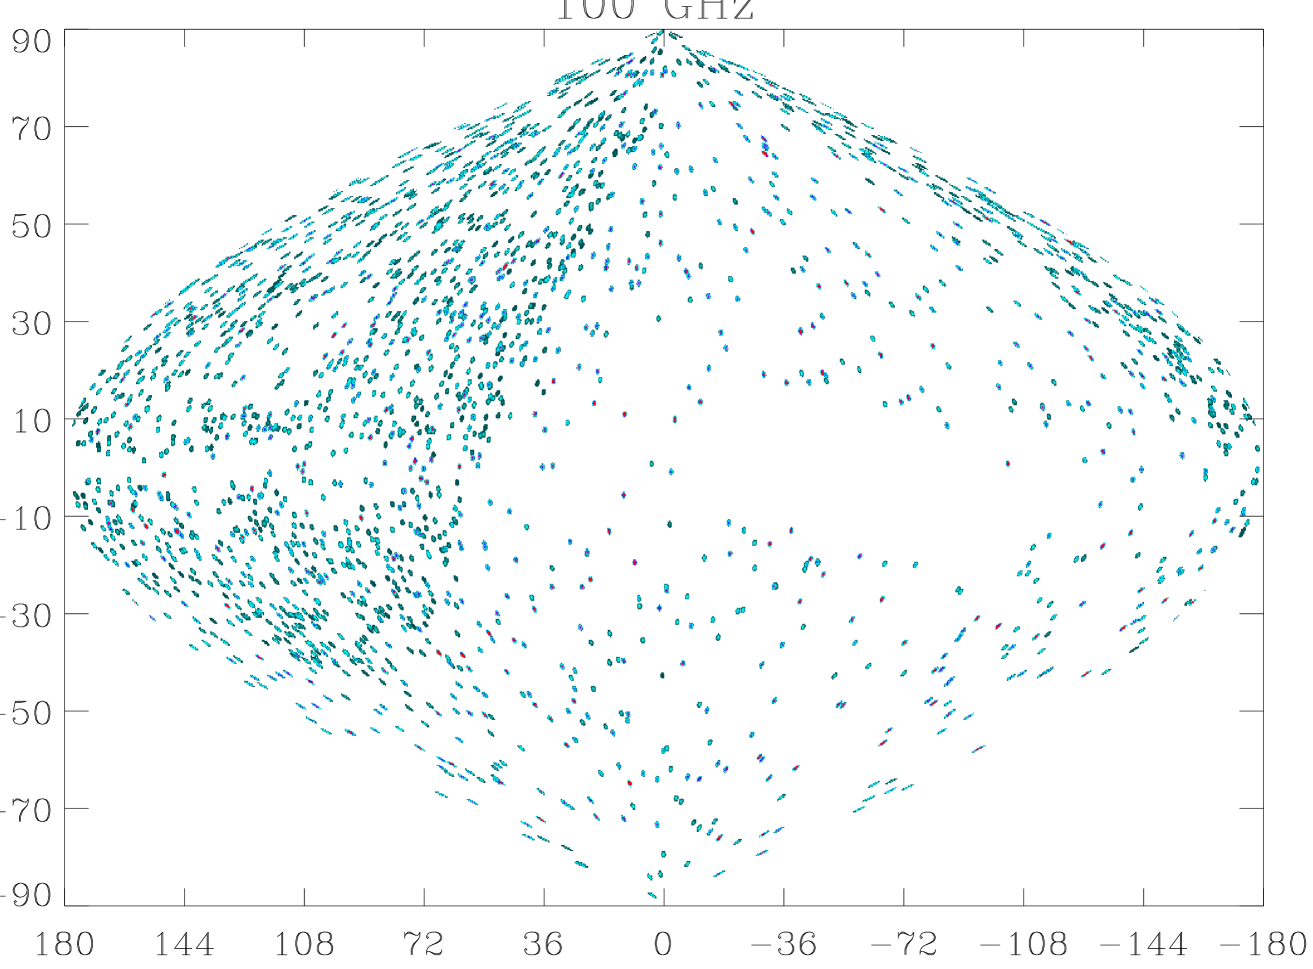
To simulate observations, we convolve all sources on pixelized sky maps (twice oversampled) of resolution varying from to at frequencies between 10 and 300 GHz. The information contained in these sky maps can be used to choose regions for observation (Smoot 1995) and pixels to be masked during data analysis. Figure 2 shows a 30′ resolution skymap at 100 GHz; pixels at the maximum of the color table should be masked. To avoid underestimating the anisotropy and to reduce the possibility of residual galactic contamination, we use only the portion of each skymap which covers galactic latitudes and corresponds to the northern celestial hemisphere to produce estimates of .
Figure 3 shows a summary of our results for several relevant instrument resolutions. The inverse relationship between anisotropy and FWHM arises due to the combined effects of beam convolving and pixelization. The exact level of oversampling causes a small change in the measured anisotropy, but the 1/FWHM behavior should hold for extrapolation to smaller resolutions (see GJS).
We also analyze in the northern hemisphere based on only the 758 sources with 90 GHz measurements. The resulting rms at 90 GHz with a FWHM of is which dominates the anisotropy since the rms from extrapolating the spectra of the other 1449 sources amounts to only . This indicates that we have flux measurements for the vast majority of bright 90 GHz radio sources. Refregier, Spergel, & Herbig (1998) find that the source detection limit for MAP pixels will be 2 Jy at 90 GHz. We have 108 sources in our catalog which have been observed to be brighter than 2 Jy at 90 GHz at least once, but only 42 sources have a weighted average flux that high, and a total of 52 sources are predicted to be brighter than 2 Jy at 90 GHz. We estimate that there will be 40-50 radio sources on the sky brighter than 2 Jy at 90 GHz. At the 0.4 Jy level, Toffolatti et al. (1998) predict roughly twice as many sources as we do, but our prediction falls within their range of uncertainty. As the source counts we predict at this level based on the northern celestial hemisphere should be nearly complete, we recommend a slight recalibration of the galaxy evolution models used by Toffolatti et al., although a factor of two represents remarkable agreement for such different approaches.
Table 2 lists the expected level of anisotropy and the number of detected radio sources in MAP and Planck channels if this type of straightforward source detection and subtraction is performed. Since the 90 GHz MAP channel will have a resolution close to we expect a source detection limit of 1 Jy at 90 GHz. These detected sources represent a list of the few hundred brightest radio sources in the sky at each frequency. The anisotropy levels are shown in Figure 3. The level of source confusion drops if the brightest sources () are subtracted. Table 3 shows how the expected level of temperature anisotropy from radio sources varies with cutoff level, where we use our catalog to obtain prior information on which pixels are expected to contain sources at a given flux level and then mask those pixels. While all pixels can be masked without such prior information if the CMB anisotropies are assumed to follow a Gaussian distribution, it is impossible to remove all pixels without crippling the analysis. The actual improvements from masking all pixels expected to contain sources may be less than indicated, unfortunately, due to the effect of incompleteness in our catalog. GSS attempt to fill in this incompleteness using full-sky catalogs at 5 GHz. If we were to settle for making the southern celestial hemisphere as complete as the northern is now, we could create a mask for all sources expected to contribute at the 3 level, which is enough to make a significant reduction in radio source contamination versus 5 subtraction alone.
5 Discussion
Spectral analysis of bright radio sources indicates that their spectra are complex and cannot in general be categorized into template spectra or single power-laws. The results from our analysis of extrapolation errors suggest that our phenomenological approach of fitting a power law to the high-frequency end of each spectrum is a reasonable model to use to extrapolate radio sources to microwave frequencies. Although subject to systematic errors on a galaxy-by-galaxy basis, we expect our overall extrapolation results to be accurate to within a factor of two at 90 GHz.
Our analysis of foreground confusion from extragalactic radio sources indicates that they contribute negligibly to COBE resolution observations of the CMB, consistent with the conclusion of Banday et al. (1996). However, they do become problematic at higher resolution. Our results set a lower limit on the anisotropy and provide a list of the brightest sources in the sky which can be used to mask pixels in future high-resolution CMB observations. The contribution of extragalactic radio sources to CMB anisotropy is comparable at 200 GHz to that of bright extragalactic infrared sources (Gawiser & Smoot 1997, Toffolatti et al. 1998). Our current results indicate a valley at around 200 GHz where the anisotropy from radio sources is a minimum; adding in the contribution from infrared-bright galaxies should move that valley towards 150 GHz.
The results of this investigation motivate an expansion of our catalog so that sources which will contribute to anisotropies on the 1 level can be masked. It is clear that the current generation of CMB anisotropy experiments must pay close attention to the possibility of radio point source contamination at all frequencies. Masking pixels which contain bright radio galaxies should reduce this foreground to a manageable level.
6 Acknowledgments
We thank Cameron Murray and Chris Witebsky for their diligent work in compiling the radio catalog, Jon Aymon for writing IDL display routines, Tom Herbig and Chris Witebsky for providing us with useful software, Ernst Kreysa, Harri Terasranta, Merja Tornikoski, and Esko Valtaoja for providing us with recent data pre-publication, Mark Holdaway for helping us obtain the MMA Memo, and Bruce Partridge, Malcolm Bremer, David Spergel, Alex Refregier, Alastair Edge, Andrew Blain, Jason Stevens, Doug Finkbeiner, and Jose Luis Sanz for helpful conversations. A.S. acknowledges the support of an LBNL Summer Research Fellowship. E.G. acknowledges the support of an NSF Graduate Fellowship. This work is supported in part by the DOE Contract No. DE-ACO3-76SF00098 through Lawrence Berkeley National Laboratory and NASA Long Term Space Astrophysics Grant No. 014-97ltsa award #NAG5-6552.
References
- (1)
- (2) Aghanim, N., De Luca, A., Bouchet, F. R., Gispert, G., & Puget, J. L. 1997, A&A, 325, 9
- (3)
- (4) Aller, H. D., Aller, M. F., Latimer, G. E., & Hodge, P. E. 1985, ApJS, 59, 513
- (5)
- (6) Antonucci, R., Barvainis, R., & Alloin, D. 1990, ApJ, 353, 416
- (7)
- (8) Banday, A. J., et al., ApJ, 468, L85
- (9)
- (10) Beichman, C. A., Neugebauer, G., Soifer, B. T. Wootten, H. A., Roellig, T., & Harvey, P. M. 1981, Nature, 293, 711
- (11)
- (12) Blain, A.W., Ivison, R.J., Smail, I., & Kneib, J.-P. 1998, to appear in Wide-field surveys in cosmology, Proc. XIV IAP meeting, astro-ph/9806063
- (13)
- (14) Böttcher, M., Reuter, H. P., & Lesch, H. 1997, A&A, 326, 33, astro-ph/9707353
- (15)
- (16) Chandler 1995, VLA Memo #192, unpublished
- (17)
- (18) Chini, R., Biermann, P. L., Kreysa, E., & Gemund, H. P. 1989, A&A, 221, L3
- (19)
- (20) Cotton, W. D. 1980, AJ, 85, 351
- (21)
- (22) Edelson, P. A., 1987, AJ, 94, 1150
- (23)
- (24) Franceschini, A., Toffolatti, L., Danese, L., & De Zotti, G. 1989, ApJ, 344, 35
- (25)
- (26) Gear, W. K. et al. 1994, MNRAS, 267, 167
- (27)
- (28) Gawiser, E., Jaffe, A., & Silk, J. 1998, astro-ph/9811148 [GJS]
- (29)
- (30) Gawiser, E. & Smoot, G. F., 1997, ApJ, 480, L1
- (31)
- (32) Gawiser, E., Sokasian, A., & Smoot, G. F., 1998, in preparation [GSS]
- (33)
- (34) Herbig, T. & Readhead, A. C. S., 1992, ApJ, 81, 83
- (35)
- (36) Holdaway, M. A., Owen, F. N. & Rupen, M. P., 1994, NRAO Report, MMA Memo #123, unpublished
- (37)
- (38) Knapp, G. R., & Patten, B. M. 1991, AJ, 101, 1609
- (39)
- (40) Kogut, A., et al. 1994, ApJ, 464, L5
- (41)
- (42) Kreysa, E. 1998, private communication
- (43)
- (44) Kühr, H., Witzel, A., Pauliny-Toth, I. I. K., & Nauber, U. 1981, A&AS, 45, 367
- (45)
- (46) Landau, R., Epstein, E., & Rather, J. D. G. 1980, AJ, 85, 363
- (47)
- (48) Landau, R. et al. 1986, ApJ, 308, 78
- (49)
- (50) Landau, R. et al. 1983, ApJ, 268, 68
- (51)
- (52) Lawrence, A. et al. 1991, MNRAS, 248, 91
- (53)
- (54) Nartallo, R., Gear, W. K., Murray, A. G., Robson, E. I., & Hough, J. H. 1997, MNRAS, 297, 667, astro-ph/9712219
- (55)
- (56) Netterfield, C. B. et al., 1997, ApJ, 474, 47
- (57)
- (58) Owen, F. N., Porcas, R. W., Mufson, S. L., & Moffett, T.J. 1978, ApJ, 83, 685
- (59)
- (60) Owen, F. N., Spangler, S. R., & Cotton, W. D. 1980, AJ, 85, 351
- (61)
- (62) Patnaik, A. et al. 1992, MNRAS, 254, 655
- (63)
- (64) Perley, R. A. 1982, AJ, 87, 859
- (65)
- (66) Platania, P. et al., 1997, ApJ, 505, 473, astro-ph/9707252
- (67)
- (68) Refregier, A., Spergel, D. N., & Herbig, T. 1998, astro-ph/9806349
- (69)
- (70) Scott, P. F. S. et al., 1996, ApJ, 461, L1
- (71)
- (72) Smoot, G. F. et al. 1992, ApJ, 396, L1
- (73)
- (74) Smoot, G. F. 1995, Astrophys. Lett. and Communication, 32, 297
- (75)
- (76) Stanghellini, C., O’Dea, C. P., Baum, S. A., Dallacasa, D., Fanti, R., & Fanti, C. 1997, A&A, 325, 943
- (77)
- (78) Steppe, H., Salter, C. J., Chini, R., Kreysa, E., Brunswig, W., & Lobato-Perez, J. 1988, A&AS, 75, 317
- (79)
- (80) Steppe, H., Liechti, S., Mauersberger, R., Kompe, C., Brunswig, W., & Ruiz-Moreno, M. 1992, A&AS, 96, 441
- (81)
- (82) Steppe, H., Jeyakumar, S., Saikia, D. J., & Salter, C. J. 1995, A&AS, 113, 409
- (83)
- (84) Stevens, J. A., Robson, E. I., & Holland, W. S. 1996, ApJ, 462, L23
- (85)
- (86) Tegmark, M., & Efstathiou, G. 1996, MNRAS, 281, 1297
- (87)
- (88) Toffolatti, L. et al. 1998, MNRAS, 297, 117, astro-ph/9711085
- (89)
- (90) Toffolatti, L. et al. 1995, Astro. Lett. and Communication, 32, 125
- (91)
- (92) Tornikoski, M. et al. 1996, A&AS, 116, 157
- (93)
- (94) Tornikoski, M., Valtaoja, E., Terasranta, H., Lainela, M., Bramwell, D., & Botti, L. C. L. 1993, AJ, 105, 1680
- (95)
- (96) Urry, C. M. & Padovani, P., 1991, ApJ, 374, 431
- (97)
- (98) Verschuur, G. L., & Kellerman, K. I., ed., Galactic and Extragalactic Radio Astronomy, 2nd ed., 1988, New York, Springer-Verlag, Chapters 13,15
- (99)
- (100) VLA Calibrator Manual, 1997, unpublished
- (101)
- (102) VLA Memo #193, unpublished
- (103)
- (104) Wiren, S., Valtaoja, E., Terasranta, H., & Kotilainen, J. 1992, AJ, 104, 1009
- (105)
| Frequency tested | Frequencies ignored | Avg. Extrapolation Error | Avg. Error Factor |
| 90 GHz | 2 GHz | 209 % | 2.5 |
| 90 | 10 | 148 | 2.3 |
| 90 | 20 | 133 | 2.0 |
| 90 | 90 | 92 | 1.6 |
| 150 | 90 | 94 | 1.5 |
| 230 | 90 | 250 | 3.2 |
| Frequency (GHz) | FWHM | Source detection limit | # detected | |
|---|---|---|---|---|
| MAP 20 | 56′ | 1.4 Jy | 186 | |
| 30 | 41 | 1.2 | 216 | |
| 40 | 28 | 0.9 | 265 | |
| 60 | 21 | 1.1 | 168 | |
| 90 | 13 | 1.0 | 161 | |
| Planck 30 | 33 | 0.9 | 290 | |
| 44 | 23 | 0.8 | 285 | |
| 70 | 14 | 0.6 | 360 | |
| 100 | 10 | 0.6 | 304 | |
| 143 | 7 | 0.6 | 323 | |
| 217 | 5 | 0.3 | 533 | |
| 353 | 4.5 | 0.2 | 644 | |
| 545 | 4.5 | 0.4 | 289 | |
| 857 | 4.5 | 0.7 | 125 |
| Threshold (Jy) | # Sources above Threshold | |
|---|---|---|
| None | 0 | |
| 2 (10 ) | 49 | |
| 1 () | 161 | |
| 0.6 () | 346 | |
| 0.2 () | 940 |