Abstract
The knowledge of the contribution to the artificial sky luminance in a given point of the sky of a site produced by the sources beyond a given distance from it is important to understand the behaviour of light pollution in diffusely urbanized areas and to estimate which fraction of the artificial luminance would be regulated by norms or laws limiting the light wasted upward within protection areas of given radii.
I studied the behaviour of constructing a model for the propagation of the light pollution based on the modelling technique introduced by Garstang which allows to calculate the contribution to the artificial luminance in a given point of the sky of a site of given altitude above sea level, produced by a source of given emission and geographic position. I obtained integrating the contribution to the artificial luminance from every source situated at a distance greater than . I also presented an analitical expression for depending mainly from one parameter, a core radius, well reproducing model’s results. The artificial sky luminance produced in a given point of the sky of a site from the sources situated at a distance greater than from the site decrease in diffusely urbanized areas as i.e. much slowler than the artificial luminance of a single source which decrease as . In this paper I present the results for at some Italian Astronomical Observatories. In a diffusely urbanised territory the artificial sky luminance produced by sources located at large distances from the site is not negligible due at the additive character of light pollution and its propagation at large distances. Only when the core radius is small, e.g. for sites in the inner outskirts of a city, the sky luminance from sources beyond few kilometers is negligible. The radii of protection zones around Observatories needs to be large in order that prescriptions limiting upward light be really effective.
1 Introduction
Light pollution is a quantity characterized by additivity and propagation at large distances. Walker (1970, 1973) showed that the light coming from a big city can pollute the sky at a great distance from it. Garstang (1989b) calculated with numerical models the artificial sky luminance in some quite isolated Astronomical Observatories of worldwide interest showing the frequent presence of non negligible pollution coming from light propagating there from very far sources. Already Bertiau et al (1973) showed the dramatic impact of additive behaviour of artificial light scattered by atmospheric particles and molecules in determining the sky luminance and the related limiting magnitude loss.
The artificial sky luminance produced in a site from a single source, like a city, decreases rather rapidly with the distance from the source. In fact roughly (Walker 1973; see also Garstang 1991a). This slope might wrongly suggest that in territories where there aren’t big cities able to produce light pollution to great distances only the sources of light pollution situated in the neighbourhood of a site are responsible of the artificial luminance of its sky. This is not true in diffusely populated areas where there aren’t big cities but a spread-out myriad of small cities because the artificial sky luminance produced from each source sums together. In this case the effects depend strictly on the sources distribution. When a territory is so diffusely populated that the distribution of sources can be considered a continuum, circular sections with constant thickness and increasing radius centered on the site contain an increasing number of sources so that the diminution of their effects on the sky at the site due to the increased average distance is somehow counterbalanced by the growth of the number of sources. So the global effects of all sources beyond a given distance decrease with this distance much slower than the effect of a single source. This is a fundamental phenomenon in areas, like as an example the Padana plain in Veneto (Italy), where the population is distributed in a myriad of cities and towns in such way to cover almost all the entire territory. This means that zones of territory even very far from the site can contribute remarkably to the luminance of its sky. This implies that laws for the protection of the sky of a site must be able to act on polluting sources at remarkable distances from the site, otherwise their efficacy would be scarce.
In this paper I demonstrate, both with simple analytical and detailed numerical modeling for light pollution propagation, that contributions to the zenith sky luminance from areas beyond a given distance decrease slowly in diffusely urbanized areas with increasing distance. I also present an analytic formula working for diffusely populated territories and results for some Italian Observatory sites. In section 2 the analytic formula for the sky luminance produced by sources beyond a circular area of given radius is presented and discussed. In section 3 the detailed modelling technique is illustrated. In section 4 the results are compared with those obtained with other laws. In section 5 results for some Italian Observatories are presented. The section 6 contains my conclusions.
2 Elementary theoretics
In order to understand the behaviour of light pollution in diffusely urbanized areas, let’s calculate the zenith sky luminance at a site produced from the sources beyond a given distance from it. Let’s assume that in a territory the population is distributed homogeneously with a density of inhabitants for unit of surface. This happens, as an example, in the Veneto’s plain (Italy) where the population is distributed in a myriad of cities and towns so it covers almost all the territory. Let’s also assume that a law of the type is valid there which gives the artificial luminance at the zenith produced by a source city of given population in function of the distance from it and that this law can be applied to each area of territory of population .
The area of an infinitesimal circular section of thickness at the distance from the site and centered on it, is and its total population is , where is the population for surface units in the considered territory. The sky luminance produced at the zenith of the site from this infinitesimal circular section is . In order to compute the sky luminance produced by all the sources outside the distance we need to integrate the last expression between and infinity :
| (1) |
Even without performing the computation of the integral, readers can see that on increasing the distance from the site decreases slower than the function .
In order to compute the integral (1) we need a Law giving the sky luminance at the zenith. In order to became simple, we will assume which is an extension of Walker Law. The exponent depends on the aerosol content of the atmosphere through its optical thickness and on the zenith and azimuth angles of the direction of observation (Joseph et al. 1991; Garstang 1986). We assumed at zenith which is valid in the range between 1 and 30 km for an optical thickness of (Joseph et al. 1991, fig. 5 - 6) giving a vertical extinction of mag V. Garstang (1986, 1989) showed that a power law relation between the artificial sky luminance and the distance of its source is not exact, the exponent of Walker Law becoming larger for increasing distance . The effects of Earth curvature contribute to this tendency. Nevertheless, everywhere is an adequate approximation for the purposes of this computation. Other propagation laws, like e.g. the Treanor Law (Treanor 1973), can be used in (1), as well more sophisticated computations like that I used in section 4.1, which will be described in section 3.
With the integral solved gives (Cinzano 1997):
| (2) |
This law expresses the contribution to the total artificial luminance at the zenith in a site produced from all the territory situated outside a given distance .
It can be improved taking in account two phenomena: (i) when the distance from a site is under a given value that we can call ” Core radius ” the uniformity of the distribution of the sources stops because the scale comes down to the level of the irregularities in the distribution itself. Therefore deviates from the expression (2) and tends to become constant in the neighbourhood of the site where there aren’t light sources. (ii) the curvature of the Earth diminishes in a non negligible way the contribution of the areas beyond about 80 km. In order to mimic approximately the behaviour produced by (i), I corrected the expression (2) inserting a ”core”. In order to mimic approximately the behaviour given by (ii), I inserted in the expression (2) a little correction factor taking in account the diminution of contribution from distant sources. If the law is not applied beyond about 100 km from the site, in first approximation k can be considered a constant which subtracts the overestimated contribution from sources outside this distance. Taking into account both phenomena we can write:
| (3) |
where is the core radius, is a parameter giving the shape of the curve in the core, where . For the slope of is like expression (2) and for it becomes constant. The core radius isn’t the distance from the site of the nearest source but it is the scale distance under which the uniformity of population distribution vanishes.
Normalizing the formula (3) so that for , we obtain:
| (4) |
because . Some applications of this formula will be presented in section 4. The core radius is strictly depending on the distribution of sources around the site. The slope parameters and the coefficient are less sensitive and typical values are respectively and .
3 Detailed modelling
In order to study with more detail the artificial sky luminance produced in a given point of the sky of a site from the sources situated at a distance greater than from the site, I applied a model for the propagation of the light pollution based on the modelling technique introduced by Garstang (1986, 1987, 1988, 1989a, 1989b, 1989c, 1991a, 1991b, 1991c, 1992, 1993, 1999). The model allows to calculate the contribution to the artificial luminance in a given position on the sky of a site of given altitude above sea level, produced by a source of given emission and geographic position. I obtained integrating the contribution to the artificial luminance of every source situated at a distance greater than . Readers are referred to the papers cited above for a detailed description and discussion of the models. Here I will describe their outline.
For every infinitesimal volume of atmosphere along the line of sight, I calculated the illuminance produced directly by the source and that produced by the light scattered there from molecules and aerosols, estimated according to the method of Treanor (1973) extended by Garstang (1986, 1989). Then I computed the quantity of light scattered in direction of the observer by the molecules and the aerosols in the infinitesimal volume. Integrating along the line-of-sight, I obtained the artificial luminance of the sky. In photometrical bands different from the visual band, as the astronomical B band, the photon radiance can be obtained. If required, they can be transformed in brightnesses in with Garstang (1989) formulae.
As Garstang(1986, 1989a), I assumed that the distribution of the upward emission of light from a city is axisymmetric, i.e. it depends only on the angle with the vertical, and that it is expressed by a function that will be discussed in section 4. I assumed that the lighting habits are similar in all the cities of the considered territory, and than the quantity of light wasted from the night-time external lighting system of a city is proportional to its population (e.g. Walker 1988). Falchi and Cinzano(1999) analyzing some night-time satellite images of Italy pointed out that the upward emission of italian cities might depend on a power of 0.8 of their population. Nevertheless in the range of population considered here the direct proportionality between the upflux and the population is a good approximation for the purposes of this paper. I assumed that differences from the mean were casually distributed in the territory. Considering economically homogenous zones, not larger than 120-150 km, I had not to insert in the calculation a coefficient of city development connected with the geographic position as Bertiau et al. (1973). The population data refers to the year 1995 and geographical positions and radii of cities refers to 1991. They were provided by the Istituto Nazionale di Statistica (ISTAT). I have considered as point sources the cities when the line of sight did not approach them closer than 12 times their radius and I have used in the other cases a seven points approximation (Abramowitz and Stegun 1964). I assumed that the density of molecules and aerosols decreases exponentially with the altitude. The angular scattering function of the atmospheric aerosols was given by Garstang (1991b) interpolating measurements from McClatchey et al. (1978).
The aim of the model is the computation of the artificial luminance in a site not far from very populated areas and not the computation of the small luminance produced by far sources in very good international observatory sites like e.g. Garstang (1989b), so I have neglected to take in account the Earth curvature. The inclusion of earth curvature causes luminance contributions from distant cities to fall off more rapidly with distance than for a flat Earth model (Garstang 1989a). The effects of the land curving on the luminance near the zenith are of the order of 2 percent for sources outside 50 km and can reach 35-40 percent at about 100km (Garstang 1989a). In the applications that have been made, a predominant fraction of luminance was produced within the first 60 km from the site and less than 5 percent outside about 90 km, so the choice to neglect curvature is adequate.
In the calculation I have not taken in account that mountains can shield part of the light of a source to the atmospheric particles situated along the line of sight of the observer at the site. Mountains between source and observatory shield the light emitted from the source with an angle less than where H is the height of the mountain and p its distance from the source. The ratio between the luminance in the shielded and not shielded cases is given, in first approximation, by the ratio between the number of particles illuminated in the two cases:
| (5) |
where q is the distance of the site from the source, , , and are respectively the number of particles of aerosol and molecules at the altitude h and their angular scattering sections and roughly . This expression show that, taken in account the vertical size of the atmosphere in respect the height of mountains, shielding has a not negligible effect only when the source is quite near to the mountain and both are very far from the site: . This condition in the territories considered could apply for few sources only. I neglected the effects of the the Ozone layer and the volcanic powder studied by Garstang (1991). This kind of model has been already widely tested by Garstang (see ref. above). I successfully tested my set of models in Italy comparing the predicted sky luminance distribution in some italian sites with measurements. Results of tests were reported elsewhere (Cinzano 1999). In next section I will also compare the obtained with the model for a test site and that obtained with the Treanor Law.
4 Comparison tests.
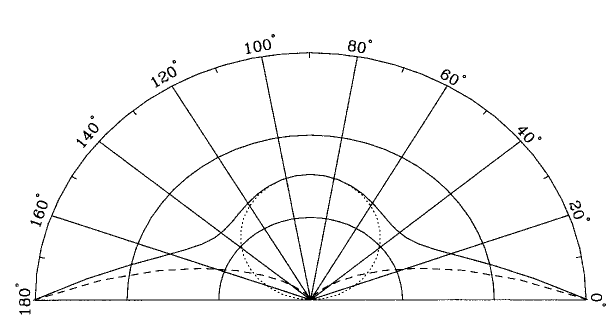
I compared the expression (4) with the normalized curve obtained for the Astronomical Observatory of Ekar with the models described above (see sec. 4.1). The surrounding territory of the Veneto plain is in fact studded with many cities and small towns in nearly continuous way.

The results are presented in figure 1. The solid curve is the model prediction and the dashed curve is the best fit of expression (4). The Walker Law () (dotted curve) and the Law (dot-dashed curve) were also plotted. I obtained a good agreement for , km and =0.06. This value of the Core radius corresponds roughly to the distance of the Observatory from the surrounding plain. The choice of the parameter does not influence strongly the results because its effect is non negligible only for and the contribution of the zones inside this distance is rather small compared with contributions coming from greater distances.
I also compared the normalized curve predicted for Mount Ekar Astronomical Observatory with the curve obtained calculating the contribution one by one of all the sources of the surrounding territory with the Treanor law (1973):
| (6) |
where A,B,k, , are constant and X is the distance of the site from the source. The Treanor law refers to a simple model with homogenous atmosphere, the heights of scattering particles are small respect the distance between the site and the source, and the scattering is assumed to be limited to a cone of small angle around the direction of the incident light. These hypotheses are justified in first approximation from the limited scale height of atmospheric particles and from the characteristics of forward scattering of the aerosols. The model neglects the scattering of higher order than the second. The Treanor law, even if based on a simple model, fitted well the measurements carried out by Bertiau et al (1973) in Italy. The term give the contribution to the illuminance of the atmospheric particles along the vertical column at the site produced by light coming directly from the source, the term gives the contribution of the light scattered once, the term takes into account the extinction of the light along its way. In applying this law I considered still valid the calibration of the ratio B/A and the coefficient k from Bertiau et al (1973) in B band because these depend only on the mean conditions of the atmosphere in clear nights which I supposed unchanged from 1973, neglecting the seasonal variations and the effects of the changes in atmospheric pollution.

The effect of the altitude H of the observatory is to cut all the light that in a site on the sea level would come from particles situated along the vertical at a lower height than the altitude H of the site. In a rough approximation, the luminance is overestimated for a fraction given by the ratio between the number of scattering in the vertical column over the site in the case of altitude H and in the case of altitude zero.
| (7) |
where , , and are respectively the number of particles of aerosol and molecules at the altitude h and their angular scattering cross sections. With the expressions and the parameters in Garstang (1986) I estimate that the effect of the altitude diminishes the values of approximately 20% for the observatory. However, all the contributions are affected in the same way from the minor number of atmospheric particles, so that, in first approximation, relative contributions do not need any correction.
Figure 2 shows the results of the computations of with Treanor Law (squares) and the model predictions in B band (solid curve) and in V band (dashed curve). Differences between the curves in V and B bands are likely to be of the same order as differences produced by fluctuations in atmospheric conditions. Measurements of Walker (1977, table II, col (2))in V and B bands at Salinas are almost indistinguishable from 10 km to 30km. The Treanor Law (valid for B band) and the Walker Law (obtained for V band) were found in fairly good agreement (Walker 1977). The differences on the propagation of light pollution in B band and in V band are shown in Cinzano & Stagni (1999).
The average upward emission function of cities was never studied so far in Italy or elsewhere. Garstang in all his papers cited here used successfully a semi-empirical function:
| (8) |
where is a calibration constant unimportant in the normalized computation of this paper and is in lm/sr. This function was implicitly tested by Garstang with many comparison between model predictions and measurements. I compared the curve obtained with three different average upward emission functions . The first, shown in figure 3, was the previous eq. 8, with G=0.15 and F=0.15. Note that G and F must be considered here only shape parameters without the meaning given by Garstang (1986) of, respectively, direct and reflected light ratios because emission at low angles above the horizon can come both from direct emission by luminaires and from reflection by lighted surfaces (horizontal and vertical) and emission near the zenith can come both from reflexion by surfaces and from direct emission by unshielded luminaires. The second function, shown in figure 4, was the sum of a constant intensity and a power law:
| (9) |
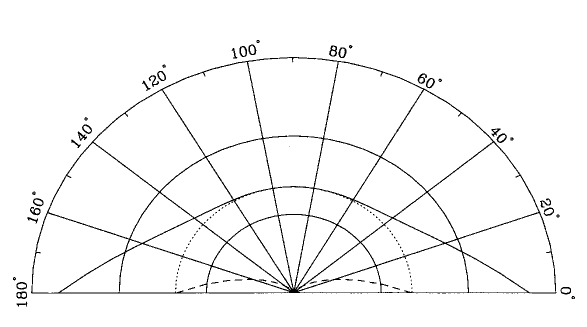
with G=0.3 and F=0.075. This function assumes an higher emission at intermediate angles in respect to the function 8. As third function I used a constant intensity . In figure 5 I plotted the curve obtained with the function (8) (solid curve), the function (9) (dotted curve), and the constant intensity (dashed curve). Differences in shape are little even for the case of constant intensity.


The propagation of light pollution depends on atmospheric clarity, i.e. on the aerosol content of the atmosphere, which in the models is expressed by a clarity parameter K (Garstang 1986, 1987, 1988, 1989a, 1989b, 1989c, 1991a, 1991b, 1991c, 1992, 1993, 1999). In computing curve I assumed typical clean air at sea level, i.e. K=1 as defined by Garstang (1986). A clarity K=0.5 would correspond to very clean air. So results in this paper refers to clean atmosphere not to mean atmospheric conditions at the studied sites, which are difficult to define. In figure 6 I compared the curve obtained for Mount Ekar Observatory for K=1 (solid curve), K=0.5 (dotted curve) and K=2 (dashed curve). An increase in aerosol content produces a steeper decrease of for increasing d. This is due at the increase of scattering which produces a stronger extinction. This was already shown by Garstang (1986) for the city of Denver, where on increasing K the artificial luminance contribution decreases outside the city while increases inside the city. A comparison between curves of figure 6 and figure 2 shows that the model for K=2 does not agree with the curve obtained with the Treanor Law as calibrated with measurement in Italy (Bertiau et al. 1973). So atmospheric conditions at which Treanor Law was calibrated seems to correspond to an aerosol content . In table 2 I will show for each Observatory the vertical extinction in V and B band predicted by the model (Garstang 1991) for K=1 and K=2. The horizontal daylight visibility, defined as the distance at which black object would show a luminance (due to scattered light between the observer and the object) of 0.98 of the luminance of horizon behind the object, computed as Garstang (1991), is km for , km for and km for at sea level.
4.1 Results
I computed with the detailed modelling described in section 3 for the Italian Observatories listed in table 1. Table 1 shows for each Observatory the adopted geographical position and altitude above the sea level.
Tab. 1 - Adopted geographic positions of Observatories
| Observatory | Longitude | Latitude | Height |
|---|---|---|---|
| ∘ ′ ′′ | ∘ ′ ′′ | m.s.l. | |
| Mount Ekar Obs. (Asiago) | 11 34 18 | 45 50 36 | 1350 |
| Bologna Univ. Obs. (Loiano) | 11 20 0 | 44 15 23 | 714 |
| Brera-Milan Ast. Obs. (Merate) | 9 25 42 | 45 41 58 | 330 |
| Catania Obs. Stellar Sta. (Serra La Nave) | 14 58 24 | 37 41 30 | 1735 |
| Collurania Ast. Obs. (Teramo) | 13 44 0 | 42 39 30 | 388 |
| Chaonis Obs. (Chions) | 12 42 42 | 45 50 36 | 15 |
| “G. Ruggieri” Obs. (Padova) | 11 53 20 | 45 25 10 | 20 |
| S. Benedetto Po Ast. Obs. (S.Benedetto Po) | 10 55 10 | 45 3 4 | 1. |
As already discussed, results were obtained for conditions of clean atmosphere (i.e. assuming for the Garstang (1989) clarity parameter ). Table 2 shows for each Observatory the vertical extinction in V and B band predicted by the model (Garstang 1991)for K=1 and K=2.
The curves in figures are normalized to the total artificial sky luminance at the zenith of the site. They are computed for light in the photometric band of eye sensitivity and they can be considered also valid for light in the astronomical V band. The curves are computed every 4 km and linearly interpolated in the plots. A better space resolution would be sometime confusing because the city position data do not give the exact position of light baricenter but only the position of a geographic reference point in the center of the city.

Tab. 2 - Vertical extinction predicted by the models
| Observatory | K=1 | K=2 | ||
|---|---|---|---|---|
| Mount Ekar Obs. (Asiago) | 0.19 | 0.36 | 0.24 | 0.43 |
| Bologna Univ. Obs. (Loiano) | 0.24 | 0.43 | 0.34 | 0.56 |
| Brera-Milan Ast. Obs. (Merate) | 0.28 | 0.50 | 0.42 | 0.66 |
| Catania Obs. Stellar Sta. (Serra La Nave) | 0.16 | 0.32 | 0.20 | 0.38 |
| Collurania Ast. Obs. (Teramo) | 0.28 | 0.48 | 0.40 | 0.64 |
| Chaonis Obs. (Chions) | 0.33 | 0.56 | 0.50 | 0.78 |
| “G. Ruggieri” Obs. (Padova) | 0.33 | 0.56 | 0.50 | 0.78 |
| S. Benedetto Po Ast. Obs. (S.Benedetto Po) | 0.33 | 0.56 | 0.51 | 0.78 |
Figure 7 shows the curve for the Mount Ekar Observatory. The artificial sky luminance at the zenith of this Observatory in clear nights is produced mainly by the light dispersed from sources situated in the Veneto plain. Approximately 50% of the artificial sky luminance at Ekar is produced within 30 km from the observatory and 75% within 50 km. As already shown in figure 1 the shape of is exactly that expected for a uniformly populated territory, except for a core in the inner 10 km produced by the lower population density in the mountain. The figure 8 shows the derivative . Main peaks correspond to the main sources like Asiago ( at ), Bassano, Thiene and Schio (from to ), Vicenza (at ), Treviso (at ), Padova (at ). The continuum is produced by the other cities. I counted 1350 cities inside


100km from the site.
Figure 9 shows the curve for Bologna University Observatory at Loiano. Readers can note the absence of the core due to the presence of the Loiano town near the Observatory and the strong bump at about 25 km produced by the big city of Bologna. Approximately 50% of the artificial sky luminance at Loiano Observatory in clean nights is produced within 30 km from the observatory and 75% within 50 km.
It is interesting to compare the curve of Catania Observatory Stellar Station at Serra La Nave in figure 10, Brera-Milano Astronomical Observatory at Merate in figure 11 and Collurania Observatory at Teramo in figure 13. Catania Observatory shows a large core due to the inhabitated Etna mountain and a rapid decrease between to produced by the fact that the city of Catania and its neighbour towns are the main contributors to the sky luminance at the site. Approximately 50% of the artificial sky luminance at Serra is produced within 30 km from the observatory and 75% within 50 km. The contribution from higher distances is little due to the presence of the sea and to the absence of many other cities. Inside a radius of 120 km there are only 362 cities.

Brera-Milan Astronomical Observatory at Merate, on the contrary, do not show a core but a high peak because the observatory is almost surrounded from the city of Merate. The big number of cities in the land (2171 cities inside a circle of 120 km of radius around the site) produces the well prominent wing outside . The diffuse population distribution produces a curve well fitted by the extended law (eq. 4) as shown in figure 12 (, km and =0.12). The discontinuity at about 30 km in figure 11 is produced from the contribution of the city of Milano.


A similar behaviour of curve appear for the Collurania Observatory at Teramo where the contribution from the near city appears to overhang the contribution of the surrounding territory.


I also computed the curve for three amateur observatories. Chaonis Observatory in figure 14 shows a core of 5 km and a wing produced by the sources in the country, while the San Benedetto Po Observatory in figure 15 shows a wing but the core is replaced by a peak probably produced by the town in the nearby of the observatory. The bump at is produced by the city of Mantova. A little bump at is likely to be produced by the sum of the cities of Modena, Reggio Emilia and Verona.

The G. Ruggieri Observatory in figure 16 is inside the city of Padova. The curve shows the overhelming contribution coming inside the first 4 km. It is interesting to note that the wing produced by the other cities of the Veneto plain is quite well fitted by the law (, km and =0.045) as shown in figure 17.


5 Conclusions
The knowledge of the artificial sky luminance produced in a given point of the sky of a site from the sources situated at a distance greater than from the site is important in order to understand the behaviour of light pollution in diffusely urbanized areas and it is useful in order to estimate which fraction of the artificial luminance would be regulated by norms or laws limiting the light wasted upward within protection areas of given radii.
I studied the behaviour of applying a model for the propagation of the light pollution based on the modelling technique introduced by Garstang (1986, 1987, 1988, 1989a, 1989b, 1989c, 1991a, 1991b, 1991c, 1992, 1993, 1999) which allows us to calculate the artificial luminance in a given position on the sky of a site of given altitude on the sea level, produced by a source of given emission and geographic position. I obtained integrating the contribution to the artificial luminance of all the sources situated at a distance greater than .
Main results are:
-
1.
Artificial sky luminance in a site in a diffusely urbanised territory produced by sources located at large distances from the site is not negligible due at the addittive character of light pollution and its propagation at large distances.
-
2.
The contribution to the artificial sky luminance produced in given point of the sky of a site by the sources situated at a distance greater than a given distance from the site decrease as i.e. much slower than the contribution of a single source which goes as .
-
3.
With inclusion of a core, the expression (4) well express the behaviour of from 0 km to about 100 km.
-
4.
The radii of protection zones around Observatories needs to be large in order that prescriptions limiting upward light be really effective.
-
5.
Only when the core radius is small, e.g. for Observatories located near a city, the sky luminance contribution from sources inside a small protection zone tends to be predominant.
In the Web Site Light Pollution in Italy, actually at the address www.pd.astro.it/cinzano/ is presented a simple didactic Java Applet called LPCALC which allows to calculate from the geographic position of a site. It works only for sites in Italy.
Acknowledgements
I am indebted to Roy Garstang of JILA-University of Colorado for his friendly kindness in reading and refereeing this paper, for his helpful suggestions and for interesting discussions.
References
- 1 Abramowitz M., Stegun I.A. 1964, Handbook of Mathematical Functions, Washington, NBS.
- 2 Berry, R. 1976, J. Royal Astron. Soc. Canada, 70, 97-115.
- 3 Bertiau, F.C.S.J., de Graeve, E.S.J. & Treanor, P.J.S.J. 1973, Vatican Observatory Publ., 1, 4, 159-179.
- 4 Cinzano, P. 1997, Inquinamento luminoso e protezione del cielo notturno (in italian) (Venezia: Istituto Veneto di Scienze, Lettere ed Arti), 224 pp.
- 5 Falchi, F. & Cinzano, P. 1999, in this volume.
- 6 Cinzano, P. 1999, in this volume.
- 7 Cinzano, P. & Stagni, R. 1999, in this volume.
- 8 Garstang, R.H. 1984, The Observatory, 104, 196-197.
- 9 Garstang, R.H. 1986, Publ. Astron. Soc. Pacific, 98, 364-375.
- 10 Garstang, R.H. 1987, in Identification, optimization and protection of optical observatory sites, eds. R.L. Millis, O.G. Franz, H.D. Ables & C.C. Dahn (Flagstaff: Lowell Observatory), p. 199-202.
- 11 Garstang, R.H. 1988, The Observatory, 108, 159-161.
- 12 Garstang, R.H. 1989a, Publ. Astron. Soc. Pacific, 101, 306-329.
- 13 Garstang, R.H. 1989b, Ann. Rev. Astron. Astrophys., 27, 19-40.
- 14 Garstang, R.H. 1989c, Bull. of American Astron. Soc., 21, 2, 759-760.
- 15 Garstang, R.H. 1991a, in Light Pollution, Radio Interference and Space Debris, IAU Coll. 112, ed. D.L. Crawford, Astron. Soc. of Pacific Conf. Series 17, p. 56-69.
- 16 Garstang, R.H. 1991b, Publ. Astron. Soc. Pacific, 103, 1109-1116.
- 17 Garstang, R.H. 1991c, The Observatory, 111, 239-243.
- 18 Garstang, R.H. 1992, Bull. of American Astron. Soc., 24, 740.
- 19 Garstang, R.H. 1993, Bull. of American Astron. Soc., 25, 1306.
- 20 Garstang, R.H. 1999, in this volume.
- 21 McClatchey, R.A., Fenn, R.W., Selby, J.E.A., Volz, F.E., Garing, J.S. 1978, Handbook of Optics, ed. W.G. Driscoll and W. Vaughan, McGraw-Hill, New York.
- 22 Pike, R. 1976, J. Royal Astron. Soc. Canada, 70, 116-126.
- 23 Treanor, P.J.S.J. 1973, The Observatory, 93, 117-120.
- 24 Walker, M.F. 1970, The California Site Survey, Publ. Astron. Soc. Pacific, 82, 672-698.
- 25 Walker, M.F. 1973, Light pollution in California and Arizona ,Publ. Astron. Soc. Pacific, 85, 508-519.
- 26 Walker, M.F. 1977, PASP, 89, 405-409.
- 27 Walker, M.F. 1988, Publ. Astron. Soc. Pacific, 100, 496.
- 28 Yocke, M.A., Hogo, H. & Henderson, D. 1986, Publ. Astron. Soc. Pacific, 98, 889-893.
- 29