Abstract
Using archival ASCA and ROSAT observations of RE 0751+14, X-ray energy spectra, pulse profiles and the results of pulse timing analysis are presented. The energy spectra are well-fitted by a blackbody model at low energy and a Raymond-Smith model at high energy, together with a partial covering absorber. A fluorescence emission line at 6.4 keV with an equivalent width eV was resolved for the first time.
Key words: binaries: close — stars: individual (RE 0751+14) — stars: cataclysmic variables — X-rays: stars
Section 1 Introduction
The intermediate polar (IP) RE 0751+14 (PQ Gem) was discovered with the Wide Field Camera of the ROSAT satellite (Mason et al., 1992). The detection of coherent 13.9 minute (or 833 sec) oscillations in the infrared and optical wavelengths are verified by hard X-ray observations of Ginga satellite. By using the optical spectroscopy and photometry Rosen et al. (1993) suggested that the 14.5 minute modulation in the B band was the beat of the spin period at 13.9 minute with an orbital period of 5.2 hr. In close asynchronously rotating binary systems (), a magnetic white dwarf accretes material from a low mass companion through Roche lobe overflow, possibly with an accretion disk (Patterson 1994). Ginga observations (Duck et al., 1994) showed periodic narrow dips at 13.9 minutes which are modulated in the energy range of 2-6 keV, however the dip phenomena cease at higher energies. This suggests that the absorbing accretion column moves in and out of the line of sight of the observer at the rotation period of the white dwarf. Subsequent ROSAT observations have verified the dip modulations (Duck et al., 1994). These observations have found a soft X-ray component in the light curve of RE 0751+14. The recent ROSAT observations also showed distinct soft X-ray components in other magnetic polars (Haberl Motch 1995).
In the IPs the inner disk is perturbed by the strong magnetic field (G) of the white dwarf at a distance close to the magnetospheric radius. The plasma flows along the field lines and accretes onto the white dwarf near the magnetic pole/s in the form of a thin accretion curtain (Singh and Swank 1993). A cross section of the accreting column appears to be in the form of a thin semicircular arc. Modulation of the X-ray emission can result from variation of the photoelectric absorption of the shocked plasma along the line of the sight (Rosen et al., 1988) or the occultation of the emission region (King and Shaviv 1984) due to the rotation of the white dwarf. Recent analysis of pulse phase spectra of RE 01751+14 have shown that both models are applicable to RE 0751+14 (Duck et al., 1994).
The pulse arrival times of ROSAT and ASCA observatons together with previous X-Ray and Optical band measurements have shown that the RE 0751+14 is spining down with rate of s/s (Mason 1997). In this work, therefore we concentrate on the spectral analyses of this source and we examined the unpublished archival ROSAT and ASCA data bases of RE 0751+14 in combination. These observations have longer effective exposure times than that of previous ROSAT and GINGA observations and have better energy resolution in energy ranges between 0.5-10 keV. We reexamine the pulse phase spectra, energy dependent pulses. In the analysis, we noted, for the first time, an emission line at 6.4 keV in the energy spectrum. The power spectrum of the intensity time series at low energies (below 0.5 keV) showed red noise which may be an indicator of blob accretion proposed for AM Herculis systems (Litchfield and King 1990).
Section 2 Observations
RE 0751+14 was observed with ROSAT/PSPC and ASCA/SIS and GIS detectors. The PSPC X-ray observations reported here were obtained between JD 2449265.70672 and 2449267.11526 with a total effective exposure time of 25874 s over a time span of 121186 s, whereas ASCA observations took place between JD 2449660.92359 and JD 2449663.09701 with a mean effective exposure time of 35033 s over a time span of 187769 s.
The ROSAT/PSPC is a gas filled proportional counter sensitive over the energy range 0.1-2.4 keV with an energy resolution E/E0.43 at 0.93 keV. Detailed descriptions of the satellite, X-ray mirrors, and detectors can be found in Trümper (1983) and Pfeffermann et al. (1986). The reduction of the ROSAT archival data has been performed with the EXSAS package (Zimmermann et al.1993). RE 0751+14 source counts were extracted from a circle of radius which is expected to include of the photons from the source, according to the point spread function of the PSPC. The background was determined from a source free area of radius . The mean background subtracted, vignetting and deadtime corrected count rate for the whole observation was counts sec-1.
The ASCA instrumentation (Tanaka et al. 1994) consists of four imaging telescopes, each with a dedicated spectrometer. There are two solid-state imaging spectrometers (SIS), each consisting of 4 CCD chips, giving an energy resolution of 60-120 eV across the 0.4-10 keV band. Two gas scintillation proportional counter imaging spectrometers, GIS, have an energy resolution of 200-600 eV over the 0.8-10 keV band. Data were extracted within a arcmin radius region for each SIS and within a arcmin region for each GIS. The typical mean count rates for the SIS and GIS are counts sec-1 and counts sec-1, respectively. Standard cleaning for ASCA data was applied to eliminate X-ray contamination from the bright Earth, effects due to high particle background, and hot flickering SIS pixels. The reduction of the ASCA archival data was performed using XSPEC, XRONOS, XIMAGE and XSELECT softwares. In Table 1, we present a journal of the X-ray observations analysed in this work.
| Observation | Detector | JD start | JD end | Time span (sec) | Eff. expo. (sec) |
|---|---|---|---|---|---|
| ROSAT | PSPC | 2448714.01751 | 2448714.96113 | 81532 | 9143 |
| ROSAT | PSPC | 2449265.70672 | 2449267.11526 | 121186 | 25874 |
| ASCA | SIS, GIS | 2449661.42359 | 2449663.059701 | 187769 | 35033a |
a Mean exposure time, since ASCA observations were made in several observing modes.
Section 3 Results
3.1 Spectra
In this section, we will present a detailed spectral analysis of the X-ray data for RE 0751+14 from the observations by ROSAT and ASCA. The large number of photons obtained from both observations make it possible to test various spectral models as well as phase resolved analysis. ROSAT observations have an advantage for low energy (0.1-2.3 keV) behaviour of the source whereas ASCA detectors extend the energy range up to 10 keV (0.5-10 keV).
RE 0751+14 was detected strongly in the ROSAT/PSPC as a soft X-ray source; almost 80 of the total observed photons have energies below 0.5 keV. Single component models fail to represent the observed spectra. The two component models composed of blackbody plus power law emission and blackbody plus Raymond Smith fit the data well. Due to the low energy resolution of the PSPC, parameters of the blackbody model and hydrogen column density seems to be highly correlated. From these fits, we obtained a blackbody temperature kT=34.54.6 eV for soft X-ray component and neutral hydrogen column density N cm-2.
RE 0751+14 was detected in both SIS and GIS detectors of ASCA. SIS energy range starts from 0.4 keV, hence only a small fraction of the soft photons, expected from the source, contribute to the observed spectra. The energy ranges of SIS and GIS detectors extend up to 10 keV allowing us to test various models. The high energy resolution of SIS makes it possible to resolve several line features around keV. ASCA detectors alone however do not reveal the spectral behaviour of the source. Hence, although there is a long time difference between the observations, ROSAT and ASCA observations were combined. We assumed that the two data sets differ by a constant normalization factor. It should also be noted that our preliminary spectral fits showed that both observations have similar spectral parameters.
The combined ASCA and ROSAT data sets represent the data in a broader energy range. This allows us to experiment with the spectral data using more sophisticated models such as the partial covering absorber model (Norton and Watson 1989). The partial covering absorber model for RE 0751+14 first proposed by Duck et al. (1994). In this model, an uncovered fraction of the source can be seen through a interstellar column density and the covered remainder of the source, such that , can be seen through intrinsic and interstellar column density, . In the fits of combined data sets (a) blackbody plus power-law with a Gaussian line emission profile and (b) blackbody plus Raymond Smith model with partial covering absorber and a Gaussian line were tried (see the discussion section for plausibility of both models). The best fit to phase averaged PSPC and SIS data for case (a) gives the blackbody temperature kT= eV, power law index and absorption Ncm-2 with a . Case (b) gives similar values for the blackbody temperature and absorption. The plasma temperature for the Raymond Smith model gives high values of kT= keV. The plasma temperature deduced for RE 0751+14 from the observations of GINGA is keV (Ishida 1991, Duck et al., 1994). Since the response of the GINGA detectors extened to higher energies up to keV, we adopted the 20 keV plasma temperature for the pulse phase spectroscopy study. Table 2 summarizes the parameters of the fits.
| Model | NH1 | NH2 | Covering | |||
| (eV) | (keV) | (cm-2) | (cm-2) | Frac.(%) | ||
| BB+RSb | 34.54.6 | 10.74.9 | 13.82.6 | 1.04 | ||
| BB+RS+Lc,f | 38.48.5 | 20.0 | 11.44.9 | 4.90.3 | 0.560.08 | 1.33 |
| BB+RS+Ld | 38.0 | 40.911.3 | 11.62.3 | 6.40.5 | 0.470.02 | 0.99 |
| BB+RS+Le | 38.0 | 20.0 | 11.4 | 5.50.2 | 0.540.06 | 0.98 |
| NH1 | ||||||
| BB+PL+Lc | 38.91.1 | 0.870.01 | 11.40.6 | 1.4 |
aSpectral fits were performed using the program XSPEC. Abbreviations for BB(bb), RS(rs), PL(pl), L stand for Blackbody, Raymond-Smith, Power-law an
d
Gaussian line models respectively.
b,c,d,e are PSPC, PSPC+SIS, PSPC+GIS and PSPC+SIS+GIS detectors respectiv
ely.
fGaussian Line energy=(6.380.08) keV, Equivalent Width=(22080)
eV.
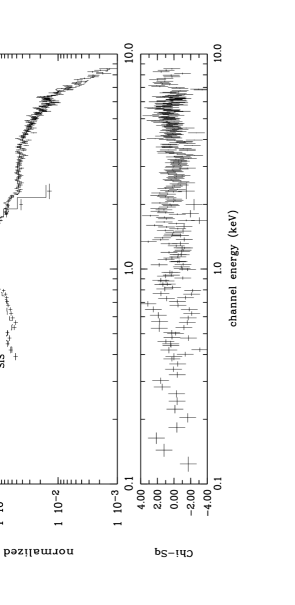
In Fig. 1 we present the data and the model for case (b). The inset shows the 6.4 keV fluorescence line feature of equivalent width eV. A covering fraction of and absorbing column density of N cm-2 are obtained from the phase averaged spectra with a . The combined data set consisting of PSPC, SIS and GIS detectors was also used to extend the high energy range and improve partial coverage parameters. A covering fraction of and absorbing column density of Ncm-2 is obtained with a .
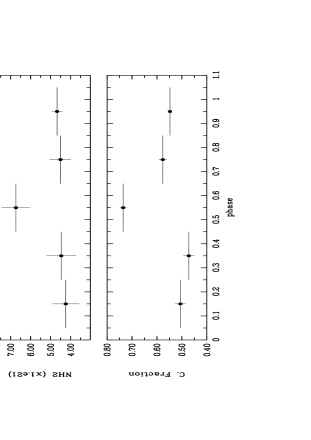
To see the spectral variation over pulse phase with suitable statistics, the pulse phase is divided into five phase intervals, one of which is centered on the dip observed. The blackbody temperature and the parameters for the line feature were kept constant with the values determined from the phase averaged spectra. Significant variation of partial coverage fraction and absorption column density around the dip is seen, as presented in Fig. 2. Table 3 summarizes the spectral parameters of the pulse phase spectra.
| Phase | NH1 | NH2 | Covering | flux | Radiusbb | flux | ||
|---|---|---|---|---|---|---|---|---|
| (eV) | (cm-2) | (cm-2) | Frac.(%) | (cm) | ||||
| 0.05-0.25 | 32.17.4 | 16.90.7 | 4.20.7 | 0.510.02 | 15.1 | 1.9 | 1 8.5 | 1.53 |
| 0.25-0.45 | 31.511.7 | 16.61.0 | 4.50.7 | 0.470.02 | 9.8 | 1.4 | 1 4.7 | 0.91 |
| 0.45-0.65 | 42.426.1 | 9.61.3 | 6.70.7 | 0.730.01 | 4.7 | 1.4 | 9 .6 | 0.92 |
| 0.65-0.81 | 47.120.9 | 8.41.0 | 4.50.5 | 0.570.02 | 3.6 | 1.2 | 7 .4 | 1.02 |
| 0.85-0.05 | 32.13.2 | 17.00.7 | 4.60.3 | 0.550.01 | 3.6 | 1.3 | 5 .4 | 1.06 |
aFluxes were calculated from the model spectra in units of ergs cm-2 s-1 in the energy range 0.1-10 keV.
The total PSPC (0.1-3 keV) flux varies in the range (3.9-15.6)ergs cm-2sec-1 with phase. The variation for SIS (0.25-12 keV) is (2.7-6.0)ergs cm-2sec-1. The flux for the Raymond Smith component of the partial coverage model is largest in the phase interval , which is the region where the dip is observed, and lowest in where the maximum blackbody flux is observed. Radius of the effective emitting area for the blackbody model from PSPC data is (1.2-1.9) cm for an assumed distance of 400 pc (Patterson 1994).
3.2 Pulse Profiles
General features of the light curves from both ROSAT and ASCA observations are quite similar having several dips and maxima on the count rate, superposed on 13.9 min sinusoidal modulation. A pronounced dip in the X-ray flux is seen at all energies, just before the rise to a maximum ( 50 degrees before). The depth and the width of the dips are energy-dependent (see Fig. 4).
To see the intensity fluctuations, and possible signatures of the orbital modulation, pulsations and pulse periods, various time series analysis methods are employed for ASCA and ROSAT observations of RE 0751+14.
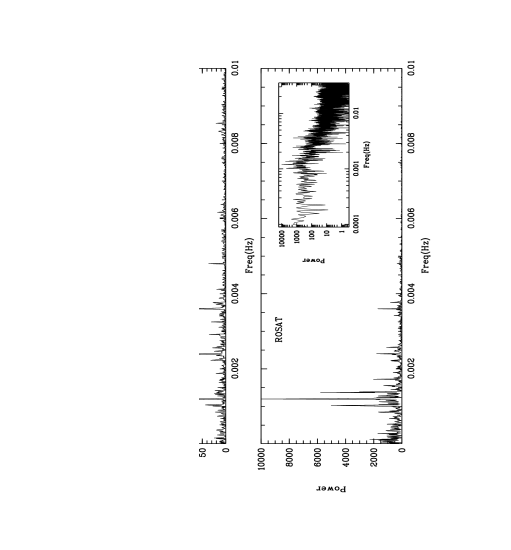
As a first step, the data bases are separated into two energy channels according to the soft and hard continuum emission components, then the discrete power spectra are calculated (Deeming 1975) for the low energy range (0.1-0.5 keV) of ROSAT/PSPC and the high energy range (0.5-10 keV) of ASCA as shown in Fig. 3a,b . In the power spectra, we have found only one significant period which is the previously identified spin period (13.9 min), with its first three harmonics. The power spectra have shown low frequency noise in the low energy range. This behaviour is not observed in the power spectrum for the high energy range. In order to see whether or not the low frequency noise is the part of the wobbling of ROSAT/PSPC detectors, the power spectrum of ROSAT observations in the range of 0.5-2.4 keV are obtained and it is seen that the power in the low frequencies significanty decreased.
For the estimation of pulse periods, the time histories are folded by a number of statistically independent trial periods (Leahy et al., 1983). Then the pulse profile giving the maximum is chosen as the master pulse for each ROSAT or ASCA observation. In order to accurately determine the pulse period, a set of pulse arrival times was generated by estimating the maximum value of cross correlation between the master pulse and averaged sample pulses.
In the pulse timing analysis the pulse profiles appear to be variable. In order to control the variability of the pulse profiles we have used the method of pulse wave filtering as proposed by Deeter and Boynton (1985). In this method pulse profiles are expressed in terms of harmonic series and cross correlated with the average pulse profile (master pulse). The maximum value of the cross-correlation (or pulse arrival times) is analytically well-defined and does not depend on the size of the phase bins of the pulses. Short term sharp fluctuations of pulses are naturally filtered by a cut off of higher harmonics. The pulse periods and their errors are estimated from the slopes and uncertainties of pulse arrival times. The pulse period history of RE 0751+14 is summarized in Table 4.
| Observation | JD(2440000+) | Period (sec) |
|---|---|---|
| GINGA | 8362.486 | 833.3950.01a |
| ROSAT-1 | 8714.018 | 833.330.09b |
| ROSAT-2 | 9265.713 | 833.520.08 |
| ASCA | 9661.424 | 833.330.10 |
a Duck et al., 1994. Based on long data set 19 days apart.
b Duck et al., 1994 and this work.
(Note that as an alternative method, we employed the test (Buccheri et al., 1983) and verified the above results).
3.3 Energy Dependence of Pulse Profiles
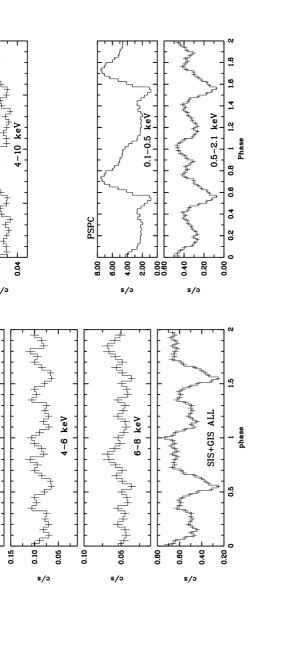
In order to see the intensity variations more clearly, 13.9 min pulse profiles are generated by folding the light curves in various energy ranges. In the ROSAT observations, more than of the photons are detected below 0.5 keV. Therefore PSPC data is naturally separated into two energy windows, namely ’soft’ band (0.1-0.5 keV) and ’hard’ band (0.5-2.1 keV). For the ASCA observations, the SIS data is divided into four energy bands (0.5-2, 2-4, 4-6, 6-8 keV), and the GIS data three energy bands, (0.5-2, 2-4, 4-10 keV). In Fig. 4, we present PSPC, SIS and GIS energy dependent pulse phases together with the combined SIS and GIS photons in all energies.
A highly complex pulse shape with a general double peaked structure is evident in all three detectors. However, in the 0.1-0.5 keV range a single peaked structure with fast rise and slow decay is more likely. At energies above 6 keV, again a single peak around phases is evident. The absorption dip around is clearly seen in PSPC 0.1-0.5 keV band (Note that the dip epoch was chosen as in a previous paper by Duck et al., (1994)). A strong indication of the dip can also be seen in 0.5-2 keV bands of PSPC, SIS and GIS. The dip disappears as the energy increases to higher values. There is an enhancement around phase in low energy band of the PSPC. As the energy goes above 4 keV, the structure in the phase interval disappears but the structures around survives. High pulse fraction at low energies also decreases as the energy increases.
Section 4 Discussion
4.1 Spectra
The energy spectra is well-fitted to blackbody model at low energies and Raymond Smith model at high energies with a partial covering absorption model. In this model the source is heavily occulted in same phases of the 13.9 min period by the absorption of inhomogenous accreting plasma intrinsic to the source (Norton and Watson 1989). In general, it is expected that thermal bremsstrahlung (or Raymond Smith) is the model that fits best to the cooling shock regions around magnetic white dwarfs (Patterson 1994), however it is possible to observe power-law continuum emission if inverse comptonization is the dominant effect. If the spectra have two or more continuum components and observing energy windows do not extend to the higher energies, the overall trend of the spectrum can be approximated by a power-law model.
In the case of RE 0751+14, the presence of absorption features at lower energies is clear from the dips of pulse profiles (Fig. 4). As the white dwarf rotates the accreting column occults the source periodically. This causes the absorption at lower energies, while the high energy photons escape through the accreting column. The possible confirmation of this feature is to see significant increase in the photoelectric absorption during the dips of the pulses. Indeed, in the fits with the partial covering absorption model, one of the absorbers with a value of cm-2 showed a significiant increase during the dips of the pulses (see Table 3 , Fig. 2). By contrast, the single absorber models gave insignificant changes in the photoelectric absorption during dips. It is also very interesting to note that the equivalent width eV of the fluoresence emission line at 6.4 keV and the observed column density in the partial covering model are consistent with empirical relations obtained between the equivalent widths and column densities in several accretion powered X-ray binaries (Inoue 1985). This empirical correlation suggests that the observed fluoresence emission line requires high column densites and supports the partial covering model which can provide the high column density.
Another interesting feature is the low frequency noise (or red noise) in the soft X-ray emission (see Fig. 3a), namely blackbody component of the X-ray radiation. For an assumed 400 pc source distance (Patterson 1994) effective area for the blackbody model from PSPC data is only of the surface area of typical white dwarf. This area is comparable with polar cap regions. Low frequency noise suggests the presence of blobs or clumps in accretion. Our observation that low frequency noise is present only in the soft energy channels, which we associate with blackbody emission from near the star’s surface, then implies that such blobs are formed in the accretion column near the polar caps. The small cap area would promote shocks and instabilities to lead to clump formation. The blackbody radiation near the surface of the white dwarf is then not smooth, following the clumpiness of the accretion. This leads to low frequency noise in the X-ray power spectra. On the other hand thermally cooling plasma at the shock regions radiates as optically thin plasma at higher photon energies and the high density plasma cause the fluoresence emission line at 6.4 keV.
Section 5 Conclusion
In this work, we have presented archival ROSAT and ASCA observations of interpolar RE 0751+14. We resolve a fluorescence line at 6.4 keV with an equivalent width eV for the first time in this source. The pulse phase spectra of this source showed a significant increase in the absorption at the dips of pulse phase. The phase resolved spectra can be fitted with a single absorber blackbody plus power law model or by a partial covering model with a blackbody plus Raymond-Smith. Our findings for low frequency noise at low energies and the correlation of the line width with column density find a natural explanation in a two component model with partial covering, which we therefore favour. In the power spectrum analysis, we have seen a red noise component at low energy channels. By combining the previously found (and verified in this work) soft spectral component (Duck et al., 1994) together with red noise at low frequencies we concluded that the blob accretion to polar caps of the white dwarf is quite possible (Litchfield and King 1990). A separate component which is associated with the post-shock flow near the surface, emits hard X-rays rather smoothly, hence, power specral analysis does not show a low frequency noise at high energy channels. Therefore, our findings strongly suggest that there is an evidence of cold matter surrounding the plasma with cm-2.
Section 6 Acknowledgements
We thank Dr. Ali Alpar and Dr. Akif Esendemir, for valuable discussions. This work is supported by the Scientific and Technical Research Councli of Turkey, TÜBITAK, under High Energy Astrophysics Unit.
References
- Buccheri R et al., 1983, Astron. and Astrophys. 128, 245
- Chanmugam G., Frank J., King A.R., Lasota J.P., 1990, ApJ., 350, L13
- Deeter, J.E., Boynton, P.E., 1985, Proc. Inuyama workshop on Timing Analysis of X-Ray Sources, eds. S. Hayakawa and F. Nagase
- Duck S.R., Rosen S.R., Ponman T.J., Norton A.J., Watson M.G., Mason K.O., MNRAS, 1994, 271, 372
- Deeming T.J., 1975, Astron. Space Science, 36, 137
- Ghosh P., Lamb F.K., 1978a, ApJ., 232, 259
- Ghosh P., Lamb F.K., 1978b, ApJ., 223, L83
- Haberl,F., Motch,C., 1995, Astron. and Astrophys. v.297, p.L37
- Inoue H., 1985, Space Science Reviews, 40, 317
- Ishida M., 1991, PhD thesis, Univ. Tokyo
- Mason K.O., et al., 1992, MNRAS, 247, 749
- Mason K.O., 1997, MNRAS, 285, 493
- King A.R., Shaviv G., 1984, MNRAS, 211, 833
- Leahy D.A., Darbo W., Elsner., et al., 1983, ApJ., 266, 16
- Litchfield S.J., King A.R., 1990, MNRAS, 247, 200
- Norton A. J., Watson M.G., 1989, MNRAS, 237, 853
- Patterson J., 1994, PASP, 106, 209
- Pfefferman E., et al., 1986, SPIE, 733, 519
- Ramsay G., Mason K.O., Cropper M., Watson M.G., Clayton K.L., 1994, MNRAS, 270, 692
- Rosen S.R., Mason K.O., Cordova F.A., 1988, MNRAS, 231, 549
- Rosen S.R., Mittaz J.P.D., Hakala P.J., 1993, MNRAS, 264, 171
- Singh J., Swank J., 1993, MNRAS, 262, 1000
- Tanaka Y., Inoue H., Holt S.S., 1994, PASJ 46, L37
- Trümper J., 1983, Adv.Spa.Res., 2, 241
- Vath H., Chanmugan G., Frank J., 1996 ApJ., 457, 407
- Zimmermann H.U., et al., 1993, MPE report 244