Abstract
The contribution of an astrophysics group based in Milan to the science with the IUE satellite during its almost 20 years lifetime has focussed on high energy sources, of both galactic (LMXRB, HMXRB, and black hole candidates) and extragalactic (AGN) nature. The results of this long term research and in particular of the latest multiwavelength campaigns conducted simultaneously with IUE are reviewed here.
1 Introduction
IUE was launched in 1978 and has been working for almost two decades. Its achievements are fully recognized by the astrophysical community. The impact of IUE observations affected all areas of astronomy from stars to normal galaxies to Active Galactic Nuclei (AGN) producing many hundreds of scientific papers and a huge number of Conferences and Workshops.
Here we want to describe the major scientific achievements obtained by our group through IUE observations of “compact objects” in our galaxy and beyond, and at the same time we wish to stress the importance of IUE in the growth and scientific development of Astrophysics in the Milan area.
In the late sixties and early seventies the astrophysics group in Milan was led by Beppo Occhialini and Connie Dilworth. The main interest was in cosmic rays, specifically in cosmic-ray electrons, but involvement in -ray astronomy had also started. Optical and IR astronomy were cultivated by Enrico Tanzi and Oberto Citterio with the development and use of IR photometers at small telescopes. Massimo Tarenghi supported Connie Dilworth in conceiving the TIRGO project but soon moved to Arizona to work with some of the best optical telescopes available at that time. Theoretical activity had been started by Cesare Perola, who was interested in radio sources and AGN, while Laura Maraschi and Aldo Treves were working on accretion theory with applications to X-ray binaries and later to AGN. It was clear that X-ray emission alone was often insufficient to constrain the physical conditions of these systems and that, in addition, the high flux variability suggested the interesting possibility of studying the correlation of the X-ray with the optical and UV emission.
1.1 Why did we start an observational program with IUE?
The IUE observatory, with its generous opportunities for guest observers and output calibrated digital spectra that did not discourage even theoreticians, gave us the possibility of accessing first class data. At the same time it favored the coalescence of the group since the theoreticians needed expertise in classical astronomy and the ”astronomers” were interested in new theoretical motivations to develop long ranging programs. Moreover, it provided the opportunity for us all to collaborate with leading international groups. As a result, a strong, long lasting and productive team was established in the Milan area, which worked with pleasure and enthusiasm supported by common scientific interests and friendship. Enrico Tanzi was the leader and the heart of this team. He became later Deputy Chairman of the IUE Telescope Allocation Committee.
Originally two lines of research were started. One on AGN, concentrating on 3C 273 and NGC 4151, led in Milan by Cesare Perola, Enrico Tanzi and Massimo Tarenghi. This program was extremely successful, becoming an example of effective long term European collaboration, recall among other participants, J. Clavel, M. Penston, M.-H. Ulrich and W. Wamsteker. Later Perola moved to Rome and Tarenghi to ESO.
The second line, focusing on X-ray binaries and cataclysmic variables, was started by Tanzi and Treves, in collaboration with Pier Luigi Bernacca at Padova-Asiago. Also in this case international collaboration was sought. In particular, we interacted with the groups of Bob Wilson at UCL and Andrea Dupree at CFA, who were leading figures of the IUE project. Within the collaboration the first UV observations of the black hole candidate Cyg X-1 and of the magnetic cataclysmic variable AM Her were performed. They were the object of the thesis of Lucio Chiappetti, who joined permanently the Milan IUE team and became the key person in managing the local data analysis facilities.
With the second announcement of opportunity of IUE Laura Maraschi joined the group. Under the influence of the first results from the X-ray satellite ”Einstein”, besides extending the line of research on compact galactic objects, we began a program on AGN and in particular on BL Lac Objects, which from interpolation between the optical and X-ray fluxes were expected to be UV emitters. From the point of view of the accretion theory, the transition from X-ray binaries to AGN was a rather natural one. The program, which lasted for the entire duration of IUE, started with the first UV study of PKS 2155-304, one of the prototypes of X-ray bright BL Lac objects and one of the brightest AGN in the sky from the optical to the X-ray band. First results were published in Nature (Maraschi et al. 1980a), and led to a very fruitful collaboration with Meg Urry, who had similar interests in the US.
The IUE data were for us the first step to undertake programs of multiwavelength observations of our selected targets, aimed at the study of the broad band spectral flux distribution and variability thereof, which proved to yield significant constraints on the emission models. In particular, numerous coordinated observations were performed with EXOSAT in X-rays and with optical and IR facilities at ESO. Here the key persons were Enrico Tanzi, and Renato Falomo. On the systematics of IUE study of BL Lac objects important contributions came also from Gabriele Ghisellini and, more recently, from Elena Pian.
In the following we will describe some of the results obtained with the above programs. We divide the paper in three main parts: Section 2 deals with compact galactic sources; Section 3 focuses on the shape of the continuum of BL Lac objects and its variability from the IR to the UV band; Section 4 reports on the latest multiwavelength observations involving IUE for two prototypical blazars: PKS 2155-304 and 3C 279.
We just mention additionally that the first detection of low redshift intergalactic Ly absorptions was obtained by coadding a large number of IUE exposures of PKS 2155-304 (Maraschi et al. 1988).
2 Compact galactic objects
At the time of launch of IUE, X-ray binaries were one of the main themes of high energy astrophysics and possibly the main field of interest of X-ray astronomy. It was recognized that these systems were powered by accretion of a collapsed object. In most cases this was supposed to be a neutron star, the presence of which was apparent in X-ray pulsators. At that time, only one system was assumed to contain a black hole, namely Cyg X-1. The discovery of X-ray emission from AM Her demonstrated the affinity of cataclysmic variables, where accretion occurs onto a white dwarf, with standard X-ray binaries. The importance of a distinction of X-ray binaries in low and high mass systems (LMXRB, HMXRB), depending on the mass of the companion star, was starting to be recognized.
With this premise, it is no wonder that XRB were among the first targets of IUE, and some of them were observed within the performance verification phase of the satellite (Dupree et al. 1978). Immediately after, a collaborative effort among various groups was established to optimize the observations with IUE of Cyg X-1, Sco X-1, Vela X-1 and Her X-1. Later on, the systematic study of XRB and CVs was conducted by individual groups during the entire lifetime of the satellite.
In Milan, the effort was focussed on both CVs and XRBs. Among CVs we concentrated on ”magnetic CVs” polars, and intermediate polars, part of them observed simultaneously with EXOSAT (e.g., Tanzi et al. 1980, Chiappetti et al. 1989, Sambruna et al. 1992). Here we report briefly only on three XRBs, Cyg X-1 for which we led the international collaboration, and Cyg X-2 and LMC X-3 for which we produced the first IUE spectra.
2.1 Cyg X-1
The system is a prototype of HMXRB. The primary is an O supergiant, which dominates the optical UV emission. The O star produces a large wind, which is supposedly responsible for the mass transfer to the black hole. An accretion disk, if present, does not show up in optical/UV.
The main result of our IUE observations (Treves et al. 1980) was the discovery of the modulation of resonance lines with the 5.6 days orbital period. The absorptions were sinusoidally modulated with a minimum at the inferior conjunction of the X-ray source. The observation was a clear demonstration of the ionization of the stellar wind by the X-ray source for wind fed XRB. Indeed, this modulation was theoretically predicted by Hatchett and Mc Cray (1977), and was shown most clearly with IUE in the case of Vela X-1 by Dupree et al. (1980) and for Cyg X-1 by us.
2.2 Cyg X-2
This system is one of best known LMXRB with a period of 9.8d. The source is weak for IUE, but its detection was per se a demonstration of the existence of a UV source much stronger than the non collapsed star. The UV flux is most probably generated by the re-processing of X-rays in the accretion disk. In fact, this allowed us to estimate the geometrical thickness of the accretion disk, which turned out to be larger than expected, but consistent with that deduced from the absence of heating of the primary.
The line spectrum of Cyg X-2 is very complex, containing both emission and absorption lines, clearly indicating a superposition of emitting regions with different physical conditions. The prominence of the NV emission line over CIV is unusual, probably indicating an anomalously high abundance of nitrogen associated with the evolutionary history of the system (Maraschi et al. 1980b, Chiappetti et al. 1983).
2.3 LMC X-3
This is one of the three persistent X-ray sources known thus far, with firm evidence for the presence of a black hole. It was shown to be a black hole candidate by Cowley et al. (1983), who discovered the orbital period of 1.7 d and measured the mass function. Triggered by this work, we observed the source with EXOSAT and IUE (Treves et al. 1988a,b). Also this source is at the limit of IUE detectability. Still it was shown to be strongly variable. At the minimum the optical and UV emission was consistent with that expected from the primary star (BV). Subtracting the primary from the spectrum at maximum flux we found a spectral flux distribution, which could be fitted by a black body (see Fig. 1). This allowed us to establish a first rough inclination of the system.

3 Spectral Continua of AGN observed by IUE
The use of IUE in the study of AGN has been critical in that the UV spectral range, unlike the optical and IR, is modestly contaminated by stellar light of their host galaxies or by thermal emission from dust surrounding the nucleus. Moreover, the spectral energy distributions of AGN often present a local maximum close to the UV wavelengths, which makes the study of this energy band crucial for understanding the main energy output.
Our group has predominantly contributed to the investigation of radio-loud AGN using IUE, particularly blazars, and, to a lesser extent, of radio-quiet AGN like Seyfert galaxies and quasars. We just recall here the early investigations of UV and X-ray variability of MCG 8-11-11 (Treves et al. 1990), of PG 0026-129 (Treves et al. 1988c) and of 3C 120 (Maraschi et al. 1991) for which simultaneous IUE and EXOSAT observations were performed. In the case of Kaz 102 (Treves et al. 1995), a systematic IUE campaign was organized during the ROSAT All Sky Survey which monitored the source for several months. All these observations indicated the intricacy of the relation between the emission in the UV and X-ray band, and the need of very long exposures in the two bands to clarify such a relation.
Blazars include Highly Polarized and Optically Violently Variable Quasars (HPQ-OVV) as well as BL Lac objects, characterized by the absence of strong emission lines, by lower redshift and lower luminosity (Urry & Padovani 1995). Their common properties are the presence of a dominant radio core with flat radio spectrum, (, where ), strong radio and/or optical polarization ( 3%), and rapid variability at all frequencies. The radio to optical continuum is thought to be produced by synchrotron radiation of high energy particles in a relativistic jet, pointing at small angle to the line of sight. The observed radiation is then strongly ”amplified” by relativistic beaming. Indeed, some blazars present the highest apparent bolometric luminosities among all AGN.
3.1 Broad Band Spectra and Variability of Individual Sources
To precisely characterize the multiwavelength spectral shape of blazars, simultaneous observations are needed at the different wavelengths (i.e., less separated in time than the typical variability time scale at each wavelength). The flexibility of the IUE scheduling has allowed us to organize numerous observing campaigns of blazars at UV and other wavelengths (notably optical and X-ray) at single epochs, to measure and compare the fluxes and spectral slopes in different spectral ranges, and therefore reconstruct the overall energy distribution.
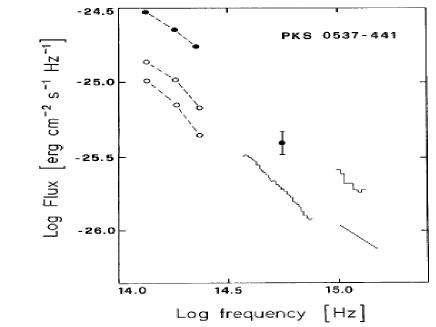
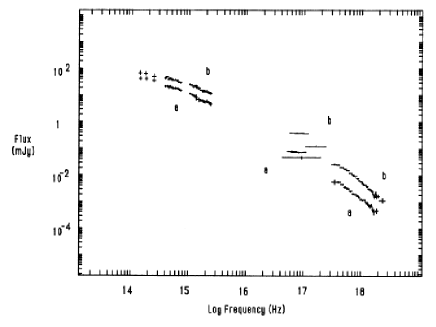
Examples of multiwavelength spectra obtained during different brightness states are given for PKS 0537–441 (Tanzi et al. 1986) and PKS 2155–304 (Treves et al. 1989). The former source () exhibited a brightening by a factor 2 in the whole range from near-IR tu UV whitout any significant change of slope (Fig. 2). Similar behaviour was seen in the BL Lac object PKS 2155–304 (), for which the spectral flux distribution was extended up to X-ray frequencies through EXOSAT observations (Fig. 3).
The simultaneous UV, optical and near-IR spectral flux distributions of 11 blazars selected for being the most strongly polarized among those of the complete samples of Impey & Tapia (1988), when properly corrected for Galactic reddening and decomposed from the stellar host galaxy contribution, are well described by a single power-law (Pian et al. 1994). This suggests that the radiative process which is responsible for the emission in the frequency range 8 - 2 Hz (synchrotron radiation) takes place inside a single emitting volume.
Among these sources, PKS 0521–365, PKS 2005–489 and PKS 2155–304 were detected in -rays by the EGRET instrument onboard the CGRO satellite. For PKS 0521–365, simultaneous UV and X-ray (EXOSAT) observations in November 1983, combined with radio, IR, optical and -ray data taken at different epochs, show that the spectral flux distribution declines from the IR to the UV range (energy index ), but hardens at higher frequencies (Pian et al. 1996).
The remarkably flat X-ray spectrum ( in the range 0.2–7 keV) and the detection of the source in -rays suggest a significant contribution by a mechanism other than synchrotron. Given the presence of high energy electrons and the high radiation density in these sources it is natural to invoke the inverse Compton mechanism to account for the hard X-ray emission.
The spectral energy distribution can be interpreted with a relativistic jet model in which the near-IR-to-UV radiation is produced via the synchrotron process in the internal part of the jet (close to the nucleus) and the radio emission comes from the external part (Ghisellini et al. 1985). Various arguments indicate that the jet in this source is not closely aligned with the line of sight (), implying that the observed radiation is only weakly boosted. A direct estimate of the importance of different sources of photons available for upscattering suggests that in this source the synchrotron photons are likely to be the seeds for the inverse Compton process.
PKS 0521–365 also exhibits a strong Ly emission line (Scarpa, Falomo, & Pian 1995) which does not vary significantly, in contrast with the remarkable variations of the UV continuum.
3.2 Comparative Studies
A comparative study of the spectral shapes of BL Lac objects in the UV yielded the first evidence of a systematic difference with respect to quasars and of a correlation of the UV spectral index with the broad band radio to X-ray index (Ghisellini et al. 1986). This result supported the non thermal nature of the UV emission from BL Lac objects, in contrast with the thermal origin of the UV bump in quasars (Bregman, Maraschi, & Urry 1987) .
The question was later reconsidered using the IUE archival spectra of 47 blazars and of a substantial fraction of Palomar Green bright quasars (Pian & Treves 1993).
The average spectral index in the range 1200–3000 Å was found to be 1, with HPQ being steeper (( 1.4) than radio-strong BL Lacs (defined by ), and these in turn being steeper ( 1.2) than radio-weak BL Lacs ( 0.7). Such distinction, which is also seen in the total luminosity, was originally proposed to be related to the jet viewing angle (Ghisellini & Maraschi 1989). More recently, a better knowledge of the overall radio to X-ray continuum led to suggest intrinsic physical differences (Sambruna, Maraschi, & Urry 1996).
The UV spectrum of HPQ and radio-strong BL Lacs differs significantly from that of PG quasars, for which the average spectral index is 0.8. The flatter UV spectrum of bright nearby quasars is probably due to the contribution of the thermal component (blue bump), which is less prominent (or absent) in blazars.
The UV variability of these blazars was studied by Treves & Girardi (1990), who found a correlation of UV variability with UV luminosity and a significantly larger variability at shorter UV wavelengths (1500Å) than at longer ones (2500 Å), in agreement with the overall variability-energy correlation seen in broad-band blazar spectra (Ulrich, Maraschi, & Urry 1997).
4 Blazar Multiwavelength Campaigns
It was clear after the results above that at least some blazars vary extremely rapidly in the UV and that quasi-simultaneous snapshots of the UV to X-ray energy distribution were insufficient to probe the correlation between the variability in two wavelength ranges. Simultaneous light curves in X-rays and UV and possibly other wavelengths were and are still needed to address physical models of variability. Despite the long lifetime of IUE well sampled multiwavelength data were obtained in a limited number of cases (see for reviews Wagner & Witzel 1995; Ulrich et al. 1997). Here we will discuss two sources for which many data have been obtained which helped us to make progress in the understanding of the blazar phenomenon. The first is the BL Lac object PKS 2155-304, one of the brightest blazars in the UV and soft X-ray sky. The second is the superluminal quasar 3C 279, the first and one of the brightest blazars detected in -rays.
The discovery by the EGRET instrument on board CGRO that blazars emit copious fluxes of -rays changed substantially our view of the energy distribution. These observations revealed a new spectral component, a hint of which was given by the flat X-ray spectra of some blazars, with power comparable and sometimes dominant with respect to the previously known synchrotron component.
The spectral energy distributions of blazars from the radio to the -ray range can now be described in a general way as composed of two broad peaks in the power per decade, corresponding to the synchrotron and inverse Compton emission, respectively. Blazars of different luminosities appear to lie along a spectral sequence (Fossati et al. 1998) whereby both peaks fall at higher frequencies for lower luminosity objects. Thus highly luminous objects are ”red”, meaning that the first peak falls at frequencies smaller than the optical range and therefore the optical-UV continuum is steep, while low luminosity objects are ”blue” having peak frequency beyond the UV range and therefore flat (blue) optical-UV continua. For red blazars the second spectral component peaks within or below the EGRET (0.1-10 GeV) range, while for blue blazars it peaks beyond the EGRET range. PKS 2155-304 and 3C 279 are prototypes of blue and red blazars, respectively.
From IR frequencies upwards the synchrotron emission should be optically thin and could be produced in a single zone of the jet, allowing the adoption of a homogeneous model. The second spectral component (peaking in -rays) is thought to be produced by high energy electrons upscattering soft photons via the inverse Compton process. The seed photons for upscattering could be the synchrotron photons themselves (synchrotron self Compton model, SSC) or photons outside the jet (external Compton model, EC) possibly produced in an accretion disk or torus and scattered or reprocessed by the surrounding gas (e.g., Sikora 1994; Ulrich et al. 1997, and references therein).
If the same region is responsible for the two spectral components, irrespective of the nature of the seed photons, emission at the two peaks must derive from the same high energy electrons. Therefore a change in the density and/or spectrum of those electrons is expected to cause correlated variability at frequencies close to the two peaks. Measuring the two peaks simultaneously is thus an essential step for determining the physical parameters of the emission region and studying the variability of the spectra around the peaks yields unique insight into the mechanisms of particle acceleration and energy loss in the jet. The variability correlation should enable disentangling the contribution of different sources of seed photons (SSC vs. EC).
4.1 PKS 2155–304
PKS 2155-304 is one of the brightest sources in the extragalactic sky at UV and soft X-ray wavelengths. As such, it was repeatedly observed in many wavebands (Maraschi et al. 1986, Urry et al. 1988, Treves et al. 1989, Edelson et al. 1991). Two major intensive multiwavelength campaigns were organized on this source. The first was based on 5 days of quasi-continuous coverage with IUE and 3.5 days with ROSAT (Urry et al. 1993, Brinkmann et al. 1994, Edelson et al. 1995). The UV and X-ray light curves showed rapid variations of moderate amplitude (), strongly correlated in the overlapping time intervals, with the soft X-rays leading the UV variations by no more than 2-3 hours. Therefore variability was essentially ”achromatic”, that is independent of wavelength, ruling out an accretion disk as the origin of the UV continuum. Over the whole monitoring period of about 1 month the UV intensity increased by a factor 2, the same as observed in the optical and IR.

A second, longer campaign, with 10 days of IUE, 9 days of EUVE, 2 days of ASCA, and three short ROSAT observations, took place in May 1994 (Pesce et al. 1997, Pian et al. 1997, Urry et al. 1997) and caught a well defined flare (factor 2.5) during the two days of ASCA observations, which can be most plausibly related with the smaller amplitude intensity peaks (35 %) seen at later times in the EUVE and IUE light curves. The light curves from this campaign are shown in Figure 4. The X-ray flare appears to lead the EUVE and UV events by 1 and 2 days, respectively, an order of magnitude longer than the lag detected in the previous campaign. Within the ASCA data the 0.5-1 keV photons lagged the 2.2-10 keV photons by 1.5 hours.
Note how the UV light curve is well defined and how the differences between the LWP and SWP normalized fluxes are small, except for the initial extremely fast and deep minimum. This event is discussed in detail in Pian et al. (1997) and is not completely understood.
Despite the differences, these two campaigns give the first evidence that the variations from 5 eV to 10 keV are correlated on short time scales and that the emission at higher frequencies leads the one at lower frequencies. The flare event observed during the second campaign has characteristics as expected from the propagation of a shock wave along an inhomogeneous relativistic jet. The cause of the flare in this model is a propagating disturbance affecting different regions at different times.
4.2 3C 279
3C 279 () was the first blazar discovered to emit strong and variable -rays (Hartman et al. 1992).
There have been several multi-wavelength observations of this blazar (Maraschi et al. 1994, Hartman et al. 1996, Wehrle et al. 1998). In particular, 3C 279 was monitored with IUE and ROSAT for three weeks between December 1992 and January 1993, simultaneously with -ray observations by EGRET, and with coordinated optical observations. At that epoch the intensity of 3C 279 was at a historical minimum at all measured wavelengths above the sub-mm ones. The variability amplitude of the continuum with respect to the bright state of June 1991 increased with frequency from the IR to the UV. It is possible that the residual UV emission contains a substantial contribution from an accretion disk (see Pian et al. 1998). This thermal radiation, which is expected to vary with more modest amplitude than the beamed synchrotron UV emission, might be responsible for powering the strong, not significantly variable, Ly emission line, visible in all archival IUE SWP spectra of 3C 279 (Koratkar et al. 1998).
Regarding the second spectral component the variability amplitude was small in the soft (ROSAT) X-ray range but extremely large in -rays, larger than in any other waveband. This showed that the inverse Compton emission had varied much more than the synchrotron one, an effect expected in the SSC model. A similar behaviour could be reproduced in the EC model only if the ambient photons had varied in a correlated fashion with the electrons in the jet.

A second intensive multiwavelength monitoring, based on a 3-week coordinated program involving CGRO, XTE and IUE observations, took place in January-February 1996 (Wehrle et al. 1998). A huge flare was observed in -rays and a similar but less extreme event was seen by XTE. The X and -ray peaks were simultaneous within the one day uncertainty. The IUE light curve at 2600 Å (Fig. 5) is reasonably well sampled during the first part of the campaign but not toward the end, when the flare occurred and observations of 3C 279 were extended as Target of Opportunity. It shows a broad minimum at 25-26 January, followed by a rise of almost a factor 2, but with a three day gap before and up to the -ray peak. Due to the faintness of the source and to the scattered light problem during the final stages of the IUE mission, systematic errors may affect some of the IUE observations. Despite the non optimal sampling, the IUE observations provide important constraints, as discussed below.
In Figure 6 the broad band energy distributions obtained at the flare peak and in a preflare state (1996 January 25-26) are compared with those of the discovery epoch (June 1991) and with the low state of January 1993.
Comparing the flare and preflare states it is clear that the high energy SED (X-ray to -ray) is harder at the flare peak, as implied by the larger amplitude of the -ray variation. From IR to UV frequencies the flare vs preflare variations are much smaller than in X-rays and -rays. This has important consequences for theoretical models, as the relative variability in the synchrotron and inverse Compton components can indicate the origin of the seed photons that may be upscattered to the -ray band.

The amplitude of the -ray variation during the 1996 outburst (factor 10) is more than the square of the observed IR-optical flux change (factor ) which is a severe difficulty for both the SSC and EC scenarios. Possible ways out are the following: (i) different emission zones could contribute to the IR-optical flux, diluting the intrinsic variation associated with the -ray flaring region; (ii) the synchrotron peak corresponding to the -ray peak may fall at frequencies lower than IR, where adequate variations could have occurred; (iii) an alternative possibility is the ”relativistic mirror” model of Ghisellini and Madau (1996), combining advantages of both the SSC and EC models. While we cannot completely rule out the SSC scenario or, for similar arguments the ”standard” EC scenario, the mirror model requires very special conditions and is under discussion (Boettcher & Dermer 1998).
5 Conclusions
The years spent motivating, obtaining, analysing and discussing IUE data were a vital phase in the evolution of astrophysical research in the Milan area and were certainly scientifically very productive.
Because of our interest in collapsed objects, we exploited among the capabilities of IUE those that were better matched to the joint study of the UV and X-ray emission. The low resolution mode was used since most of the objects were weak but also because it allowed a good measure of the spectral shape of the continuum, which was in many cases an essential objective of the investigation.
In retrospect, we can say that our contributions to the study of the interrelations between the UV and the X-ray emission were very successful. In galactic systems they helped localizing different emission regions and reconstructing the matter flow towards the central object. In Seyfert galaxies and quasars the problems that could be addressed were similar although on different scales. It is worthwhile mentioning that the issue of the dominance of the UV bump or of the hard X-ray emission in the broad band energy distribution of AGN is still not completely assessed for different classes of sources.
For blazars, the continuity or “discontinuity” of the UV and X-ray spectral shapes were the first evidence of the presence of two distinct emission components later spectacularly confirmed by the -ray observations. The recent multiwavelength campaigns have shown conclusively that both components derive from the same high energy electrons accelerated in a relativistic jet. Understanding the nature of the seed photons upscattered to -ray energies and probing the nature of the acceleration mechanisms seem reachable goals for further multiwavelength observations.
In our experience a lasting lesson from IUE has been its scheduling flexibility, which allowed for the first time the study of correlated optical-UV-X-ray variability in a large number of astrophysical situations, some of which illustrated above.
The scientific importance of such correlation studies has been widely recognized, and indeed new X-ray missions are designed with the addition of small optical-UV telescopes (XMM, INTEGRAL, SPECTRUM - X ). However these “complementary” instruments have little spectroscopic capabilities and limited wavelength ranges even for studies of the continuum. At the other extreme, the UV capabilities of HST are unrivalled but its rigid scheduling poses great difficulties for this kind of observations. It seems therefore that the IUE heritage still needs to be fully recognized and pursued by future missions.
References
- \astronciteAllen et al.1982 Allen, A. D., Ward, M. J., & Hyland 1982, MNRAS, 199, 969
- \astronciteBoettcher & Dermer1998 Boettcher, M., & Dermer, C. D. 1998, ApJL, submitted (astro-ph/9804078)
- \astronciteBregman et al.1987 Bregman. J. N., Maraschi, L., & Urry, C. M. 1987, in Scientific Accomplishments of IUE, ed. Y. Kondo (Dordrecht: Reidel), p. 685
- \astronciteBrinkmann et al.1994 Brinkmann, W., et al. 1994, A&A, 288, 433
- \astronciteChiappetti et al.1983 Chiappetti, L., et al. 1983, ApJ, 265, 354
- \astronciteChiappetti et al.1989 Chiappetti, L., et al. 1989, ApJ, 342, 493
- \astronciteCowley et al.1983 Cowley, A., et al. 1983, ApJ, 335, 142
- \astronciteDupree et al.1978 Dupree, A., et al. 1978, Nature, 275, 400
- \astronciteDupree et al.1980 Dupree, A., et al. 1980, ApJ, 237, 163
- \astronciteEdelson et al.1991 Edelson, R. A., et al. 1991, ApJ, 372, L9
- \astronciteEdelson et al.1995 Edelson, R. A., et al. 1995, ApJ, 438, 120
- \astronciteFossati et al.1998 Fossati, G., et al. 1998, MNRAS, submitted
- \astronciteGhisellini et al.1985 Ghisellini, G., Maraschi, L., & Treves, A. 1985, A&A, 146, 204
- \astronciteGhisellini et al.1986 Ghisellini, G., Maraschi, L., Tanzi, E. G., & Treves, A. 1986, ApJ, 310, 317
- \astronciteGhisellini & Maraschi1989 Ghisellini, G., & Maraschi, L. 1989, ApJ, 340, 181
- \astronciteGhisellini & Madau1996 Ghisellini, G., & Madau, P. 1996, MNRAS, 280, 67
- \astronciteHartman et al.1992 Hartman, R. C., et al. 1992, ApJ, 385, L1
- \astronciteHartman et al.1996 Hartman, R. C., et al. 1996, ApJ, 461, 698
- \astronciteHatchett & McCray1977 Hatchett, S., & Mc Cray, R. 1977, ApJ, 211, 552
- \astronciteImpey & Tapia1988 Impey, C. D., & Tapia, S. 1988, ApJ, 333, 666
- \astronciteKoratkar et al.1998 Koratkar, A., Pian, E., Urry, C. M., & Pesce, J. E. 1998, ApJ, 492, 173
- \astronciteMaraschi et al.1980a Maraschi, L., Treves, A., Tanzi, E. G., & Tarenghi, M. 1980a, Nature, 285, 555
- \astronciteMaraschi et al.1980b Maraschi, L., et al. 1980b, ApJ, 241, L23
- \astronciteMaraschi et al.1985 Maraschi, L., Schwartz, D. A., Tanzi, E. G., & Treves, A. 1985, ApJ, 294, 615
- \astronciteMaraschi et al.1986 Maraschi, L., Tagliaferri, G., Tanzi, E. G., & Treves, A. 1986, ApJ, 304, 637
- \astronciteMaraschi et al.1988 Maraschi, L., Calanchi, C., Treves, A., Blades, J. C., & Tanzi, E. G. 1988, ApJ, 333, 660
- \astronciteMaraschi et al.1991 Maraschi, L., et al. 1991, ApJ, 368, 138
- \astronciteMaraschi et al.1994 Maraschi, L., et al. 1994, ApJ, 435, L91
- \astroncitePesce et al.1997 Pesce, J. E., et al. 1997, ApJ, 486, 770
- \astroncitePian & Treves1993 Pian, E., & Treves, A. 1993, ApJ, 416, 130
- \astroncitePian et al.1994 Pian, E., Falomo, R., Scarpa, R., & Treves, A. 1994, ApJ, 432, 547
- \astroncitePian et al.1996 Pian, E., Falomo, R., Ghisellini, G., Maraschi, L., Sambruna, R. M., Scarpa, R., & Treves, A. 1996, ApJ, 459, 169
- \astroncitePian et al.1997 Pian, E., et al. 1997, ApJ, 486, 784
- \astroncitePian et al.1998 Pian, E., et al. 1998, in preparation
- \astronciteSambruna et al.1992 Sambruna, R. M., et al. 1992, ApJ, 391, 750
- \astronciteSambruna et al.1996 Sambruna, R. M., Maraschi, L., & Urry, C. M. 1996, ApJ, 463, 444
- \astronciteScarpa et al.1995 Scarpa, R., Falomo, R., & Pian, E. 1995, A&A, 303, 730
- \astronciteSikora1994 Sikora, M. 1994, ApJS, 90, 923
- \astronciteTreves et al.1980 Tanzi, E. G., et al. 1980, A&A, 83, 270
- \astronciteTreves et al.1986 Tanzi, E. G., et al. 1986, ApJ, 311, L13
- \astronciteTreves et al.1980 Treves, A., et al. 1980, ApJ, 242, 1114
- \astronciteTreves et al.1988a Treves, A., et al. 1988a, ApJ, 335, 142
- \astronciteTreves et al.1988b Treves, A., et al. 1988b, ApJ, 325, 119
- \astronciteTreves et al.1988c Treves, A., et al. 1988c, ApJ, 330, 178
- \astronciteTreves et al.1989 Treves, A., et al. 1989, ApJ, 341, 733
- \astronciteTreves & Girardi1990 Treves, A., & Girardi, E. 1990, in Variability of Active Galaxies, ed. W. J. Duschl, S. J. Wagner, and M. Camenzind, Lecture Notes in Physics, 377 (Springer Verlag: Berlin), p. 175
- \astronciteTreves et al.1990 Treves, A., et al. 1990, ApJ, 359, 98
- \astronciteTreves et al.1995 Treves, A., et al. 1995, ApJ, 442, 589
- \astronciteUlrich et al.1998 Ulrich, M.-H., Maraschi, L., & Urry, C. M. 1997, ARA&A, 35, 445
- \astronciteUrry et al.1988 Urry, C. M., Kondo, Y., Hackney, K. R. H., & Hackney, R. L. 1988, ApJ, 330, 791
- \astronciteUrry et al.1993 Urry, C. M., et al. 1993, ApJ, 411, 614
- \astronciteUrry & Padovani1995 Urry, C. M., & Padovani, P. 1995, PASP, 107, 803
- \astronciteUrry et al.1997 Urry, C. M., et al. 1997, ApJ, 486, 799
- \astronciteWagner & Witzel1995 Wagner, S. J., & Witzel, A. 1995, ARA&A, 33, 163
- \astronciteWehrle et al.1998 Wehrle, A. E., et al. 1998, ApJ, 497, 178