The effect of bars on the obscuration of active nuclei
Abstract
We present evidence for a strong correlation between the gaseous absorbing column density towards type 2 Seyfert nuclei and the presence of a stellar bar in their host galaxies. Strongly barred Seyfert 2 galaxies have an average NH that is two orders of magnitude higher than non-barred Sy2s. More than 80% of Compton thick (N) Seyfert 2s are barred. This result indicates that stellar bars are effective in driving gas in the vicinity of active nuclei.
Key Words.:
Galaxies: nuclei–Galaxies: Seyfert1 Introduction
Large scale gravitational torques, such as bars and interactions, are thought to transport gas into the central region of galaxies and, specifically, in the vicinity of active galactic nuclei (Shlosman et al. 1990). Seyfert galaxies are the low luminosity subset of AGNs. According to the accreting supermassive black hole paradigm, the accretion rate inferred for Seyfert nuclei is low () and, therefore, much fuelling from the host galaxy is not required. Indeed, McLeod & Rieke (1995), Ho et al. (1997a), Mulchaey & Regan (1997) show that the occurrence of bars in Seyfert galaxies is not higher than in normal galaxies. Yet, there is both theoretical and observational evidence that stellar bars do drive gas into the central region of galaxies (Athanassoula 1992, Tacconi et al. 1997, Laine et al. 1998). The resulting central concentration of gas might not be relevant for the fuelling process, but can play a role in the obscuration of the active nucleus, i.e. stellar bars could contribute to the obscuration that affects Seyfert 2s. This connection would be very important for the unified theories (Antonucci 1993). In this letter we tackle this issue by comparing the degree of obscuration in Sy2s with the strength of the stellar bar in their host galaxy.
2 Dependence of the absorbing NH on the bar strength
Hard X-ray spectra can be regarded as the best tool to measure directly the absorbing column density in Seyfert galaxies. Recent surveys have significantly enlarged the sample of Sy2s for which an estimate of NH is available, and have also reduced the bias against heavily obscured objects that plagued former studies (Maiolino et al. 1998a, Bassani et al. 1998, Risaliti et al. 1998).
We restricted our study to obscured Seyferts in the Maiolino & Rieke (1995) sample, completed with 18 additional objects discovered in the Ho et al. (1997b) survey. These two Seyfert samples are much less biased than others in terms of luminosity and obscuration of the active nucleus and, therefore, can be considered representative of the local population of Seyfert galaxies.
For AGNs which are thin to Compton scattering (i.e. N) along our line of sight the NH can be derived from the photoelectric cutoff in the 2–10 keV spectral range, provided that the signal to noise is high enough. If the source is Compton thick then the direct component in the 2–10 keV range is completely suppressed and we can only observe the reflected component, generally little absorbed. As a consequence, Compton thick Sy2s are sometimes misidentified as “low absorption objects” when observed in the 2-10 keV range. However, the fact that the absorbing column density is actually higher () can be inferred from several indicators, such as the equivalent width of the Fe line and the spectral slope, and by comparing the X-ray flux with other isotropic indicators of the intrinsic luminosity. A more detailed discussion of this issue is given in Maiolino et al. (1998a) and Bassani et al. (1998). We just mention that sensitive spectra at higher energies, such as those obtained by BeppoSAX in the 10–200 keV band, can identify column densities in the range (Matt et al. 1998, Cappi et al. 1998) or set a lower limit of (Maiolino et al. 1998a).
| Name | Log(NH)a | Bar classificationb | ||
|---|---|---|---|---|
| RC3 | Othersc | Adopted | ||
| NGC1068 | 25 | SA | bar1 | SB |
| NGC1365 | 23.3 | SB | – | SB |
| NGC1386 | 24 | SB | – | SB |
| NGC1808 | 22.5 | SAB | – | SAB |
| NGC2110 | 22.5 | SAB | – | SAB |
| NGC2273 | 25 | SB | double-bar2 | SB |
| NGC2639 | 23.6 | SA | no-bar3 | SA |
| NGC2992 | 21.8 | – | no-bar5 | SA |
| NGC3031 | 20.9 | SA | – | SA |
| NGC3079 | 22.2 | SB | – | SB |
| NGC3081 | 23.8 | SAB | double-bar2,7 | SAB |
| NGC3147 | 20.6 | SA | – | SA |
| NGC3281 | 23.9 | SAB | – | SAB |
| NGC3393 | 25 | – | bar2,5 | SAB |
| NGC4258 | 23.2 | SAB | – | SAB |
| NGC4388 | 23.6 | SA | boxy-bulge4,5 | SAB |
| NGC4507 | 23.5 | SAB | bar2 | SAB |
| NGC4565 | 21.8 | SA | – | SA |
| NGC4579 | 20.6 | SAB | – | SAB |
| NGC4594 | 21.7 | SA | – | SA |
| NGC4941 | 23.6 | SB | – | SB |
| NGC4939 | 25 | SA | – | SA |
| NGC4945 | 24.6 | SB | – | SB |
| NGC5005 | 24 | SAB | – | SAB |
| NGC5033 | 20.9 | SA | no-bar3 | SA |
| NGC5135 | 24 | SB | bar2,3 | SB |
| NGC5194 | 23.7 | SA | – | SA |
| NGC5347 | 24 | SB | bar2 | SB |
| NGC5506 | 22.5 | – | no-bar3 | SA |
| NGC5643 | 23.3 | SAB | bar2 | SAB |
| NGC5674 | 22.8 | SAB | bar4 | SAB |
| NGC7172 | 22.9 | – | no-bar3 | SA |
| NGC7314 | 22.1 | SAB | bar3 | SAB |
| NGC7319 | 23.5 | SAB | – | SAB |
| NGC7582 | 23.1 | SB | – | SB |
| NGC7590 | 20.9 | – | no-bar3 | SA |
| IC2560 | 24 | SB | – | SB |
| IC3639 | 25 | SB | bar2 | SB |
| IC5135 | 24 | – | bar2,3 | SAB |
| IC5063 | 23.4 | SA | no-bar2 | SA |
| Circinus | 24.7 | SA | – | SA |
| IRAS0714 | 25 | SA | – | SA |
| IRAS1832-59 | 22.1 | SA | – | SA |
| Mk1066 | 24 | SB | – | SB |
-
a In units of cm-2; these values are from Bassani et al. (1998) and Risaliti et al. (1998).
-
b SA = non-barred; SAB = weakly barred; SB = strongly barred.
-
c References: 1–Thatte et al. (1997); 2–Mulchaey et al. (1997); 3–Hunt et al. (in prep.); 4–McLeod & Rieke (1995); 5–Alonso-Herrero et al. (1998).
In Tab. 1 we list all the Seyfert 2, 1.9 and 1.8 galaxies (i.e. those showing indication of obscuration) in the joint Maiolino & Rieke (1995) and Ho et al. (1997b) samples which have an estimate of the absorbing NH based on X-ray data, and for which a bar classification is also available. With regard to the bar we generally favored the classification based on near–IR images (since these are less affected by extinction) and quantitative identifications of the stellar bars based on ellipticity, position angle, “boxy-shape” and brightness profile arguments as measured from digital (unsaturated) images. Otherwise the optical classification reported in the RC3 was adopted (de Vaucouleurs et al. 1991). However, in almost all cases the RC3 identification of bars was in agreement with the other works. Whenever the RC3 classification was not in conflict with the near-IR and/or “quantitative” classification (i.e. in most cases), we further split barred systems in strongly barred (SB) and weakly barred (SAB) as reported in the RC3. Four objects not classified or classified as non-barred in the RC3, while their infrared images show indications of a bar; in these cases we adopt the classification SAB, with the exception of NGC1068, whose bar appears strong in the K-band image (Thatte et al. 1998).
The completeness of this Sy2s sample is discussed in detail in Risaliti et al. (1998). We could not find obvious biases or other correlations that could introduce spurious relations between NH and bar properties. In particular, there is no correlation between NH and the luminosity of active nuclei (Risaliti et al. 1998).
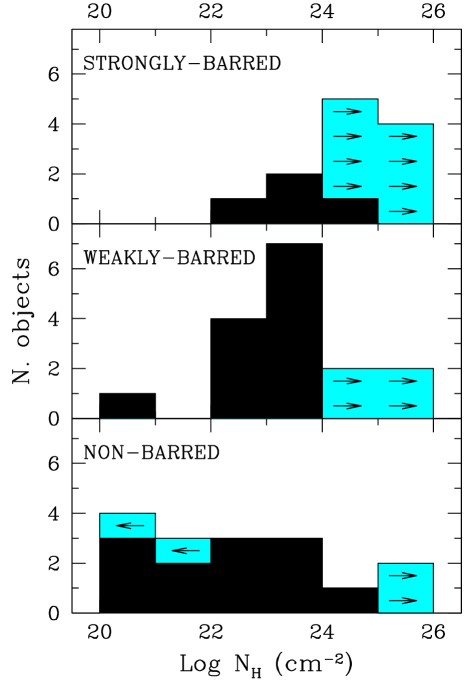
Fig. 1 shows the distribution of NH for subsamples of increasing stellar bar strength, ordered from bottom to top. There is a clear tendency for NH to increase along the sequence. Tab. 2 quantifies this apparent trend. The median of the NH distribution111The median is estimated by means of the Kaplan-Meier estimator that takes into account also censored data. increases by more than two orders of magnitude going from unbarred to strongly barred Sy2s. The confidence of the results is given by the Gehan test (Feigelson & Nelson 1985), that takes into account also censored data: strongly barred and unbarred Sy2s have NH distributions that are different at a confidence level higher than 99%. Another impressive result is that more than 80% of Compton thick (N) Sy2s are barred (13 out of 16), to be compared with 55% of the general population and specifically of early type systems that typically host Seyfert activity (Sellwood & Wilkinson 1993, Ho et al. 1997a). Also 56% of Compton thick Sy2s are hosted in strongly barred systems, to be compared with 25% of the general population.
| Parameter | Non–barred | Weakly | Strongly |
|---|---|---|---|
| barred | barred | ||
| No. objects | 16 | 16 | 12 |
| Med. Log(NH)a | 22.1 | 23.5 | 24.4 |
| Compton thick: | |||
| No. (%) | 3 (18.7%) | 4 (25.0%) | 9 (56.2%) |
| Probabilityb | 89% | 99% |
a Median of Log(NH) in units of cm-2.
b Probability for the NH distribution of intermediate and
strongly barred Sy2s to be different from the NH distribution
of non-barred Sy2s.
3 Other indications
Maiolino et al. (1997) found that Sy2s are characterized by a rate of non-axisymmetric potentials (including interactions and peculiar morphologies) about 20% higher than Sy1s, this difference appears significant. Hunt & Malkan (1998) find the occurence of bars in Sy2s not significantly higher than in Sy1s within the CfA and the 12 samples. In the samples of Ho et al. (1997a) and Mulchaey & Regan (1997) the occurrence of bars in type 2 Seyferts is 10–20% higher than type 1 Seyferts. These results indicate that even if bars drive gas into the circumnuclear region, such gas does not reduce much the opening angle of the light cones. Yet, if the correlation between bar strength and amount of circumnuclear gas obtained for Sy2s applies also to Sy1s, we would expect a large amount of gas in the circumnuclear region of barred Sy1s as well.
The circumnuclear (cold) gas is expected to Compton-reflect the nuclear X-ray radiation. This Compton-reflected component should flatten the X-ray spectrum in the 10–30 keV spectral range. Therefore, within the bar–circumnuclear gas connection scenario depicted above, we would expect barred Sy1s to have a flatter spectrum in the 10–30 keV band. However, this test is subject to various caveats. First, variability affects the slope of the observed spectrum because of the time-lag between the primary and reprocessed radiation. Second, a fraction of the “cold” reflection is expected to come from the accretion disk. Third, the effect is expected to be small: the reflected component should contribute no more than 30% in this spectral region. Fourth, to date spectra in this X-ray band are sparse and with low sensitivity. So far, the only (small) sample of Sy1s observed at energies higher than 10 keV is the one presented in Nandra & Pounds (1994), that use Ginga data. Their sample contains nine Sy1s whose host galaxy have a bar classification. As shown in Tab. 3 the spread of the photon index measured between 10 and 18 keV is large. Nonetheless, Tab. 3 shows a tendency for the hard X-ray spectra of barred Sy1s to be flatter than the unbarred Sy1s.
| Parameter | Non–barred | Weakly | Strongly |
|---|---|---|---|
| barred | barred | ||
| 1.69 0.24 | 1.310.10 | 1.240.47 | |
| (No. objects) | (3) | (3) | (3) |
| 0.92 0.07 | 1.200.23 | 1.580.80 | |
| (No. objects) | (5) | (6) | (8) |
a = N band () luminosity; = 2–10 keV luminosity.
Large amounts of circumnuclear gas in Sy1s could be detected via dust-reprocessed light in the infrared. More circumnuclear gas would imply more warm (AGN-heated) dust, hence more infrared emission relative to the intrinsic luminosity of the AGN (traced by the hard X-ray luminosity). The mid–IR () is an excellent band to look for this excess, since the AGN IR emission peaks there (Maiolino et al. 1995). Also, by using narrow beam photometry it is possible to isolate the contribution of the AGN from the host galaxy. Within the scenario of the bar–circumnuclear gas connection, barred Sy1s are expected to show a mid-IR to X-ray flux ratio higher than non-barred Sy1s. Yet, several caveats affect this test as well. Both short and long term variability plague the reliability of the X-ray flux as a calibrator of the AGN luminosity. Equilibrium temperature arguments indicate that the dust emitting significantly at 10 should be located within the central 1–10 pc; therefore, excess of circumnuclear gas distributed over the 100 pc scale would not be probed by this indicator. Finally, even the small aperture (5′′) used in most of the groundbased mid-IR observations might include the contribution from a central compact starburst. Tab. 3 reports the mean of the 10/2–10keV luminosity ratio as a function of the bar strength for a sample of 19 Sy1s. The 10 data are from Maiolino et al. (1995) and from Giuricin et al. (1995); the X-ray data are from Malaguti et al. (1994), where we choose the datum closest in time to the mid-IR observation, to minimize long term variability effects. There is a tendency for barred systems to have a higher L10μm/LX ratio, though the spread is large and the statistics are poor.
4 Discussion
The important result of our study is that the absorbing column density of type 2 Seyferts strongly correlates with the presence of a stellar bar in their host galaxies. As discussed in the Introduction, this result is not completely unexpected: stellar bars are very effective in driving gas into the central region, thus contributing to the obscuration of AGNs. On the other hand this gas should not play a major role in powering low luminosity AGNs, such as Seyfert nuclei, given the lack of correlation between stellar bars and Seyfert activity (McLeod & Rieke 1995, Mulchaey & Regan 1997, Ho et al. 1997a).
As discussed in the former section, the fraction of bars in Sy2s is only moderately higher (at most by 20%) than in Sy1s. So, the gas accumulated in the central region by the stellar bar increases the column density outside the light cones, but it does not increase much the covering factor of the obscuring material. A possible explanation is that radiation and wind/jet pressure act to destroy or expel molecular clouds that happen to enter the light cones, while outside the light cones self-shading allows molecular clouds to survive and pile up along our line of sight. Another possibility is that the inflowing gas concentrates at dynamical resonances (eg. Lindblad resonances) forming obscuring tori. The solid angle that such tori subtend to the AGN depends on their inner radius and thickness, that in turn depend on the dynamical and kinematical properties of the nuclear region, but are relatively independent of the amount of gas in the torus (if the gas self–gravity is significant the torus would flatten, thus actually reducing its covering solid angle). On the other hand, the NH through the torus depends linearly on its mass.
Our result has also important implications on the scales over which the obscuring material is distributed. Large scale stellar bars can transport gas into the central few 100 pc, but they exert little influence on the gas dynamics on smaller nuclear scales. As a consequence, a first interpretation of our bar–NH link is that a large fraction of the obscuration in Sy2s occurs on the 100 pc scale. This is in line with results obtained from HST images, that ascribe the obscuration of several Sy2s nuclei to dust lanes or disks a few 100 pc in size (eg. Malkan et al. 1998). Yet, one of the most interesting results of our study is that stellar bars appear very effective in making the obscuration of Sy2 nuclei so high to be Compton thick: more than 80% of Compton thick Sy2s are barred. As discussed in Risaliti et al. (1998), column densities larger than 10 are unlikely to be distributed on the 100 pc scale, since the implied nuclear gas mass would exceed the total dynamical mass in the same region for several objects. This consideration generally constrains most of the Compton thick gas to be located within a few 10 pc from the nucleus. On the other hand, on these small scales the gas dynamics is expected to be little affected by the non-axisymmetric potential of a stellar bar in the host galaxy. The connection between large stellar bars and Compton thickness of Sy2s thus requires some mechanism to link the dynamics on these different scales. Shlosman et al. (1989) proposed that if the large scale stellar bar collects in the central region a mass of gas that is a significant fraction of the dynamical mass, then the gaseous disk might become dynamically unstable and form a gaseous bar that could drive gas further into the nuclear region. A nuclear gaseous bar has been recently discovered in the nearby Circinus galaxy (Maiolino et al. 1998b), that hosts a Compton thick Seyfert 2 nucleus, in agreement with expectations. Ironically, this galaxy has been classified as non-barred in the RC3 catalog; however the fact that it is edge on and located in the Galactic plane (where crowding and patchy extinction confuse the large scale morphology) might have prevented the identification of a large scale stellar bar. Alternatively, nested secondary stellar bars have also been observed in several galaxies and also in Seyfert galaxies (Mulchaey & Regan 1997), and are thought to be more stable (Friedli & Martinet 1993). An encouraging result in this direction is that the only two Sy2s showing evidence for an inner secondary stellar bar and for which the NH has been estimated are actually heavily obscured (see Tab. 1). However the opposite is not true: 5 other Compton thick Sy2s imaged in the near–IR by Mulchaey et al. (1997) do not show evidence for inner bars, though the limited angular resolution might have prevented their detection.
Acknowledgements.
We are grateful to L. Hunt for providing us with information on her data in advance of publication. This work was partially supported by the Italian Space Agency (ASI) through the grant ARS–98–116/22.References
- (1) Alonso-Herrero A., Simpton C., Ward M.J., Wilson A.S., 1998, ApJ 495, 196
- (2) Antonucci R.R.J, 1993, ARA&A 31, 473
- (3) Athanassoula E., 1992, MNRAS, 259, 345
- (4) Bassani L., Dadina M., Maiolino R., et al. 1998, ApJS, in press
- (5) Cappi M., Bassani L., et al. 1998, ApJ, submitt
- (6) de Vaucouleurs G., de Vaucouleurs A., Corwin H.G., Buta R.J.Jr., Paturel G., Fauquè P., 1991, Third reference Catalogue of Bright Galaxies, Springer-Verlag
- (7) Feigelson E..D., Nelson P.I., 1985, ApJ 293, 192
- (8) Giuricin G., Mardirossian F., Mezzetti M., 1995, ApJ, 446, 550
- (9) Friedli D., Martinet L., 1993, A&A, 277, 27
- (10) Ho, L., Filippenko, A., Sargent, W., 1997a, ApJ, 487, 522
- (11) Ho, L., Filippenko, A., Sargent, W., 1997b, ApJS, 112, 315
- (12) Hunt, L., Malkan, M., 1998, ApJ submitt
- (13) Laine S., Kenney J., Yun M., Gottesman S., ApJ in press
- (14) Maiolino R., Rieke G.H., 1995, ApJ 454, 95
- (15) Maiolino R., Ruiz M., Rieke G., Keller L., 1995, ApJ 446, 561
- (16) Maiolino R., Ruiz M., Rieke G.H., Papadopoulous P., 1997, ApJ 485, 522
- (17) Maiolino R., Salvati M., Bassani L., et al. 1998a, A&A,338,781
- (18) Maiolino R., Alonso-Herrero A., Anders S., Quillen A., Rieke G.H., Tacconi-Garman L., 1998b, Adv. Sp. Res., in press
- (19) Malaguti G., Bassani L., Caroli E., 1994, ApJS, 94, 517
- (20) Malkan M.A., Gorjian V., Tam R., 1998, ApJS, 117, 25
- (21) Matt G., Guainazzi M., Maiolino R., et al., 1998, A&A, in press
- (22) McLeod K.K., Rieke G.H., 1995, ApJ, 441, 96
- (23) Mulchaey, J.S., Regan, M.W., 1997, ApJ, 482, L135
- (24) Mulchaey, J.S., Regan, M.W., Arunav, K., 1997, ApJS, 110, 299
- (25) Nandra K., Pounds K.A., 1994, MNRAS 268, 405
- (26) Risaliti G., Maiolino R., Salvati M., 1998, ApJ, submitt
- (27) Sellwood, J.A., Wilkinson, A., 1993, Rep. Prog. Phys., 56, 173
- (28) Shlosman, I., Frank J., Begelman, M.C., 1989, Nat., 338, 45
- (29) Shlosman, I., Begelman, M.C., Frank, J., 1990, Nat., 345, 679
- (30) Tacconi L.J., Gallimore J.F., Genzel R., Schinnerer E., Downes D., 1997, Ap&SS, 248, 59
- (31) Thatte, N., Quirrenbach, A., Genzel, R., Maiolino R., Tecza M., 1997, ApJ 490, 238