DEEP ISOCAM OBSERVATIONS OF GALAXY CLUSTERS
Abstract
Ten galaxy clusters, with redshift ranging from 0.2 to 1, have been
observed with the ISO camera in the two bands LW2 and LW3 (centered
respectively at 6.75 m and 15 m). We present a first
analysis for three of these clusters at redshift 0.2, 0.5 and 1.
Key words: ISO; infrared astronomy; galaxy clusters.
1. INTRODUCTION
Galaxy evolution is strongly influenced by the environment.
The galaxy morphology is related to the density of its
environment (Dressler 1980) and, in the case of galaxy clusters,
elliptical galaxies are more common than spirals with respect to the field.
If we look to distant clusters we detect some evolution
effects as Butcher-Oemler effect (1984) or a
variation in the morphological content with the redshift (Dressler et al., 1997)
.
In this observational program of galaxy clusters at medium and high redshift (P.I.: A. Franceschini; collaborators: C. Cesarsky, P.A. Duc, A. Moorwood and A. Biviano), we are interested in studying the galaxy evolution with respect to their distance from the cluster center, in observing active galaxies in clusters and finally, in comparing the behavior of galaxies in clusters and in the field. This is really interesting especially after the results of IR deep surveys which claim the existence of a population of galaxies with great IR fluxes in the past (), which does not present any peculiar optical signature (Elbaz et al. 1998, Aussel et al. 1998).
2. OBSERVATIONS
Ten rich galaxy clusters, with redshift ranging from 0.2 to 1, have been observed with the ISO camera in the two bands LW2 and LW3 (centered respectively at 6.75 m and 15 m). Three of them were observed very deeply (see Tables 1 and 2 ).
Optical follow-up’s of the observed clusters are scheduled in the next months. Only that of A1689 has already been carried out in May 1998 with EMMI on the NTT at La Silla (P.I.: P.A. Duc). A total of about 120 spectra have been obtained in a field of 35 square arcminutes centered on Abell 1689. The observed objects were mostly the optical counterpart candidates of the sources detected in the ISOCAM bands and the data are in course of reduction.
| Cluster | z | Field of | Pix. | Time |
| Name | View | FoV | (sec) | |
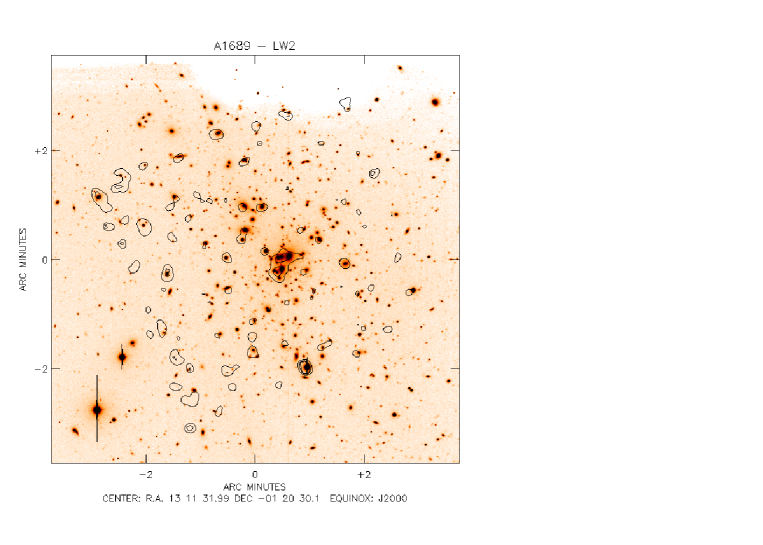
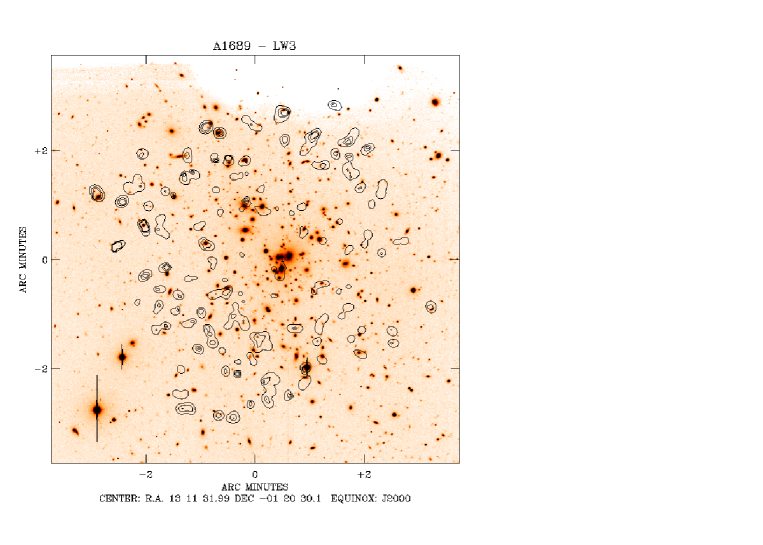
| A1689 | 0.19 | 5.6′ 5.6′ | 6′′ | 4506 |
| GHO1600+412 | 0.3 | 7.4′ 7.4′ | 6′′ | 4546 |
| 3C295 | 0.46 | 4.0′ 4.0′ | 3′′ | 5413 |
| 3C330 | 0.55 | 7.4′ 7.4′ | 6′′ | 4536 |
| CL0016+1609 | 0.55 | 5.6′ 5.6′ | 6′′ | 4476 |
| J1888.16CL | 0.56 | 5.6′ 5.6′ | 6′′ | 4506 |
| CL1322+3029 | 0.7 | 2.2′ 2.2′ | 3′′ | 5373 |
| GHO1322+3027 | 0.75 | 4.0′ 4.0′ | 6′′ | 2732 |
| GHO1603+4313 | 0.895 | 2.2′ 2.2′ | 3′′ | 5373 |
| CL1603+4329 | 0.92 | 4.0′ 4.0′ | 6′′ | 2732 |
| CL1415+5244 | … | Failed | … | … |
| Cluster | z | Band | Field of | Pix. | Time |
|---|---|---|---|---|---|
| Name | View | FoV | (sec) | ||
| 3C330 | 0.55 | LW3 | 15.23.3′ | 6′′ | 20584 |
| J1888.16CL | 0.56 | LW2 | 13.73.35′ | 6′′ | 20967 |
| J1888.16CL | 0.56 | LW3 | 15.23.3′ | 6′′ | 20624 |
| GHO1603+4313 | 0.895 | LW2 | 13.73.35′ | 6′′ | 20967 |
| GHO1603+4313 | 0.895 | LW3 | 15.23.3′ | 6′′ | 20604 |
3. IR EMISSION IN ISOCAM FILTERS
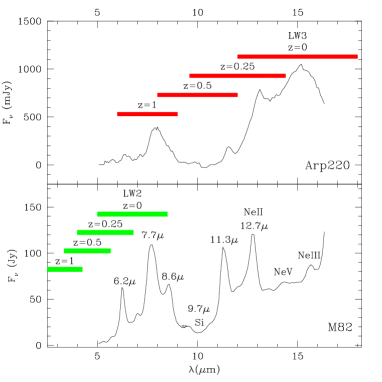
The part of the galaxy spectrum seen by each ISOCAM filter is a function of the redshift (K correction).
The galaxy spectrum is the sum of three different components: UIBs, warm dust and forbidden lines of ionized gas. In the case of nearby clusters, the LW3 band is centered on the warm dust emission and the LW2 band is dominated by the contribution of the UIBs.
When we consider distant clusters (), the LW3 band is more and more contaminated by the UIBs, while in the LW2 band the contribution of the stellar continuum, especially from old population stars, overtakes the UIB features (see Fig. 2).
4. DISCUSSION
We detect a spatial segregation in the distribution of ISOCAM sources.
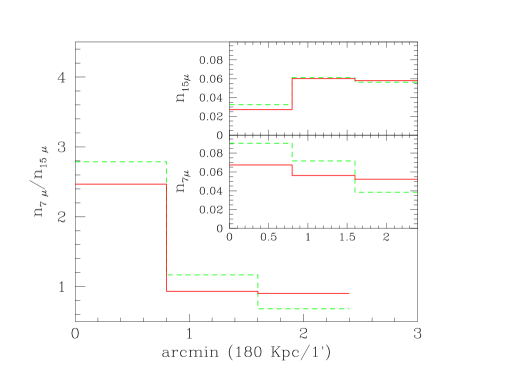
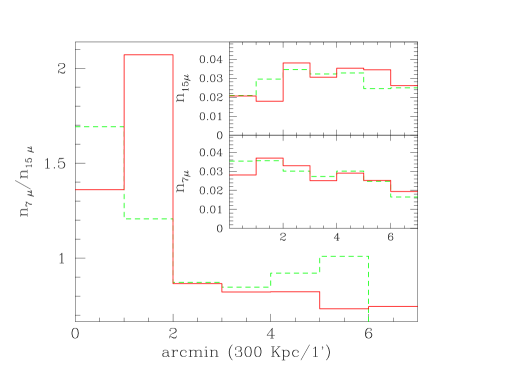
In the A1689 field (Fig. 1) we can remark an overdensity of LW2 sources in the cluster center, while LW3 sources seem to avoid the central region. There are more detections associated to the dust (LW3 band) in the outskirts than in the central region, likely because galaxies which are far from the cluster center are generally more active than central galaxies (see Fig. 3).
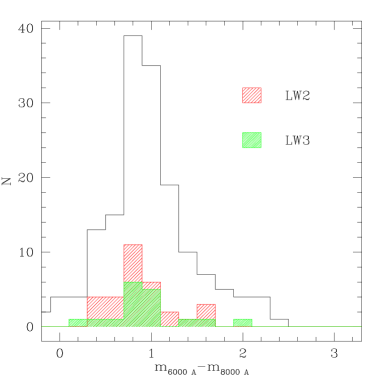
If we compare the distribution of colors for the galaxies (Gudehus & Hegyi 1991) with the analogous distributions for galaxies detected in the two bands (Fig. 4), we note that these distributions do not differ significatively, as in the case of ISOCAM observations of the Hubble Deep Field (Aussel et al. 1998). This shows that the activity unveiled by the mid-infrared images is hidden in the optical, corroborating the observation of the Antennae galaxy by Mirabel et al. (1998).
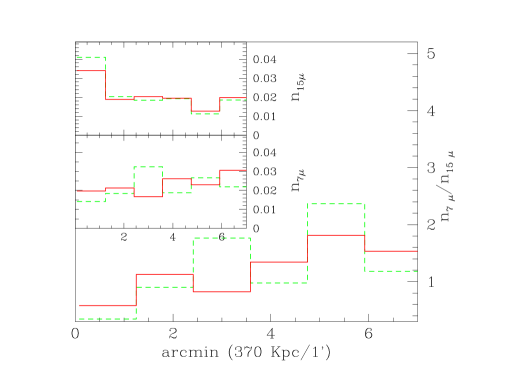
The segregation effect is more clearly visible in the cluster J1888.16CL at a redshidft of 0.5 (Fig. 5). This effect could be due to a more intense activity of galaxies or to a favored detection of arclets at 15 m as in the case of A2390 (Altieri & al, 98). For the cluster GHO 1603+4313 at we find an uniform distribution for the LW2 band and an overdensity of galaxies at the cluster center for the LW3 band (Fig. 6). This is consistent with previous cases, since LW3 at corresponds to LW2 band at rest (), due to k-correction, but may be also associated to a stronger star formation activity at higher .
ACKNOWLEDGMENTS
We thank H. Aussel for his helpful advises.
The ISOCAM data presented in this paper was analyzed using ”CIA”,
a joint development by the ESA Astrophysics Division and the ISOCAM
Consortium led by the ISOCAM PI, C. Cesarsky, Direction des Sciences de la
Matiere, C.E.A., France.
References
- \astronciteAltieri et al.1998 Altieri, B., Metcalfe, L., Kneib, J.P., & Mc Breen, B. 1998,”NGST” - 34 th Liege Astrophysics Colloquium, eds. Benvenuti, P. et al, ESA Publication, SP-431 (astro-ph 9808131)
- \astronciteAussel et al.1998 Aussel, H., Cesarsky, C., Elbaz, D. & Starck, J.L. 1998, A&A, accepted (astro-ph/9810044)
- \astronciteButcher & Oemler1984 Butcher, H. & Oemler, A. 1984, Apj, 285, 426
- \astronciteCharmandaris et al.1998 Charmandaris, V. et al., 1998, in preparation
- \astronciteDressler1980 Dressler, A. 1980, Apj,236, 351
- \astronciteDressler et al.1997 Dressler, A. et al. 1997, Apj, 450, 591
- \astronciteElbaz et al.1998 Elbaz, D. et al. 1998, “NGST” 34th Liege Astrophysics Colloquium,eds. Benvenuti, P. et al, ESA Pub. (astro-ph 9807209)
- \astronciteGudehus & Hegyi1991 Gudehus, D. H., & Hegyi, D., J. 1991, AJ, 101, 18
- \astronciteMirabel et al.1998 Mirabel, F. et al., 1998, A&A, 333, L1
- \astronciteStarck et al.1998 Starck, J.-L. et al. 1998, “Extragalactic Astronomy in the Infrared”, 1997, G.A.Mamon et al. eds.
- \astronciteTran1998 Tran, D., 1998, Ph.D. Thesis