The Stellar Populations of Low Surface Brightness Galaxies
Abstract
Near-infrared (NIR) images of a sample of five low surface brightness disc galaxies (LSBGs) were combined with optical data, with the aim of constraining their star formation histories. Both red and blue LSBGs were imaged to enable comparison of their stellar populations. For both types of galaxy strong colour gradients were found, consistent with mean stellar age gradients. Very low stellar metallicities were ruled out on the basis of metallicity-sensitive optical-NIR colours. These five galaxies suggest that red and blue LSBGs have very different star formation histories and represent two independent routes to low band surface brightness. Blue LSBGs are well described by models with low, roughly constant star formation rates, whereas red LSBGs are better described by a ‘faded disc’ scenario.
keywords:
galaxies: general – galaxies: evolution – galaxies: photometry1 Introduction
Low surface brightness disc galaxies (LSBGs; galaxies with band central surface brightnesses fainter than 22.5 mag arcsec-2) may comprise up to of the local galaxy population [1995]. Yet, due to their faintness compared to the night sky, they have remained largely overlooked in most local galaxy surveys. Recently, the compilation of galaxy catalogues specially designed to detect LSBGs (Schombert & Bothun 1988; Impey et al. 1996; O’Neil, Bothun & Cornell 1997a) has allowed systematic study of their properties. Despite this, many aspects of their formation and evolution remain poorly understood. In particular, there is considerable uncertainty regarding their star formation history (SFH).
The most widely studied LSBGs are blue [1994, 1995], indicating a young mean stellar age and/or low metallicity (note that this may be a selection effect, as most LSBG samples are selected from blue photographic survey plates). Their measured H ii region metallicities are low at around or below solar abundance [1994, 1995, 1998a]. Morphologically, the best studied LSBGs appear to have discs, but little spiral structure [1995]. The massive star formation rates (SFRs) in LSBGs are an order of magnitude lower than those of high surface brightness (HSB) galaxies [1993]. H i observations show that LSBGs have large gas mass fractions, sometimes even approaching unity [1996, 1997]. As yet, there have been no CO detections of LSBGs, only upper limits on the CO abundances which indicate that LSBGs have CO/H i ratios significantly lower than those of HSB galaxies [1990, 1998b]. All of the above strongly suggests that blue LSBGs are relatively unevolved, low mass surface density, low metallicity systems, with roughly constant or even increasing SFRs [1998].
However, recent work has demonstrated the existence of a red population of LSBGs, with both central and outer optical colours compatible with those seen in old stellar populations [1997a, 1997b]. In this letter, we explore the differences between a sample of five LSBGs (three blue and two red) taken from a larger ongoing study (note that we do not consider giant LSBGs, such as Malin 1, in this study). Because of the age/metallicity degeneracy inherent in optical broad-band colours, it is impossible to tell from the optical data alone exactly how the red LSBGs differ from their blue counterparts, and what drives their optical colour gradients [1995]. NIR images, in conjunction with optical data, offer the first chance to break this degeneracy, and constrain plausible SFHs.
2 Observations and data reduction
Our sample is taken from de Blok et al. [1996] (F561-1, F563-V2 and F568-3) and O’Neil et al. [1997a] (C3-2 and N10-2) and is selected to have estimated mag arcsec-2 and R arcsec where denotes the B band intrinsic disc central surface brightness, and R25 denotes the major axis radius to the 25 B mag arcsec-2 isophote. Our sample is by no means complete, but instead is meant to explore the range of disc LSBG star formation histories. Distances to the red LSBGs are unknown, however it is highly likely that they are in the range 3000–8000 kms-1 [1997a]. Our comparison of the SFHs of red and blue LSBGs in section 4.2 is strengthened if the red and blue LSBGs have similar physical sizes, however even redshifts outside the above range will not significantly affect our conclusions.
NIR (1.94–2.29m) passband images of these galaxies were obtained in 1997 March 21 and 22, and 1998 May 5 using the Apache Point Observatory 3.5-m telescope. Total on-source exposure times range from 16 minutes to 25 minutes. Each observing sequence consisted of two sets of six 9.8 second exposures on the object, bracketed on each side by a set of six 9.8 second sky exposures. The data were dark subtracted and flat fielded using a median combination of a given night’s sky frames. Both the dark subtraction and flat fielding are accurate over large spatial scales to better than per cent of the sky level. Sky subtraction was performed using the weighted mean of the two nearest sky frames. The images were then registered using bright stars to determine the offsets between frames, and the frames mosaiced. Edges were visible after mosaicing, thus a tip-tilt component was fit to the sky background around the galaxy, and the fit subtracted. The addition of a tip-tilt component will not affect the photometry of the galaxy in any individual frame. The final images, formed in this way, have residual background fluctuations of the order of 0.03 per cent of the original sky level. Calibration was achieved using a number of standard stars taken from Casali and Hawarden [1992] at a similar range of airmasses to our object frames, and is typically accurate to mag. Data for C3-2, taken on 1997 March 22, were taken during non-photometric conditions and were calibrated to an accuracy of 0.05 mag during service time at the United Kingdom Infrared Telescope.
Calibrated optical images in many of the required passbands were kindly provided by Erwin de Blok for F561-1 and F568-3, Stacy McGaugh for F563-V2 and Karen O’Neil for C3-2 and N10-2. Additional band images of C3-2 and N10-2 and and band images of F563-V2 were obtained on 1997 November 19 using the Isaac Newton 2.5-m Telescope as part of its service programme. Exposure times were 8 minutes in each passband. The data were overscan corrected, bias subtracted and flat fielded using sky flats. The overscan correction and bias subtraction were accurate to better than 0.1 per cent of the sky background. Flat fielding accuracy is the limiting factor in the depth of the optical surface photometry: large-scale variations of per cent of the sky background are observed and these uncertainties are propagated into the error budget in the subsequent analysis. Calibration was achieved using one standard field at a similar airmass from Landolt [1992]. This calibration is accurate to mag in all passbands.
3 Results
Surface photometry was carried out using the IRAF task ellipse. The centroid of the brightest region of the galaxy in band was used as the galaxy centre. The galaxy ellipticity and position angle were determined from the band outermost isophotes. Estimation of the sky level used the outermost regions of the surface photometry and the mean sky level in areas in the image that were free of extended galaxy emission and contamination from starlight. Due to the low surface brightness of our sample in all passbands, the error in the sky level dominates the uncertainty in the photometry (this was also demonstrated using more realistic Monte Carlo simulations, including the effects of seeing uncertainty, sky level errors and shot noise). This sky level, averaged over large areas, is typically accurate to a few parts in 105 for the images, and better than per cent for the optical images. Galactic extinction corrections are from Schlegel, Finkbeiner & Davis [1998], and range between 0.07 and 0.20 mag in the band. Galactic extinction corrected galaxy colours in three radial bins (, and where is the band disc scale length) using images degraded to the same angular resolution are shown in Fig. 1.
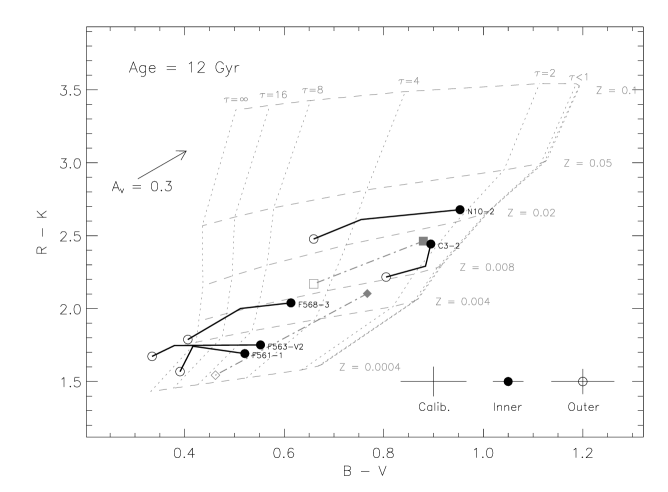
It is clear that there are colour gradients in our sample of LSBGs. However, in order to interpret the colour gradients, it is necessary to compare the data with the results of stellar population synthesis codes, such as the GISSEL96 implementation of Bruzual & Charlot (in preparation). In Fig. 1, we use single metallicity stellar populations with a Salpeter [1955] IMF and an exponentially decreasing star formation rate characterised by an e-folding timescale . The dashed lines represent the colours of stellar populations with a fixed metallicity and a range of star-forming timescales from an instantaneous burst to a constant SFR. The dotted lines represent the colours produced with a given star formation timescale and a range of metallicities. The arrow denotes the dust reddening vector given by a screen model using the extinction curve of Rieke & Lebofsky [1985] for a visual extinction of 0.3 mag. It should be noted that there is some uncertainty in the placement of the model grid. Charlot, Worthey & Bressan [1996] discussed the sources of error in stellar population synthesis models, and concluded that the uncertainty in model calibration is about 0.06 mag in colour, and around 0.12 mag in colour, which is comparable to the calibration error bar in Fig. 1.
The observed colour gradients are consistent with a mean stellar age gradient (parameterised by the exponential star forming timescale ), along with an expected contribution from metallicity effects. The colour gradients may also have a contribution from the effects of differential dust reddening: this is expected to be a small effect however and is discussed further in the next section. The existence of these colour gradients is insensitive to any zero point uncertainties, and is very robust to reasonable flat fielding and sky level uncertainties.
From the difference in optical-NIR colours between the blue and red LSBGs, the red LSBGs have considerably older mean stellar ages than blue LSBGs, indicating an epoch of more vigorous star formation. Blue LSBGs, however, do not necessarily need to be young (as we use a constant galaxy age of 12 Gyr to create the model grid), but may retain their blue colours because of a low roughly constant sporadic SFH [1998]. We address these stellar population differences further in section 4.2, where we ask if the two populations of LSBG have a common origin. It should be noted that our conclusions are unchanged if other combinations of optical-NIR colours are used.
4 Discussion
4.1 Are the stellar population differences real?
We have interpreted Fig. 1 in terms of stellar population differences, however we have so far neglected the effects of differential dust reddening. The difference between the red and blue LSBGs is consistent with our assumed form of dust reddening if , however this seems unlikely due to the large amount of smoothly distributed internal reddening required, the reasonably smooth morphologies of the red LSBGs, and the non-detection of either of the red LSBGs in both the IRAS point source and small scale structure catalogues. Also, the observed colour gradients could be consistent with the effects of a gradient in dust abundance in the LSBGs, with a central extinction of and little or no dust at 2 disc scale-lengths. This is by no means an implausible amount of dust for a late type galaxy [1992, 1997], however, there is evidence that LSBGs have less dust than HSB late type galaxies, namely the lack of strong dust features in optical LSB galaxy images [1994, 1995], the lack of detectable CO fluxes [1990, 1998b], and generally low ( mag) Balmer decrements towards LSBG H ii regions [1994]. Also, the dust reddening vector shown in Fig. 1 was made using the unphysical assumption of a foreground screen dust distribution. More realistic modelling of the effects of dust when mixed in with the stellar population results in ‘steeper’ dust reddening vectors [1996]. However, these more realistic dust reddening vectors are relatively ill-constrained as the star/dust geometry, albedo (especially NIR) of the dust particles and scattering phase function are all uncertain. Nevertheless, the colour gradients are likely to be inconsistent with large amounts of dust reddening when more realistic models are used.
Uncertainties in the high mass end of the IMF do not alter these conclusions. For example, use of a Scalo [1986] or Miller & Scalo [1979] IMF changes only the high metallicity, large end of the grid. While this could change the absolute interpretation of colour gradients in terms of values of metallicity and , it is still possible to spot relative metallicity and age trends in and between galaxies, and remain largely unaffected by this uncertainty. Note, however, that large changes in the IMF could significantly affect our relative age estimates. For example, explanation of the optical-NIR colours of the red LSBGs in terms of an IMF heavily biased towards the formation of low mass stars is possible, as the optical-NIR colours in essence indicate that red LSBGs simply lack high mass stars. In this case, the age of the red LSBGs would be much more difficult to constrain.
4.2 Do red and blue LSBGs share common ancestors?
Fig. 1 suggests that the red LSBGs have undergone a period of more vigorous star formation (both from the dominance of the older stellar populations, and from the inferred stellar metallicities), whereas blue LSBGs are well described by stellar populations with ongoing solar metallicity star formation. However, is it possible that the red and blue LSBGs share the same origin: that is, can red and blue LSBGs transform from one into the other readily? In Fig. 2, we address this question.
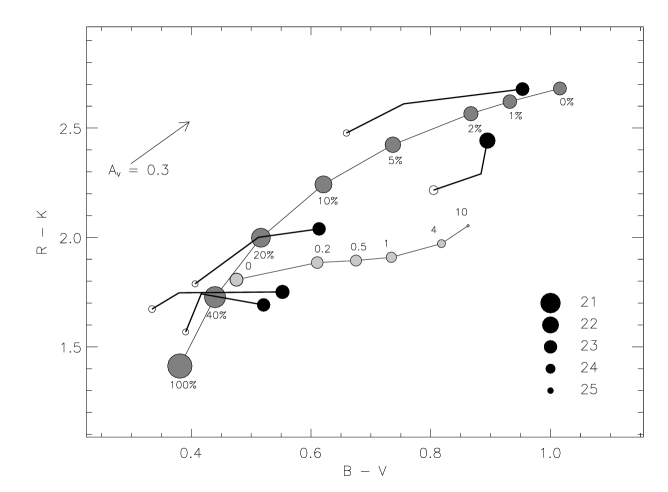
Our red LSBGs, using the models of Bruzual & Charlot (in preparation), have the optical-NIR colours of an old stellar population with roughly solar metallicity. If one adds 20 to 30 per cent, by mass, of a young Gyr stellar population with low metallicity it is possible to reproduce the colours of the blue LSBGs. However, the addition of young stars at all radii (to reproduce the colour of blue LSBGs at all radii) will increase the blue surface brightness by mag, giving central surface brightnesses of mag arcsec-2 for these ‘transformed’ red LSBGs. Thus, it is impossible to transform a red LSBG into a blue LSBG due to surface brightness constraints.
Alternatively, to transform a blue LSBG into a red one, the SFH must be truncated. Truncation of star formation will cause the optical colours to redden (note however that the stellar metallicity would still appear lower than those observed in our red LSBG: see Fig. 2) at the expense of surface brightness (dimming of mag in , and mag in is expected after 4 Gyr, when compared to a similar galaxy at the time of truncation which is still forming stars with Gyr). Thus, it is clear that the blue LSBGs cannot reproduce our sample of red LSBGs not only because of metallicity constraints, but also because the surface brightness would be too faint. Fading from a roughly solar metallicity HSB galaxy to a red LSBG may be possible: measuring the H i gas fractions of red LSBGs would test this idea, as significant fading is unlikely in gas-rich galaxies.
The stellar metallicities implied by the optical-NIR colours are consistent with those inferred from the optical colours alone, galaxy type and H ii region metallicity (where available). Comparison of the blue LSBGs with the sample of de Jong [1996] indicates stellar metallicities similar to many Sdm galaxies. The implied stellar metallicities are comparable to those seen in blue LSBG H ii regions [1994, 1995, 1998a]. In addition, the red LSBGs have roughly solar inferred stellar metallicities, which are compatible with the Sa galaxies in de Jong [1996].
Padoan, Jiminez & Antonuccio-Delogu [1997] proposed that the blue optical colours of blue LSBGs were due to very low stellar metallicity (), old single burst stellar populations. By inspection of Fig. 1, it is clear that the optical-NIR colours of blue LSBGs imply stellar metallicities typically a factor of 20 larger than those required to fit their optical colours with an old, single burst stellar population. This higher metallicity necessarily implies more recent star formation to make the stellar colours bluer, therefore necessitating younger mean stellar ages. However, it should be stressed that blue LSBGs need not be young, but they must have substantial recent star formation. As stated in Padoan et al. [1997] and borne out by our own tests, this conclusion is robust to changes in the stellar IMF and the details of the overall star formation history.
5 Conclusions
As part of an ongoing study, we have obtained images of five red and blue LSBGs. With the addition of optical , and images, we found the following.
-
•
Optical-NIR radial colour gradients are present in red and blue LSBGs, consistent with mean stellar age gradients, with the outer regions of LSBGs being younger than the central regions.
-
•
Very low stellar metallicities are ruled out for these galaxies, which is inconsistent with the SFH proposed by Padoan et al. [1997].
-
•
Red LSBGs have the optical-NIR colours of passively-evolving roughly solar metallicity stellar populations. In contrast, blue LSBGs are still actively forming stars, albeit at a low overall rate.
-
•
These results suggest that red and blue LSBGs are two different types of galaxy, and represent two independent routes to low band surface brightness: the blue LSBGs are well described by models with a low, roughly constant SFRs, whereas the red LSBGs are more consistent with a ‘faded HSB disc’ scenario.
Acknowledgements
We would like to thank Erwin de Blok, Karen O’Neil and Stacy McGaugh for providing surface photometry and images of galaxies in their sample, and for helpful discussions. In particular, we would like to thank Karen O’Neil for providing the coordinates of her LSBG sample before their publication. We would also like to thank the referee for useful comments on the manuscript. EFB would like to thank the Isle of Man Education Department for their generous support. Support for RSdJ was provided by NASA through Hubble Fellowship grant #HF-01106.01-98A from the Space Telescope Science Institute, which is operated by the Association of Universities for Research in Astronomy, Inc., under NASA contract NAS5-26555. We also thank the U. Chicago TAC for regular time allocations to make the observations. Some of the observations described in this letter were made during service time at the Isaac Newton Telescope and at the United Kingdom Infrared Telescope. This project made use of STARLINK facilities in Durham.
References
- [1997] Berlind A. A., Quillen A. C., Pogge R. W., Sellgren K., 1997, AJ, 114, 107
- [1992] Casali M. M., Hawarden T. G., 1992, JCMT-UKIRT Newsletter, 3, 33
- [1996] Charlot S., Worthey G., Bressan A., 1996, ApJ, 457, 625
- [1998a] de Blok W. J. G., van der Hulst J. M., 1998a, A&A, 335, 421
- [1998b] de Blok W. J. G., van der Hulst J. M., 1998b, A&A, 336, 49
- [1996] de Blok W. J. G., McGaugh S. S., van der Hulst J. M., 1996, MNRAS, 283, 18
- [1995] de Blok W. J. G., van der Hulst J. M., Bothun G. D., 1995, MNRAS, 274, 235
- [1996] de Jong R. S., 1996, A&A, 313, 377
- [1998] Gerritsen, J. P. E., de Blok, W. J. G., 1998, A&A accepted
- [1996] Impey C. D., Sprayberry D., Irwin M. J., Bothun G. D., 1996, ApJS, 105, 209
- [1992] Landolt A. U., 1992, AJ, 104, 372
- [1994] McGaugh S. S., 1994, ApJ, 426, 135
- [1994] McGaugh S. S., Bothun G. D., 1994, AJ, 107, 530
- [1995] McGaugh S. S., Bothun G. D., Schombert J. M., 1995, AJ, 110, 573
- [1995] McGaugh S. S., Schombert J. M., Bothun G. D., 1995, AJ, 109, 2019
- [1997] McGaugh S. S., de Blok W. J. G., 1997, ApJ, 481, 689
- [1979] Miller G. E., Scalo J. M., 1979, ApJS, 41, 513
- [1997a] O’Neil K., Bothun G. D., Cornell M.E., 1997a, AJ, 113, 1212
- [1997b] O’Neil K., Bothun G. D., Schombert J. M., Cornell M. E., Impey C. D., 1997b, AJ, 114, 2448
- [1997] Padoan P., Jiminez R., Antonuccio-Delogu V., 1997, ApJ, 481, L27
- [1985] Rieke G. H., Lebofsky M. J., 1985, ApJ, 288, 618
- [1995] Rönnback J., Bergvall N., 1995, A&A, 302, 353
- [1955] Salpeter E. E., 1955, ApJ, 121, 61
- [1986] Scalo J. M., 1986, Fundam. Cosmic Phys., 11, 1
- [1998] Schlegel D. J., Finkbeiner D. P., Davis M., 1998, ApJ, 500, 525
- [1988] Schombert J. M., Bothun G. D., 1988, AJ, 95, 1389
- [1990] Schombert J. M., Bothun G. D., Impey C. D., Mundy L. G., 1990, AJ, 100, 1523
- [1993] van der Hulst J. M., Skillman E. D., Smith T. R., Bothun G. D., McGaugh S. S., de Blok W. J. G., 1993, AJ, 106, 548
- [1992] White III R. E., Keel W. C., 1992, Nat, 359, 129