The Stellar Kinematic Fields of NGC 3379111Observations reported in this paper were obtained at the Multiple Mirror Telescope Observatory, a joint facility of the University of Arizona and the Smithsonian Institution.
Abstract
We have measured the stellar kinematic profiles of NGC 3379 along four position angles, using absorption lines in spectra obtained with the Multiple Mirror Telescope. We derive a far more detailed description of the kinematic fields through the main body of the galaxy than could be obtained from previous work. Our data extend from the center, at essentially seeing-limited resolution out to . The derived mean velocities and dispersions have total errors (internal and systematic) better than , and frequently better than , out to . We find very weak () rotation on the minor axis interior to , and no detectable rotation above from to or above out to (95% confidence limits). However, a Fourier reconstruction of the mean velocity field from all 4 sampled PAs does indicate a twist of the kinematic major axis, in the direction opposite to the known isophotal twist. The and parameters are found to be generally small over the entire observed region. The azimuthally-averaged dispersion profile joins smoothly at large radii with the velocity dispersions of planetary nebulae. Unexpectedly, we find bends in the major-axis rotation curve, also visible (though less pronounced) on the diagonal position angles. The outermost bend closely coincides in position with other sharp kinematic features: an abrupt flattening of the dispersion profile, and local peaks in and . All of these features are in a photometrically interesting region where the surface brightness profile departs significantly from an law. Features such as these are not generally known in ellipticals owing to a lack of data at comparable resolution. Very similar behavior, however, is seen the kinematics of the edge-on S0 NGC 3115. We discuss the suggestion that NGC 3379 could be a misclassified S0; preliminary results from dynamical modeling indicate that it may be a flattened, weakly triaxial system seen in an orientation that makes it appear round.
keywords:
galaxies: elliptical and lenticular, cD—galaxies: individual (NGC 3379)—galaxies: kinematics and dynamics—galaxies: structureTo appear in The Astronomical Journal, 1999 February
1 Introduction
After M87 and Centaurus A, NGC 3379 (M105) is one of the best-studied elliptical galaxies in the sky. Virtually a walking advertisement for the law (de Vaucouleurs & Capaccioli 1979), this system is regularly used as a control object or calibrator for a variety of photometric and spectroscopic studies. NGC 3379 has all the hallmarks of a “classic” early-type galaxy: almost perfectly elliptical isophotes and colors characteristic of an old stellar population (Peletier et al. 1990, Goudfrooij et al. 1994); slow rotation about the apparent minor axis (Davies & Illingworth 1983, Davies & Birkinshaw 1988); no shells, tails, or other signs of interactions (Schweizer & Seitzer 1992); no detection in either H 1 (Bregman, Hogg, & Roberts 1992) or CO (Sofue & Wakamatsu 1993); very modest H+[N 2] emission (Macchetto et al. 1996); and only minimal absorption by dust in the inner (van Dokkum & Franx 1995, Michard 1998).
Yet, for all its familiarity, there are serious questions as to the true nature of our “standard elliptical.” For one, there is a nagging concern that it might not be an elliptical at all. Capaccioli and collaborators (Capaccioli 1987; Nieto, Capaccioli, & Held 1988; Capaccioli, Held, Lorenz, & Vietri 1990; Capaccioli, Vietri, Held, & Lorenz 1991, hereafter CVHL) have argued, mainly on photometric grounds, that NGC 3379 could be a misclassified S0 seen close to face-on. CVHL demonstrate that a deprojected spheroid+disk model for the edge-on S0 NGC 3115, seen face-on, would show deviations from the best-fit law very similar to the magnitude ripple-like residuals seen in NGC 3379. They propose that NGC 3379 could be a triaxial S0, since a triaxiality gradient could explain the observed isophotal twist.
Statler (1994) has also examined the shape of NGC 3379, using dynamical models to fit surface photometry (Peletier et al. 1990) and multi-position-angle velocity data (Davies & Birkinshaw 1988, Franx, Illingworth, & Heckman 1989). The data are found to rule out very flattened, highly triaxial shapes such as that suggested by CVHL, while still being consistent with either flattened axisymmetric or rounder triaxial figures. The results are limited, however, by the accuracy of the kinematic data, which are unable to constrain the rotation on the minor axis beyond to any better than of the peak major-axis velocity. This large an uncertainty implies a ambiguity in the position of the apparent rotation axis. Moreover, there are hints of steeply increasing minor-axis rotation beyond . It is far from clear from the current data that the common perception of NGC 3379 as a “classic major-axis rotator” is an accurate description of the galaxy beyond—or even at—one effective radius.
Deeper, higher accuracy spectroscopic data are needed, both to define more precisely the kinematic structure of the galaxy at moderate radii, and also to establish the connection with the large- kinematics as determined from planetary nebulae. Ciardullo et al. (1993) find that the velocity dispersion in the PN population declines steadily with radius, reaching at (roughly 3 effective radii). This decline is consistent with a Keplerian falloff outside , apparently making NGC 3379 one of the strongest cases for an elliptical galaxy with a constant mass-to-light ratio and no significant contribution from dark matter inside . On the other hand, if the PNe were in a nearly face-on disk, the line-of-sight dispersion may not reflect the true dynamical support of the system. To correctly interpret the PN data, therefore, one needs to know how the stellar data join onto the PN dispersion profile, as well as have a good model for the shape and orientation of the galaxy.
At small , HST imaging shows NGC 3379 to be a “core galaxy”; i.e., its surface brightness profile turns over near – to an inner logarithmic slope of about (Byun et al. 1996). A non-parametric deprojection assuming spherical symmetry (Gebhardt et al. 1996) gives a logarithmic slope in the volume luminosity density of at (). This is rather a shallow slope for galaxies of this luminosity (), and is actually more characteristic of galaxies some 4 times as luminous (Gebhardt et al. 1996). At the same time, NGC 3379 is a likely candidate for harboring a central dark mass of several hundred million (Magorrian et al. 1998). Since both density cusps and central point masses have been implicated as potential saboteurs of triaxiality through orbital chaos (Merritt & Fridman 1996, Merritt & Valluri 1996, Merritt 1997), a measurement of triaxiality from the stellar kinematics would be valuable in gauging the importance of this mechanism in real systems.
Here we present new spectroscopic observations of NGC 3379, as part of our program to obtain multi-position-angle kinematic data at high accuracy and good spatial resolution for a sample of photometrically well-studied ellipticals. We obtain a far more detailed rendition of the kinematic fields through the main body of the galaxy than has been available from previous data. We find that these fields suggest a two-component structure for the galaxy, and closely resemble those of the S0 NGC 3115. We reserve firm conclusions on the shape and Hubble type of NGC 3379 for a later paper devoted to dynamical modeling; here we present the data. Section 2 of this paper describes the observational procedure. Data reduction techniques are detailed in Sec. 3, and the results are presented in Sec. 4. We compare our data with previous work and discuss some of the implications for the structure of the galaxy in Sec. 5, and Sec. 6 concludes.
2 Observations
NGC 3379 was observed with the Multiple Mirror Telescope and the Red Channel Spectrograph (Schmidt et al. 1989) on 3–4 February 1995 UT. The slit was used with the 1200 grooves/mm grating to give a resolution of approximately and a spectral coverage from – . The spectra were imaged on the Loral CCD ( pixels, 1 pix = , read noise = 7 ), resulting in a nominal dispersion of /pix. The CCD was read-binned pixels in the dispersion spatial directions to reduce read noise, so that the final spatial scale was per binned pixel.
Except for a brief period of fluctuating seeing on the first night, all data were taken in photometric conditions. NGC 3379 was observed at four slit position angles: PA = (major axis), (minor axis), , and . PA 340 was observed entirely on night 1, PAs 70 and 115 on night 2, and PA 25 over both nights. Four exposures of 1800 s each were obtained at each PA, except for the last exposure at PA 70 which was shortened to 900 s due to impending twilight. Because the galaxy filled the slit, separate 600 s blank sky exposures were obtained at 30 – 90 minute intervals depending on the elevation of the galaxy. Comparison arc spectra were taken before and/or after each galaxy and sky exposure.
In addition to the standard calibration frames, spectra of radial velocity standard, flux standard, and Lick/IDS library stars were taken during twilight. The Lick stars were chosen to have a range of spectral types and metallicities in order to create composite spectral templates and to calibrate measurements of line strength indices (to be presented in a future paper). Stars were trailed across the slit to illuminate it uniformly. This was an essential step in producing accurate kinematic profiles because our slit width was wider than the seeing disk; fits to the spatial profiles of all stellar spectra give a mean Gaussian width of the point spread function of , with a standard deviation of .
3 Data Reduction
3.1 Initial Procedures
Basic reductions were performed as described by Statler, Smecker-Hane, & Cecil (1996, hereafter SSC), using standard procedures in IRAF. The initial processing consisted of overscan and bias corrections, flat fielding, and removal of cosmic rays. This was followed by wavelength calibration from the comparison arcs, and straightening of all spectra using stellar traces at different positions along the slit. We used “unweighted extraction” to derive one-dimensional stellar spectra, and rebinned all spectra onto a logarithmic wavelength scale with pixel width (). In the same transformation, the galaxy frames for each PA were registered spatially.
Time-weighted average sky spectra were created for each galaxy frame by combining the two sky frames, and , taken before and after the galaxy frame . (Times refer to the middle of the exposures.) The combined sky image was , where and the constant ( for all frames but one) scaled the image to the exposure time of . Because conditions were photometric, there was no need to fine-tune and by hand, as was done by SSC to improve the removal of the bright sky emission lines. To avoid degrading the signal-to-noise ratio in the regions where accurate sky subtraction was most crucial, the sky spectra were averaged in the spatial direction by smoothing with a variable-width boxcar window. The width of the window increased from 1 pixel at the center of the galaxy to 15 pixels at the slit ends. Finally, after subtracting the smoothed sky images, the 4 galaxy frames at each PA were coadded.
In parallel with the above procedure, we performed an alternative sky subtraction in order to estimate the systematic error associated with this part of the reduction. In the alternative method we simply subtracted the sky exposure closest in time to each galaxy frame, scaled up to the appropriate exposure time and boxcar-smoothed. These “naive sky” results will be discussed in Sec. 3.4 below.
SSC worried extensively about the effect of scattered light on the derived kinematics at large radii. Using their 2-D stellar spectra, they constructed an approximate smoothed model of the scattered light contribution and subtracted it from their coadded spectra of NGC 1700. We have not attempted to do this here, for three reasons. First, we found that the scattered light characteristics of the Red Channel had changed significantly from 1993 to 1995, and could no longer be modeled simply. Second, SSC had noted that the scattered-light correction resulted in only tiny changes to their kinematic profiles, and that the contribution to the systematic error budget was negligible compared to those from sky subtraction and template mismatch. Finally, NGC 3379 is much less centrally concentrated than NGC 1700, and therefore is much less prone to scattered-light contamination since the galaxy is still fairly bright even at the ends of the slit.
The 2-D galaxy spectra were binned into 1-D spectra with the bin width chosen to preserve a signal-to-noise ratio per pixel over most of the slit length; decreases to around in the second-to-outermost bins, and to in the last bins, which terminate at the end of the slit. These last bins also suffer a slight degradation in focus, so that the velocity dispersion is likely to be overestimated there. The 1-D spectra were divided by smooth continua fitted using moderate-order cubic splines. Residual uncleaned cosmic rays and imperfectly subtracted sky lines were replaced with linear interpolations plus Gaussian noise. Spectra were tapered over the last 64 pixels at either end and padded out to a length of 1300 pixels.
The velocity zero point was set using 5 spectra of the IAU radial velocity standards HD 12029, HD 23169 (observed twice), HD 32963, and HD 114762. The spectra were shifted to zero velocity and all 10 pairs were cross-correlated as a consistency check. In only 3 cases were the derived residual shifts greater than and in no case were they greater than . The velocities of the remaining 20 stars were then found by averaging the results of cross-correlation against each of the standards, and these stars were also shifted to zero velocity.
3.2 LOSVD Extraction
Parametric extraction of the line-of-sight velocity distributions (LOSVDs) was performed using Statler’s (1995) implementation of the cross-correlation (XC) method, which follows from the relationship between the galaxy spectrum , the observed spectral template , and the “ideal template” —a zero-velocity composite spectrum of the actual mix of stars in the galaxy. This relationship is given by
| (1) |
where denotes convolution, denotes correlation, and , the broadening function, is the LOSVD written as a function of . Since the ideal template is unknown, one replaces with the template autocorrelation function , and then manipulates so that its convolution with fits the primary peak of the cross-correlation function . We adopted a Gauss-Hermite expansion for the LOSVD (van der Marel & Franx 1993):
| (2) |
The expansion was truncated at , and non-negativity of was enforced by cutting off the tails of the distribution beyond the first zeros on either side of the center. Because the XC method can be confused by broad features in the spectra unrelated to Doppler broadening, it was necessary to filter out low-frequency components before cross-correlating. Our adopted filter was zero below a threshold wavenumber (measured in inverse pixels), unity above , and joined by a cosine taper in between. More conveniently we can quote the filter width in Fourier-space pixels as a quantity . Empirically we found our results to be insensitive to over a range centered around , which value we adopted for all subsequent analysis.
A non-parametric approach also rooted in equation (1) is the Fourier Correlation Quotient method (Bender 1990), which operates in the Fourier domain. Denoting the Fourier transform by , we have
| (3) |
thus can, in principle, be obtained directly. However, the FCQ method requires that, to avoid amplifying nose, high frequency components also be filtered out of the data. This is generally done using an optimal filter, the construction of which is not an entirely objective procedure when . We present results from the FCQ method in section 4.4.
3.3 Composite Templates
Sixteen stars with spectral types between G0 and M1 were available to be used as templates. We first computed the kinematic profiles for the major axis (PA 70) using all 16 templates, then set out to choose a set of 4 from which to construct composites. We found, as did SSC, that the algebraic problem of fitting the galaxy spectrum with a set of very similar stellar spectra becomes seriously ill-conditioned with more than 4 in the library. Coefficients were calculated to optimize the fit to the galaxy spectrum, using a random search of the parameter space as described by SSC.
For the most part, kinematic profiles derived using different templates had similar shapes but with different constant offsets, in agreement with the results of SSC and others (e.g., Rix & White 1992, van der Marel et al. 1994). A few templates could be discarded for giving wildly discrepant results. In principle, a semi-objective criterion for choosing a library ought to have been available from the requirement that the profile be antisymmetric across the center of the galaxy. However, every template gave positive values of at ; we attribute this to the well-documented discordancy between Mg and Fe line strengths in ellipticals relative to population-synthesis models with solar Mg/Fe ratio (Peletier 1989, Gonzalez 1993, Davies 1996 and references therein). We therefore proceeded by trial and error, requiring that (1) weight be distributed roughly evenly among the library spectra in the derived composites; (2) the central values computed from the composites come out close to zero; (3) the values of the line strength parameter come out not very far from unity; and (4) as wide a range as possible of spectral types and metallicities be represented.
We found that acceptable composite templates could be constructed at all positions in the galaxy, consistent with the above criteria, using the following stars: HD 41636 (G9III), HD 145328 (K0III-IV), HD 132142 (K1V), and HD 10380 (K3III). We constructed a separate composite at each radius and position angle. The coefficients of the individual spectra varied, for the most part, smoothly with radius, from average central values of to roughly at large radii. The point-to-point scatter in the coefficients exceeded outside of about and beyond . However, we saw no indication of this scatter inducing any systematic effects in the kinematic results beyond those discussed in the next section.
All of the results presented in this paper use the template stars listed above; however, the analysis was also carried through using an earlier, unsatisfactory library in order to estimate the systematic error from residual template mismatch in the composites.


3.4 Systematic Errors
Formal uncertainties on the results presented in Sec. 4 below are obtained from the covariance matrix returned by the XC algorithm. But we also need to estimate the dominant systematic errors, associated with sky subtraction and template mismatch. To accomplish this, we carried out parallel reductions of the data using the “naive sky” subtraction described in Sec. 3.1, and using composite templates generated from a different set of library spectra.
Figure 1 shows the differences in the
kinematic parameters obtained using the different library spectra
for the composite templates, plotted against radius. The plotted points
give the root-mean-square differences, with the mean taken over the four
position angles. We have fitted these data by eye with the following
functions:
where and are given in
and is in arcseconds. These fits are plotted as the smooth
curves in Figure 1.
The corresponding differences between the adopted sky subtraction and
the “naive sky” approach are shown in Figure 2. Here the
analysis has been repeated only for PA 70, so there is no averaging over
position angle. The smooth curves show the fitting functions, given by
Comparison of the figures shows that template mismatch dominates
sky subtraction in the systematic error budget by more than an order
of magnitude in the bright center of the galaxy, but by only factors
of order unity at the slit ends.
The final error bars given in Table 1 and the figures represent the formal internal errors from the XC code added in quadrature with the contributions from equations (LABEL:e.systemplate) and (LABEL:e.syssky).
4 Results
4.1 Parametric Profiles
Kinematic profiles along the four sampled PAs are shown in Figure 3a–d. For each PA, we plot the Gauss-Hermite parameters , , , and , which are also listed along with their uncertainties in columns 2 – 9 of Table 1. Remember that only when are and equal to the true mean and dispersion, and ; we will recover the latter quantities in Sec. 4.2. In the plotted rotation curves, we have subtracted a systemic velocity , which has been determined from pure Gaussian fits to the broadening functions, averaging pairs of points in the resulting profiles on opposite sides of the center.


The issue of possible minor-axis rotation is settled fairly clearly by Figure 3b. PA 340 shows only very weak rotation, at about the level, inside . Doubling the radial bin size and folding about the origin to improve , we find no detectable rotation above from to or above out to (95% confidence limits). The maximum rotation speed of approximately is found on the major axis, and intermediate speeds are found on the diagonal PAs. The most striking features of the kinematic profiles, however, are the sharp bends in the major-axis rotation curve at and , and the comparably sharp inflections near in all of the profiles. These kinks are invisible in the earlier data, which have insufficient spatial resolution and kinematic accuracy to reveal them (cf. Fig. 8 below).
Careful inspection of the and profiles suggests features coincident with the kinks in and , though this is difficult to see because the Gauss-Hermite terms have proportionally larger error bars. To improve the statistics, we have combined the data in Figure 3 to create composite, azimuthally averaged radial profiles. The mean profile is scaled to the major axis amplitude by multiplying the PA 25 and PA 115 data by factors of and , respectively, before folding (antisymmetrizing) about the center and averaging; the minor axis (PA 340) data is omitted from the composite and profiles. Since we see no significant differences with PA in the and profiles, for these we simply symmetrize and average all 4 PAs with no scaling.
The resulting radial profiles are shown in Figure 4. The shapes of the and profiles are clarified, particularly the almost piecewise-linear form of the rotation curve and the sudden transition in near . We also see a small bump at in the profile. and are of opposite sign at all radii, consistent with the usual sense of skewness. The profile shows a clear positive gradient out to , where it turns over, then gradually increases again beyond about . Positive indicates an LOSVD that is more “peaky” and has longer tails than a Gaussian. The change of sign of in the inner or so should not be taken too literally, since a constant offset in is an expected artifact of template mismatch.

The clustering of interesting kinematic features in the region from to is intriguing. In order of increasing , we see a drop in the skewness of the LOSVD, an abrupt flattening in the dispersion and rotation curves, and a local maximum in the LOSVD “peakiness.” This is, moreover, a photometrically interesting region. Capaccioli et al. (1990) find residuals from the best-fitting law as large as mag; the logarithmic slope of the -band surface brightness profile peaks at . Evidently, this range of radii marks a very important transition in the galaxy.
4.2 Corrected Mean Velocities and Dispersions
For dynamical models based on the low-order moment (continuity and Jeans) equations, it is important to have the true mean and dispersion, rather than the Gauss-Hermite parameters and . We can calculate these quantities and their associated errors using equations (5)–(7) of SSC, which are based on the treatment of van der Marel & Franx (1993).
First, however, we must determine whether including the and terms actually results in a statistically significant improvement to the estimate of the moments and from the data. We found above that and are generally small, and since their error bars grow with radius, it is not obvious a priori that correcting and for these terms—and increasing the error bars accordingly—will necessarily give more robust estimates than simply assuming a Gaussian LOSVD. Therefore, we examine the distribution of chi-square values, and , obtained from, respectively, three-parameter (Gaussian) and five-parameter (Gauss-Hermite) fits to the broadening functions. We find that the differences are significant only for . For the rest of the data, the distribution is completely consistent with a chi-square distribution with the appropriate number of degrees of freedom, if our original estimates for the noise in the galaxy spectra are scaled up by a factor of . The noise in each spectrum is estimated by differencing the spectrum with a smoothed version of itself; and it is certainly believable that this procedure could underestimate the actual noise level by 17%. All of the results in this paper have been computed including this correction to the noise.
The adopted mean velocity and dispersion profiles are shown in Figure 5a–b and listed in the last 4 columns of Table 1. For , we use the results of the Gauss-Hermite fits, corrected for and . To avoid propagating the residual effects of template mismatch, we have applied a constant offset to the profile on each PA so as to shift the central value to zero. For larger radii we adopt the and values from pure-Gaussian fits. We are not saying that the LOSVD is Gaussian beyond , merely that the most reliable estimates of the mean and dispersion come from the Gaussian fit. Since the corrections are all small, the corrected rotation curves resemble the profiles in Figure 3, including the very weak minor-axis rotation, the sharp kinks in the major-axis profile, and a slightly higher rotation speed on PA 115 diagonal than on PA 25. The corrections to the dispersion flatten out the central gradient slightly and have little effect on the rest of the profiles.


4.3 Reconstructed Two-Dimensional Fields
With multiple-PA sampling, we can create Fourier reconstructions of the two-dimensional kinematic fields from the profiles in Figure 5. Our spacing lends itself to a representation of the form
| (6) |
where the coefficients are all functions of , and if we let one of our sampled PAs correspond to . An explicit expression for the reconstructed velocity field in terms of the measured velocities is given in equation (9) of SSC; the corresponding expression for the dispersion field has the same form since no particular symmetry is assumed. To reduce the noise in the 2-D fields, we interpolate and smooth the 1-D profiles using a smoothing spline (Green & Silverman 1994) before computing the reconstructions.
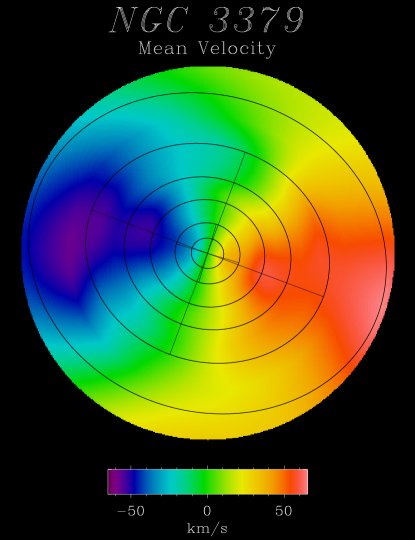
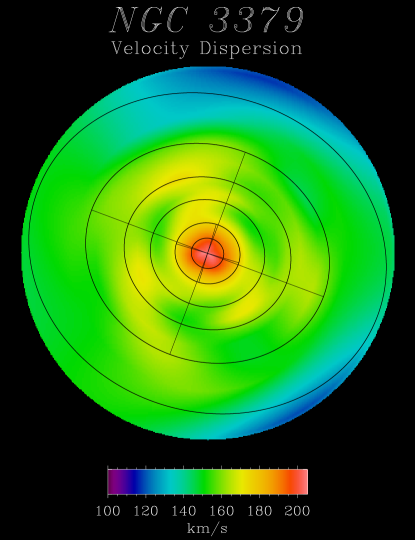
The resulting velocity and dispersion fields are shown in Figure 6a–b. The plotted region is in radius, which omits only the outermost points on each PA. Black ellipses show representative isophotes, as fitted by Peletier et al. (1990); we have drawn the principal axes for two of the isophotes to indicate the modest photometric twist in the galaxy. In Figure 6a, note the rotation of the kinematic major axis away from the photometric major axis for . This rotation is due in roughly equal measure to the isophotal twist and to a kinematic twist of the velocity field in the opposite direction. Figure 6b nicely illustrates the steep central rise in the dispersion, as well as the quite flat profile outside of The odd structure with apparent 3-fold symmetry is almost certainly not real; however, the azimuthally averaged profile does show a very weak “hump” near , which would be consistent with a ring of slightly higher dispersion at around this radius.
4.4 Non-Parametric LOSVDs
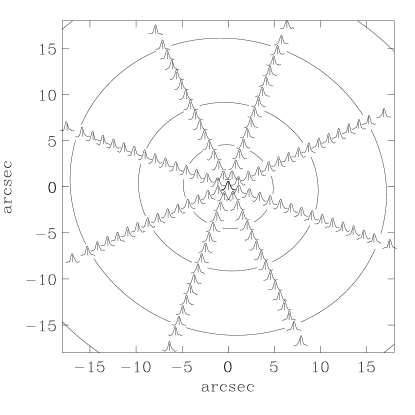
Non-Parametric LOSVDs derived by the FCQ method are plotted in Figure 7a–b, at the appropriate positions on the sky. Representative isophotes are shown for orientation; in each little profile, the vertical line marks the systemic velocity. Consistent with the results of Sec. 4.1, one can see that nowhere is the LOSVD strongly non-Gaussian. Careful inspection, however, does show a very modest skewness in the usual sense along the inner major axis, and a tendency for the LOSVD to be slightly sharper-peaked at large radii.
5 Discussion
5.1 Comparison with Previous Work
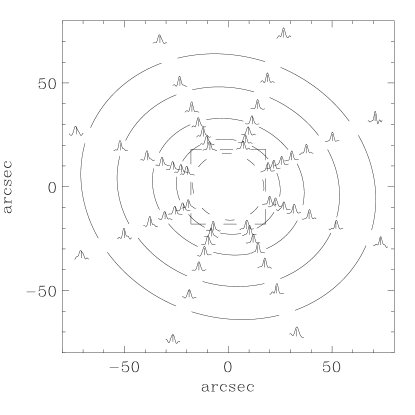
Kinematic data for NGC 3379 have been published previously by Sargent et al. (1978), Davies (1981), Davies & Illingworth (1983), Davies & Birkinshaw (1988), Franx et al. (1989), and Bender, Saglia, & Gerhard (1994). Major axis and profiles from all but the first of these studies are plotted in Figure 8. Comparison with the top two panels of Fig. 3a shows that the present data are largely consistent with the earlier results, but reveal structure that could not be seen in the earlier data. With the benefit of hindsight, one can discern a change of slope in near , but this feature is quite murky except in the Bender et al. data. A steep decline in dispersion is noted by Davies (1981), though his mean dispersion of outside of is not reproduced in the later work. Davies and Illingworth (1983) conclude that the overall gradient is consistent with constant . Their data also show a shallow hump in beyond , but at no more than significance. Bender et al. (1994) obtain a profile with a local minimum of approximately near , rising again to about at , their outermost data point. This is somewhat inconsistent with our results, though not alarmingly so. Their dispersions seem to be systematically higher than ours, which could easily be caused by their use of a single template star not matched to the galactic spectrum. They detect a sharp bend in the rotation curve at , but do not have fine enough sampling to see a second bend farther out. Bender et al. also derive and , obtaining a generally featureless profile with on the positive-velocity side, and a weak positive gradient in . This again is consistent with our results, though at significantly coarser resolution.

The minor axis velocity data from Davies & Birkinshaw (1988) and Franx et al. (1989) are compiled in Figure 4d of Statler (1994). Those data show a scatter of about a mean of , with a possible increase in rotation beyond . As discussed in Sec. 4.1, we obtain 95% confidence upper limits of for and for , with a marginal detection of rotation on PA 340 interior to .
5.2 Connection with Planetary Nebulae
Ciardullo, Jacoby, & Dejonghe (1993) have measured the radial velocities of 29 planetary nebulae in NGC 3379, at radii between and . They find no evident rotation in the PN population, but a clear signature of a negative radial gradient in the RMS velocity. Breaking their sample into 3 radial bins, they obtain the dispersion profile plotted as the large diamonds in Figure 9. To compare with these data, we compute the RMS velocity profile for the integrated starlight by computing composite radial profiles for the Hermite-corrected mean velocity and dispersion profiles, and adding them in quadrature. We make no correction to the mean velocity for any assumed inclination. The results are plotted as the squares in Figure 9. To within the errors, the profiles join smoothly. (The upward jump in our last data point is not statistically significant.) While it remains somewhat puzzling that the PNe should show no rotation, at least from the dispersion profile it would seem that they are representative of the general stellar population at smaller radii.

5.3 Implications for Dynamics and Structure
The double-humped RMS velocity profile plotted in Fig. 9 provokes a strong impression of a two-component system. At the very least, the sharp bends in the rotation curve (Fig. 4, top) indicate that there are special radii within the galaxy where abrupt—though perhaps subtle—changes in dynamical structure occur. This sort of behavior is not generally thought of as being characteristic of elliptical galaxies. But it has, in fact, been seen before in S0’s, most notably in NGC 3115. CVHL have argued that these two systems share enough photometric characteristics that they could be near twins, seen in different orientations. Here we show that they share a kinematic kinship as well.
In Figure 10 we plot the major axis rotation curve of NGC 3115 from Fisher (1997), along with that of NGC 3379 on the same linear scale. Both show a sharp inner kink from the center and an outer kink in the rough vicinity of , outside of which the rotation curve is basically flat. The similarity is striking, even though the locations of the bends do not match exactly. NGC 3115’s outer kink coincides almost exactly with a photometric bump in the major axis -band brightness profile (Capaccioli et al. 1987) evidently related to structure in the disk. The dispersion also appears to level off at about this radius (Bender et al. 1994), although the transition does not seem especially sharp.

In addition, there are similarities in the profiles. Fisher (1997) finds a bump in at around in NGC 3115, similar to the feature we see at in NGC 3379. Since they appear at rather different places relative to the kinks in the rotation curves, these small bumps may be unrelated; however, the correlation between and local hints that there may be a more subtle connection. Fisher plots against at the same projected radius for a sample of 20 S0’s, and finds that 10 show a distinctive N-shaped profile through the center. In 9 of those, changes sign in the legs of the N, reversing the usual sense of skewness. This is quite different from ellipticals (Bender et al. 1994), which tend to show only a monotonic anticorrelation (i.e., only the middle segment of the N). In NGC 3115, does not change sign more than once, but the profile turns around again past either end of the N-shaped segment. We plot the vs. profile for NGC 3115 as the dashed line in Figure 11. We have taken the antisymmetric part to reduce the noise, and plotted only the positive-velocity half, so that one sees only the right half of the N, and the outer part () where the profile turns over.

To test whether NGC 3379 might plausibly be a scaled and reoriented copy of NGC 3115, we have derived the corresponding curve for NGC 3379 from the composite radial profiles plotted in Fig. 4. We scale up by a factor of so that the central dispersion matches that of NGC 3115, and scale up by a factor of to match the maximum speed in the flat part of NGC 3115’s rotation curve. The result is plotted as the solid line in Figure 11. In terms of the scaled , the bump occurs in the same place in the two galaxies.
Does this rather arbitrary scaling of and correspond to a sensible geometry? If, for simplicity, we assume an isotropic dispersion tensor, so that the line-of-sight is (at least to lowest order) unaffected by orientation, the above scaling would require a trigonometric factor to dilute the rotation speed to the observed value. At an inclination of , an intrinsically E6 or E7 oblate galaxy would be seen to have an ellipticity of . This is a bit rounder than the actual ellipticity of NGC 3379, which increases outward from about to over the range of radii spanned by our data (Peletier et al. 1990). But the difference in apparent shape could, in principle, be made up by a small triaxiality, so this low an inclination is not entirely out of the question.
We would not go so far as to argue that the similarity in the vs. curves marks NGC 3379 as a twin of NGC 3115, or, for that matter, as an S0 at all. There is no particular theoretical reason to expect a bump in at , no dynamical model that predicts such a feature, and no indication that it is even present in most S0’s. But we can turn the argument around, and say that if it is determined by other means that NGC 3379 is a low-inclination S0, then we will have reason to ask what common aspect of the dynamical structure of these two galaxies creates similar features in in corresponding locations.
Heuristic arguments such as these, however, are no substitute for dynamical modeling, which is the only proper way to determine the true shape and dynamical structure of NGC 3379. While we leave a full treatment of this issue to a future paper, some general discussion is worthwhile. To lowest order, the mean velocity field of NGC 3379 is characteristic of an oblate axisymmetric system: the highest measured velocities are on the major axis, the minor axis rotation is near zero, and the profiles on the diagonal slit positions are nearly the same. Similarly, the closely aligned, almost exactly elliptical isophotes are just what one would expect of an axisymmetric galaxy. However, there are significant deviations, at the level, from the pure axisymmetric signature, which appear as an isophotal twist of roughly and a kinematic twist of about the same size in the opposite direction. Very approximately, the distortion to the velocity field induced by a small triaxiality is , so a kinematic twist might be characteristic of a weak triaxiality . The photometric twist, if one assumes that the true principal axes of the luminosity density surfaces are aligned, signals a triaxiality gradient; but for small , in order to observe an isophotal twist of more than a degree or two requires a line of sight for which the apparent ellipticity is small. Thus, unless NGC 3379 is intrinsically twisted, the photometric and kinematic data may well be indicating, completely independent of any arguments regarding NGC 3115, a quite flattened, weakly triaxial system seen in an orientation that makes it appear round.
6 Conclusions
We have measured the stellar kinematic profiles of NGC 3379 along four position angles using the MMT. We have obtained mean velocities and dispersions at excellent spatial resolution, with precisions better than and frequently better than out to , and at slightly lower precision farther out. The and parameters are measured over the entire slit length, and are found to be generally small. From a Fourier reconstruction of the mean velocity field, we detect a twist of the kinematic major axis, over roughly the same range of radii where the photometric major axis twists by in the opposite direction. The most surprising aspect of our results is the appearance of sharp features in the kinematic profiles. There are sharp bends in the major-axis rotation curve, visible (though less pronounced) on the diagonal position angles, which closely resemble similar bends seen in the edge-on S0 NGC 3115. Moreover, there is an abrupt flattening of the dispersion profile, as well as local peaks in and , all apparently associated with the outer rotation curve bend near , and all coinciding with a region where the surface photometry shows some of its largest departures from an law.
The sharp kinematic transitions that we see in NGC 3379 are, as far as we know, unprecedented in any elliptical galaxy. But this is much less a statement about galaxies than about data: no other elliptical has been observed at this resolution over this large a range of radii. The correspondence with kinematic features seen in NGC 3115 does not prove that NGC 3379 is an S0, since we do not know whether these features are unique to S0’s. Previously published data on NGC 3379 give the impression of a gently rising rotation curve and a featureless, smoothly falling dispersion profile. Except for the few systems identified as having kinematically distinct cores, a cursory survey of the literature gives a similar impression of most other ellipticals.
In the current standard conceptual picture, elliptical galaxies have smooth and unremarkable rotation and dispersion profiles, except for a few peculiar cases. Yet, one of the most ordinary ellipticals in the sky, when examined with high enough precision, turns out to have far richer dynamical structure than expected. We should hardly be surprised to see this sort of thing happen, though. Fifteen years ago it was also part of the standard picture that elliptical galaxies had precisely elliptical isophotes, except for a few peculiar cases. It was only after techniques had been developed to measure departures from pure ellipses at the 1% level (Lauer 1985, Jedrzejewski 1987), and after these measurements had been made for a respectable sample of objects, that the distinction between the properties of disky and boxy ellipticals (Bender et al. 1989), now regarded as fundamental, emerged. The potential of detailed kinematic studies of elliptical galaxies to further elucidate their structure and evolution remains, at this point, almost entirely unexplored.
Acknowledgements.
TSS acknowledges support from NASA Astrophysical Theory Grant NAG5-3050 and NSF CAREER grant AST-9703036. We thank the director and staff of the Multiple Mirror Telescope Observatory for their generous assistance and allocations of time to this project. Ralf Bender kindly provided additional details on his published data, and the anonymous referee helped us to improve the paper by catching a number of errors.| Mean | Disp. | |||||||||||
|---|---|---|---|---|---|---|---|---|---|---|---|---|
| Mean | Disp. | |||||||||||
|---|---|---|---|---|---|---|---|---|---|---|---|---|
| Mean | Disp. | |||||||||||
|---|---|---|---|---|---|---|---|---|---|---|---|---|
| Mean | Disp. | |||||||||||
|---|---|---|---|---|---|---|---|---|---|---|---|---|
References
- (1)
- (2) Bender, R., Surma, P., Döbereiner, S., Möllenhoff, C., & Madejsky, R. 1989, A&A, 217, 35
- (3) Bender, R. 1990, A&A, 229, 441
- (4) Bender, R., Saglia, R. P., & Gerhard, O. E. 1994, MNRAS, 269, 785
- (5) Bregman, J. N., Hogg, D. E., & Roberts, M. S. 1992, ApJ, 387, 484
- (6) Byun, Y.-I., Grillmair, C. J., Faber, S. M., Ajhar, E. A., Dressler, A., Kormendy, J., Lauer, T. R., Richstone, D., & Tremaine, S. 1996, AJ, 111, 1889
- (7) Capaccioli, M., Held, E. V., Lorenz, H., & Vietri, M. 1990, AJ, 99, 1813
- (8) Capaccioli, M., Held, E. V., & Nieto, J.-L. 1987, AJ, 94, 1519
- (9) Capaccioli, M., Vietri, M., Held, E. V., & Lorenz, H. 1991, ApJ, 371, 535 (CVHL)
- (10) Ciardullo, R., Jacoby, G. H., & Dejonghe, H. B. 1993, ApJ, 414, 454
- (11) Davies, R. L. 1981, MNRAS, 194, 879
- (12) Davies, R. L. 1996, in Fresh Views of Elliptical Galaxies, edited by A. Buzzoni, A. Renzini, & A. Serrano (ASP Conf. Series), p.175
- (13) Davies, R. L. & Birkinshaw, M. 1988, ApJS, 68, 409
- (14) Davies, R. L. & Illingworth, G. 1983, ApJ, 266, 516
- (15) de Vaucouleurs, G. & Capaccioli, M. 1979, ApJS, 40, 699
- (16) Fisher, D. 1997, AJ, 113, 950
- (17) Franx, M., Illingworth, G. D., & Heckman, T. 1989, ApJ, 344, 613
- (18) Gebhardt, K., Richstone, D., Ajhar, E. A., Lauer, T. R., Byun, Y.-I., Kormendy, J., Dressler, A., Faber, S. M., Grillmair, C., & Tremaine, S. 1996, AJ, 112, 105
- (19) González, J. J. 1993, Ph.D. thesis, Lick Observatory.
- (20) Goudfrooij, P., Hansen, L., Jørgensen, H. E., Nørgaard-Nielsen, H. U., De Jong, T., & van den Hoek, L. 1994, A&AS, 104, 179
- (21) Green, P. J. & Silverman, B. W. 1994, Nonparametric Regression and Generalized Linear Models (Chapman and Hall, London), Ch. 2
- (22) Jedrzejewski, 1987, MNRAS, 226, 747
- (23) Lauer, T. R. 1985, MNRAS, 216, 429
- (24) Macchetto, F., Pastoriza, M., Caon, N., Sparks, W. B., Giavalisco, M., Bender, R., & Capaccioli, M. 1996, A&AS, 120, 463
- (25) Magorrian, J., Tremaine, S., Richstone, D., Bender, R., Bower, G., Dressler, A., Faber, S. M., Gebhardt, K., Green, R., Grillmair, C., Kormendy, J., & Lauer, T. 1998, AJ, 115, 2285.
- (26) Merritt, D. 1997, ApJ, 486, 102
- (27) Merritt, D. & Fridman, T. 1996, ApJ, 460, 136
- (28) Merritt, D. & Valluri, M. 1996, ApJ, 471, 82
- (29) Michard, R. 1998, A&A, 334, 453
- (30) Nieto, J.-L., Capaccioli, M., & Held, E. V. 1988, A&A, 195, L1
- (31) Peletier, R. 1989, Ph.D. Thesis, Rijksuniversiteit Groningen
- (32) Peletier, R. F., Davies, R. L., Davis, L. E., Illingworth, G. D., & Cawson, M. 1990, AJ, 100, 1091
- (33) Rix, H.-W. & White, S. D. M. 1992, MNRAS, 254, 389
- (34) Sargent, W. L. W., Young, P. J., Boksenberg, A., Shortridge, K., & Hartwick, F. D. A. 1978, ApJ, 221, 731
- (35) Schmidt, G., Weymann, R., & Foltz, C. 1989, PASP, 101, 713
- (36) Schweizer, F. & Seitzer, P. 1992, AJ, 104, 1039
- (37) Sofue, Y. & Wakamatsu, K. 1993, PASJ, 45, 529
- (38) Statler, T. S. 1994, AJ, 108, 111
- (39) Statler, T. S. 1995, AJ, 109, 1371
- (40) Statler, T. S., Smecker-Hane, T., & Cecil, G. 1996, AJ, 111, 1512 (SSC)
- (41) van der Marel, R. P., & Franx, M. 1993, ApJ, 407, 525
- (42) van der Marel, R. P., Rix, H.-W., Carter, D., Franx, M., White, S. D. M., & de Zeeuw, T. 1994, MNRAS, 268, 521
- (43) van Dokkum, P. G. & Franx, M. 1995, AJ, 110, 2027
- (44)