Large-scale structures in the distribution of X-ray selected AGN
Abstract
We are searching for large-scale structures in the distribution of AGN discovered by the ROSAT All-Sky Survey. The RASS detected 60000 X-ray objects, of which 35% are AGN at z 0.5. The surface density in the extragalactic sky is 0.5 AGN/deg2, which has not been reached until now by any other survey for this redshift range. We efficiently single out the AGN among all the RASS sources using the Hamburg/RASS database of optical identifications, which contains presently 13867 entries.
Follow-up spectroscopy of RASS AGN candidates identified in selected areas of the northern sky is underway to determine the spatial distribution of the AGN in these areas. In every area structures reminiscent of clusters and filaments are found on scales 50 - 100 h-1Mpc. These structures have a similar size as the serendipitously discovered groups of AGN in optical surveys at higher redshifts. Samples of low redshift AGN drawn from the RASS are large enough to be used with samples of higher redshift to study evolutionary effects in the large-scale distribution of AGN.
1 Introduction
Wideangle galaxy surveys have convincingly shown the existence of large-scale structure in the matter distribution of the universe in form of filaments around voids with extensions111Sizes are given in h-1Mpc with h = H0/100 and q0=0.5. H0 is the Hubble constant of 20 - 30 h-1Mpc and in form of superstructures like the “Great Wall” with an extension of 60 170 h-1Mpc (Geller & Huchra 1989). Such structures have been found up to a distance of z 0.2 studying mostly clusters of galaxies. Recently Einasto et al. (1997a,b) claimed that clusters of galaxies form nodes and walls in a rather regular supercluster void network with a typical scale of 120 h-1Mpc. To study such structures at even higher redshifts needs the involvement of quasars, either by using their distribution itself or the distribution of absorbers in the line of sight (e.g. Quashnock et al. 1997).
Using different samples of AGN (=Sy1 galaxies and QSOs) indications for structures on scales 20 h-1Mpc have been found, but not on larger ones (Croom & Shanks 1996 and ref. therein). Attempts to study the evolution of these structures lead to divergent results. Iovino & Shaver (1988) found increasing strength of clustering with decreasing redshift, while La Franca et al. (1998) obtained the opposite result. Shanks & Boyle (1994) obtained a result compatible with no evolution. All these evolutionary studies are hampered by the lack of suitable low-redshift AGN samples, as these require wide-angle (better: all-sky) surveys. Evidence for structures 20 h-1Mpc comes from the serendipituos discovery of clusters of quasars with extensions of 60 - 200 h-1Mpc (Graham et al. 1995 and ref. therein). Komberg et al. (1996) identified 12 Large Quasar Groups of similar size in the Véron-Cetty & Véron QSO catalogue at redshifts 0.5 z 2.0, the lower redshift limit being probably due to the lack of suitable wide-angle surveys.
The ROSAT All-Sky Survey with its tens of thousands of AGN offers an excellent possibility to investigate the distribution of AGN in the local universe and to search for close clusters of AGN. If AGN clusters at low redshifts (z0.1) can be found, a comparison with the distribution of galaxies in the cluster region will be feasible. This would allow us to relate the observed AGN clustering directly with clustering of galaxies.
2 The Hamburg/RASS database of optical identifications
The redshift determination for large samples of RASS selected AGN would require unacceptable large amounts of telescope time, if identification of the correct optical counterpart would be required simultaneously. We are however able to single out the AGN from the RASS sources very efficiently by cross-correlating the RASS with the optical data from the Hamburg Quasar Survey (HQS; Hagen et al. 1995). RASS sources are identified by Bade et al. (1998) systematically on the digitized objective prism plates of the HQS and their spectroscopic follow-up observations gave a satisfying high confirmation rate 90% (Bade et al. 1992) for the AGN candidates. The Hamburg/RASS database presently contains 13867 entries, covering RASS sources selected from 10 000 deg2 of the extragalactic northern sky. The database is regularly updated and enlarged with information from the newest plates taken for the HQS and from subsequent processings of the RASS. Optical identifications are available for 61% of the RASS sources processed, with 50% being AGN, 40% stars and 10% galaxies and galaxy clusters. For RASS sources contained in the Bright Source Catalogue (BSC; Voges et al. 1996) the identifications are compiled in the Hamburg/RASS Catalogue of Optical Identifications (HRC) (Bade et al. 1998). The newest version contains 4665 entries and is available on the web (http://www.hs.uni-hamburg.de/rass.html). The HRC provides plausible optical candidates for 80% of the BSC-RASS sources contained.
3 ROSAC: A ROSAT based Search for AGN Clusters
In the extragalactic sky about half of the RASS sources are AGN. Following the redshift distribution of RASS AGN given by Bade et al. (1995) 70% have redshifts z0.5, giving a surface density of 0.5 AGN/deg2. Such a high surface density has not been reached by any survey before in this redshift range. Even the largest optical survey, the LBQS (Hewett et al. 1995), reached only 0.3 AGN/deg2 (0.1z0.5) over an area of 454 deg2. Presently the use of the RASS to study large-scale structure is however limited by the lack of redshift information for most of the AGN candidates.
For a first test, Tesch & Engels (1998) examined the spatial distribution of 856 RASS AGN, for which redshifts were available from the literature or from own follow-up observations. The AGN were compiled from an area of 7000 deg2, in which optical identifications of RASS sources were made then. To analyze the data two different methods were used: a direct search for structures with the minimal spanning tree and a statistical study by the two-point correlation function. The application of the minimal spanning tree led to the discovery of an AGN group with 7 members in a volume V 140 75 75 h-3Mpc3 in the Pisces constellation. With a mean redshift z=0.27 this group is only the third discovered group at redshifts z0.5. The two-point correlation function shows AGN clustering on small scales (10 h-1Mpc) with a significance , corroborating earlier results based on smaller AGN samples.
This first sample was however highly inhomogeneous. The area was defined by the status of the identification process and included HQS survey fields with very different amounts of X-ray absorption, leading to strongly varying numbers of AGN candidates per field. In addition the number of AGN per field with known redshifts was also strongly inhomogeneous.
We started therefore a new program (ROSAC: A ROSAT based Search for AGN Clusters; cf. http://www.hs.uni-hamburg.de/rosac.html) to obtain a homogeneously selected sample with complete redshift information. Three selected areas in the constellations Pisces, Ursa Major and Coma Berenices were chosen. The main selection criteria for these areas have been a low hydrogen column density NH, a large number of already known redshifts and the existence of interesting features as the new Pisces-AGN-Group or further candidates of AGN groups with an insufficient significance level yet. The cumulative area comprises 1700 deg2 and contains 650 AGN and AGN candidates. The AGN surface densities are a function of the RASS detection limits, which depend mainly on NH, and vary between 0.3 and 0.5 AGN/deg2. In principle the surface densities can be increased further by inclusion of the 40% unidentified RASS sources in the Hamburg/RASS database. This requires however additional CCD imaging and probably spectroscopy of more than one optical candidate to obtain the correct identification. Unrecognized AGN are mostly not detected on the HQS objective prism plates and are therefore optically rather weak (B18.5).
Spectroscopy of RASS AGN candidates is underway using telescopes on Calar Alto (2.2m), at Xinglong Station (2.16m), in Haute-Provence (1.93m), and at the Special Astrophysical Observatory (6m). The confirmation rate is maintained at the 90% level including BL Lac objects. They make up 10% of the AGN candidates and the S/N of their spectra is usually insufficient to determine the redshift. For 70% of the whole sample redshifts are available now.
4 First results
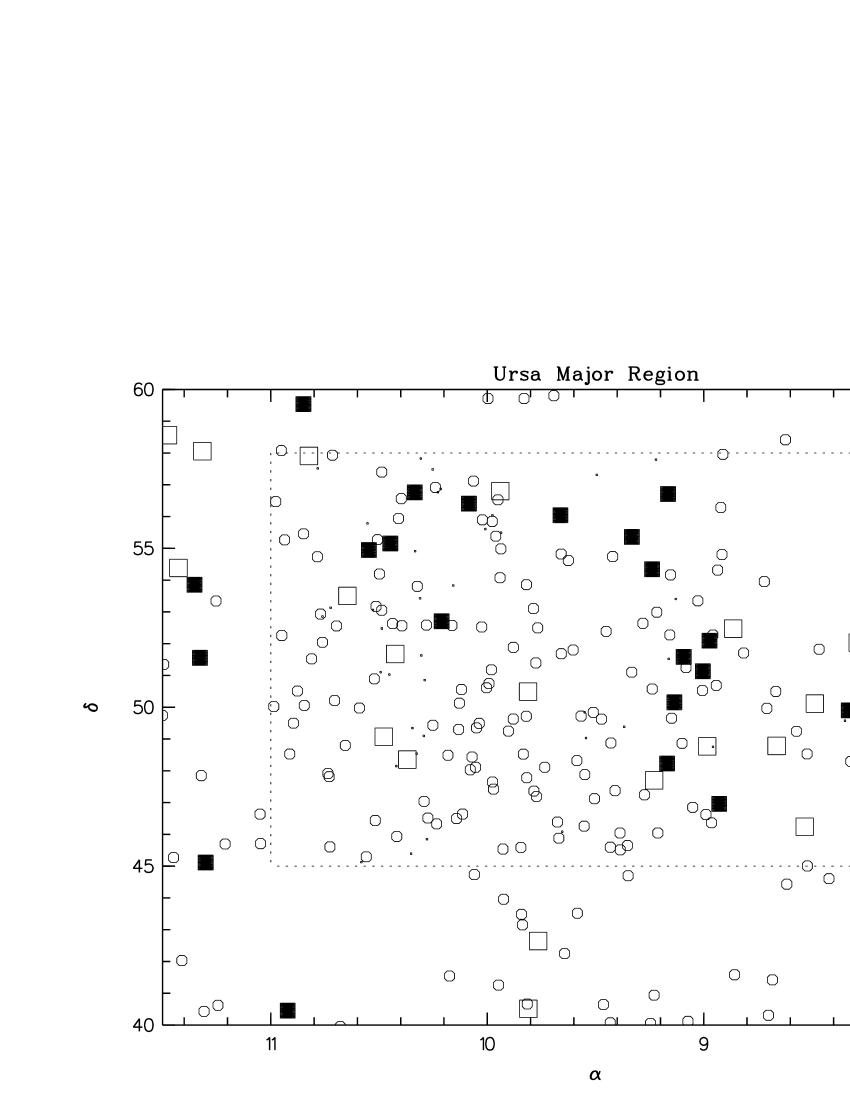
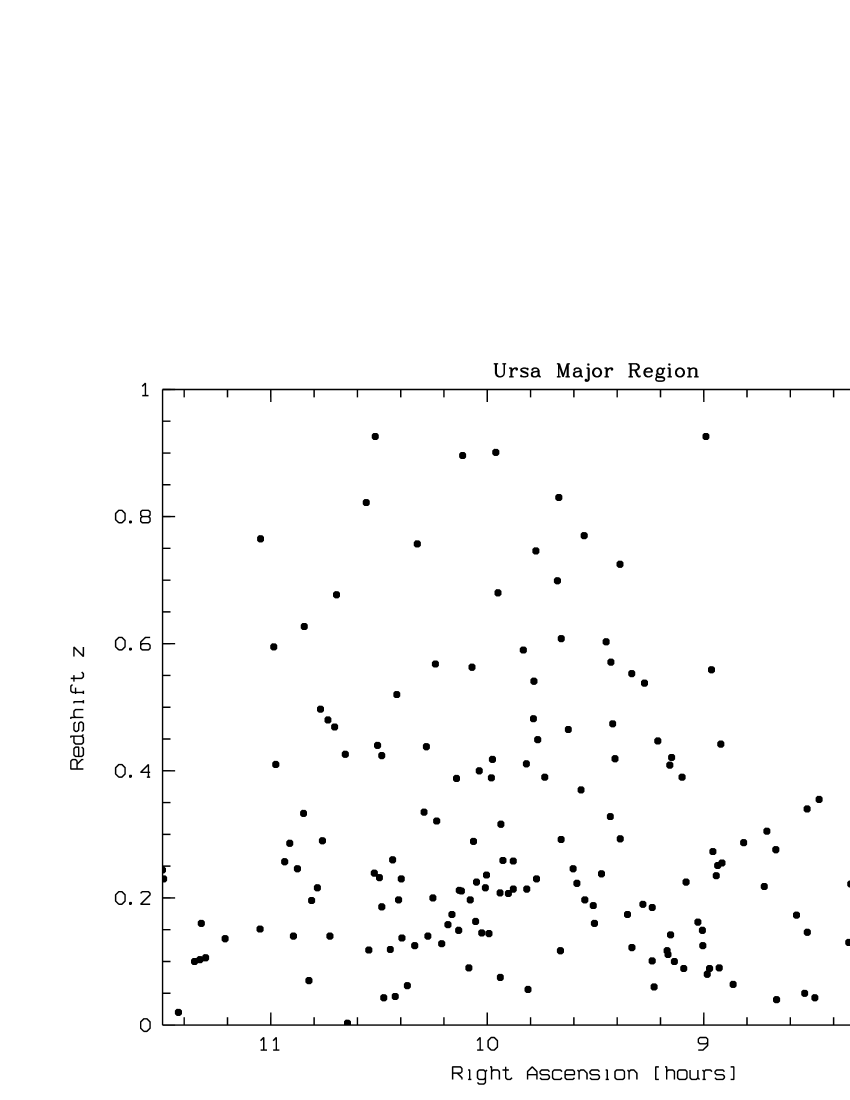
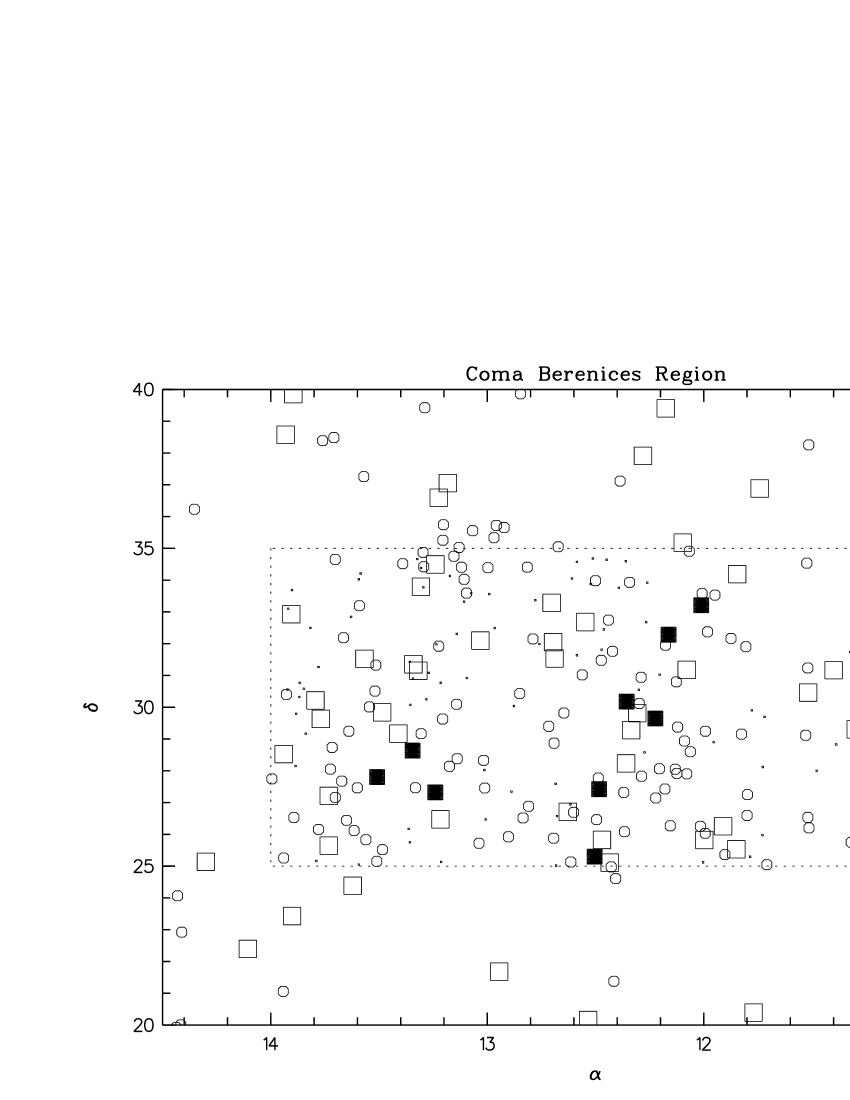
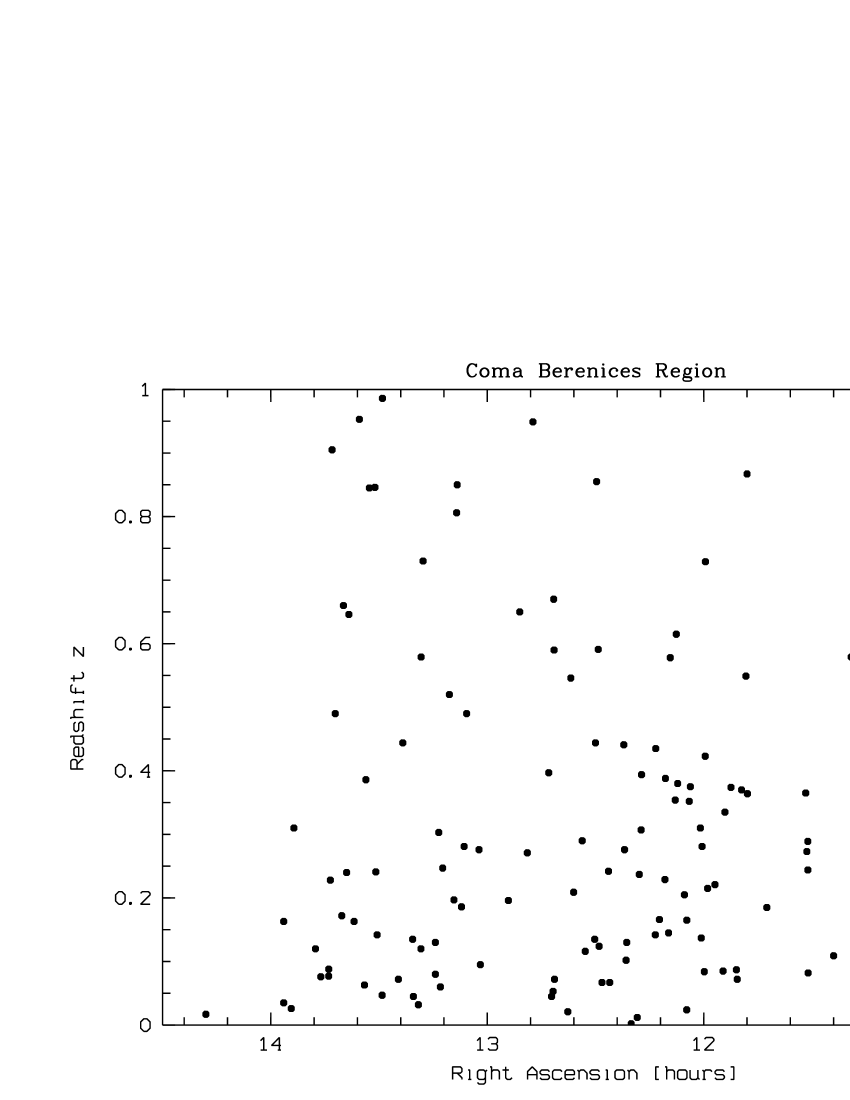
In all three regions we find in certain redshift ranges structures which resemble clusters, walls and filaments as they were found in galaxy distributions. This is exemplified in Figures 1 to 4 showing the AGN distributions in the Ursa Major und the Coma Berenices regions. For example, in the UMa region a filament extending Mpc at z was found, while in the Coma region a wall-like structure at z was detected. At these redshifts the probability of finding structures is relatively high since the redshift distribution of the RASS AGN peaks at z 0.1. The filament has a size of 130 h-1Mpc in redshift space, while the wall has an overall size of 10 50 70 h-3Mpc3. Plotting redshifts against equatorial coordinates the presence of voids is indicated, although their reality depends strongly on the achieved completeness in spectroscopy. Completeness is already achieved in part of the UMa region, in which a void is seen for example at = 9h 45m and z=0.15. Until now no statististical means have been applied to these samples, leaving the reality of the detected structures open. On larger scales, the AGN distributions resemble presently early maps of the spatial distribution of galaxies, as presented for example by Joeveer & Einasto (1978).
Notwithstanding the confirmation of the detected structures their relation to the matter distribution in the universe in general is open to debate. AGN groups detected so far have relatively high redshifts making a direct comparison to the distribution of galaxies or clusters of galaxies impossible. Komberg et al. (1996) propose that the AGN groups evolve into the superclusters of galaxies in the local universe. Applying their spatial number density of superclusters of n 1.4 10-7 h3 Mpc-3 to the volume sampled by RASS AGN, Tesch & Engels (1998) expected several dozens AGN groups to be present, while they found only one. The inhomogeneity of their sample precluded however a firm rejection of the Komberg et al. hypothesis. The ROSAC sample will give stronger constraints.
The filaments and walls in the AGN distributions found in our selected regions may indicate that the AGN and quasar groups are not isolated but part of supercluster-void networks as they were discovered by Einasto et al. (1997a,b) in the distribution of rich clusters of galaxies. The non-detection of structures 20 h-1 Mpc in the clustering analyses of large optically selected quasar samples and the general view that quasars avoid dense environments of galaxies (Smith et al. 1995) is presently not consistent with a scenario in which the AGN distribution trace the denser parts of the matter distribution in the universe. AGN structures at low redshifts offer now the possibility to study their relation to the galaxy distribution directly, as the redshift determination for galaxies at such distances is within the capabilities of the modern optical telescopes.
References
- [1] Bade N., Engels D., Fink H., et al., 1992, A&A, 254, L21
- [2] Bade N., Fink H., Engels D., et al., 1995, A&AS, 110, 469
- [3] Bade N., Engels D., Voges W., et al., 1998, A&AS 127, 145
- [4] Croom S.M., Shanks T., 1996, MNRAS, 281, 893
- [5] Einasto J., Einasto M., Frisch P., et al., 1997a, MNRAS, 289, 801
- [6] Einasto J., Einasto M., Frisch P., et al., 1997b, MNRAS, 289, 813
- [7] Geller M.J., Huchra J.P., 1989, Science, 246, 897
- [8] Graham M.J., Clowes R.G., Campusano L.E., 1995, MNRAS, 275, 790
- [9] Hagen H.-J., Groote D., Engels D., Reimers D., 1995, A&AS, 111, 195
- [10] Hewett P.C., Foltz C.B., Chaffee F.H., 1995, AJ, 109, 1498
- [11] Iovino A., Shaver P.A., 1988, ApJ, 330, L13
- [12] Joeveer M., Einasto J., 1978, in IAU Symposium 79, The Large-Scale Structure of the Universe, p. 241
- [13] Komberg B.V., Kravtsov A.V., Lukash V.N., 1996, MNRAS, 282, 713
- [14] La Franca F., Andreani P., Christiani S., 1998, ApJ, 497, 529
- [15] Quashnock J.M., Vanden Berk D.E., York D.G., 1997, ApJL, 472, L69
- [16] Shanks T., Boyle B.J., 1994, MNRAS, 271, 753
- [17] Smith R.J., Boyle B.J., Maddox S.J., 1995, MNRAS 277, 270
- [18] Tesch F., Engels D., 1998, MNRAS, submitted
-
[19]
Voges W., Aschenbach B., Boller Th., 1996,
http://www.rosat.mpe-garching.mpg.de/survey/rass-bsc/