Evidence for a Massive Black Hole in the S0 Galaxy NGC 4342
Abstract
We have constructed axisymmetric dynamical models of the edge-on S0 galaxy NGC 4342: simple two-integral Jeans models as well as fully general, three-integral models using a modified version of Schwarzschild’s orbit superposition technique. The two-integral models suggest a black hole (BH) of 3 or , depending on the data set. The three-integral models can fit all ground-based and HST data simultaneously, but only when a central BH is included. Models without BH are ruled out at better than 99.73% confidence level. We determine a BH mass of . This corresponds to of the bulge mass, making NGC 4342 one of the galaxies with the highest BH mass to bulge mass ratio currently known.
Sterrewacht Leiden, The Netherlands
University of Washington, Seattle, USA
1. The data
NGC 4342 is a low luminosity () edge-on S0 galaxy in the Virgo cluster, displaying both an outer disk () and a stellar nuclear disk ().
The data consists of long slit spectroscopy obtained from the ground, and of multi-color photometry and single aperture spectroscopy obtained with HST (see van den Bosch, Jaffe & van der Marel 1998). We modelled this complex mass distribution using the Multi Gaussian Expansion technique of Emsellem, Monnet & Bacon (1994).
2. Jeans models
We have first constructed simple dynamical models assuming a distribution function (DF) of the form . Under the assumption of constant mass to light ratio (M/L), we have solved the Jeans equations and compared the projected velocity dispersions (after seeing convolution and pixel binning) to the observations. Although this model shows some discrepancies with the data, it suggests a BH mass in the range (3 - 6) (see Cretton & van den Bosch 1998 for details). These models cannot fit simultaneously the two data sets, suggesting a more sophisticated type of modeling (three-integral DF).
3. Three-integral models
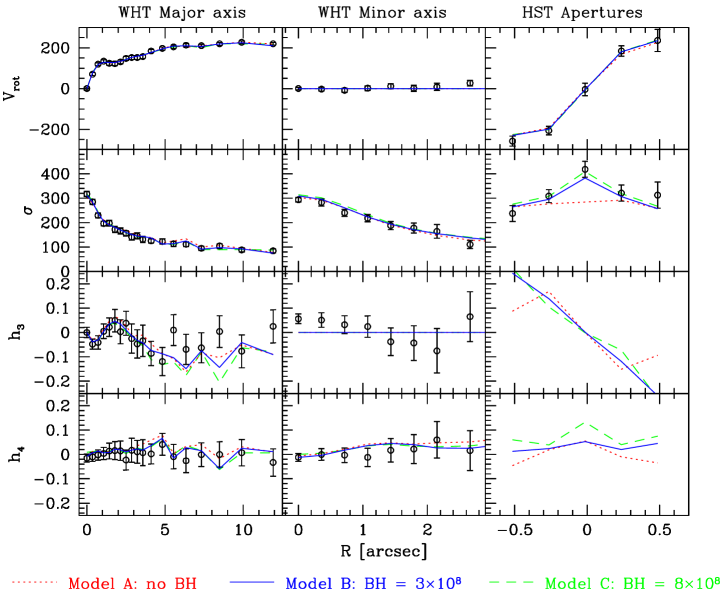
Our scheme follows Schwarzschild’s method with an extension towards the use of kinematic constraints: We first deproject the surface brightness to obtain a three-dimensional mass density distribution (assuming a constant M/L). From the Poisson equation the gravitational potential corresponding to the stellar body is derived. At that stage, a dark component (BH or dark halo) can be added to the potential. In this total potential, a large library of orbits is computed and projected onto the observable space (position on the sky, line-of-sight velocities). Again the necessary steps of seeing convolution and pixel binning are performed for a fair comparison to the data. Finally the orbital weights are computed that best reproduce the photometric and kinematic constraints (see Figure 1 for the kinematic fits of 3 models).
The inclusion of the complete distribution of line-of-sight velocities greatly helps in constraining the final model. The three-integral models have more freedom than the simpler Jeans models and have no problems fitting small features of the data (e.g. in the rotation curve). Moreover, contrary to the two-integral models, they can fit simultaneously both data sets (ground-based and HST).
To determine the exact values of M/L and BH mass, we compute a grid of models in (M/L, BH) and use -statistics to assign confidence levels (see Figure 2). On the basis of the complete data set, models without BH can be ruled out at a confidence level 99.73 %. The best fit values for a (M/L, BH) are : model B in Figure 2. Therefore in this galaxy, the ratio BH mass to bulge mass () is the highest currently known (2.6%), together with the case of NGC 3115 (see e.g., Ho 1998).

4. Internal kinematics
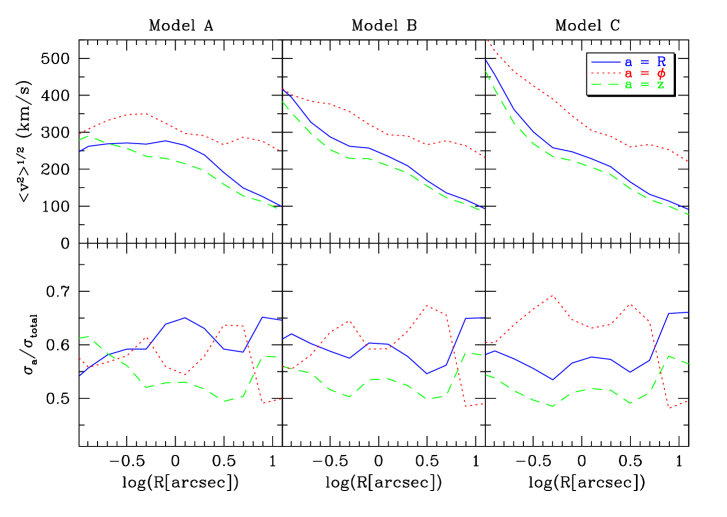
Figure 3 shows the second order velocity moments and velocity dispersions of models A, B and C averaged over a cone of opening angle 15∘ around the equatorial plane. This region contains the inner and outer discs, but in the very center, the bulge contribution dominates the light.
Models A, B and C mainly differ in the center (due to different BH masses). Outside , dominates the dynamics in accordance with the rapid rotation of the outer disk. From to , we pass from the azimuthally anisotropic bulge into a radially anisotropic region: the dynamically cold outer disk built up of close-to-circular orbits with low .
Models B and C have remarkably constant at , and are thus not too different from two-integral models (for which this ratio is exactly 1.0). The same has been observed in M32, one of the few galaxies for which three-integral models have been constructed (van der Marel et al. 1998). Merritt and collaborators (see this volume) have proposed that, under the influence of a central BH, box orbits are destroyed and the global mass distribution evolves towards axisymmetry (see also Gerhard & Binney 1985). At the same time, this tends to erase any dependence on a third integral in the DF, consistent with what we have found here. When is , the very short ( one crossing time) evolution towards axisymmetry provides a negative feedback mechanism that limits the BH mass by cutting off its fuel suply (Merritt & Quinlan 1998). Therefore in this scenario, the maximum BH mass that can be accreted in the center is , close to the observed maximum.
The main change going from model A to model C, is a strong increase of in the inner . In this region the circular velocities increase strongly with increasing BH mass. Nevertheless, all three models provide an almost equally good fit to the observed rotation velocities because, going from model A to C, the ratio of -orbits over -orbits increases in the interval . This causes the net streaming motions of all three models to be roughly similar despite the large differences in circular velocities and explains the strong increase in .
References
Cretton, N., & van den Bosch, F. C. 1998, ApJ, in press, (astro-ph 9805324)
Emsellem, E., Monnet, G., & Bacon, R. 1994, A&A, 285, 723
Gerhard, O. E., & Binney, J. J. 1985, MNRAS, 216, 467
Ho, L. C. 1998, in Observational Evidence for Black Holes in the Universe, ed. S. K. Chakrabarti (Dordrecht: Kluwer), in press (astro-ph 9803307)
Merritt, D., & Quinlan G. D. 1998, ApJ, 498, 625
van den Bosch, F. C., Jaffe, W., & van der Marel, R. P. 1998, MNRAS, 293, 343
van der Marel, R. P., Cretton, N., de Zeeuw, P. T., & Rix, H.-W. 1998, ApJ, 493, 613