2 Max-Planck-Institut für Astrophysik Karl-Schwarzschchild-Strasse 1, 85740 Garching, Germany
3 Beijing Astronomical Observatory, Chinese Academy of Sciences, 100080 Beijing, P. R. China
4 Beijing Astrophysics Center (BAC)†, 100871 Beijing, P. R. China
5 Max-Planck-Institut für Extraterrestrische Physik, Karl-Schwarzschild-Strasse 1, 85740 Garching bei München, Germany
6 Dept. of Physics, Graduate School, Chinese Academy of Sciences, 100039 Beijing, P. R. China
Ultraluminous IRAS galaxy 10026+4347
Abstract
We study optical and X-ray properties of the ultraluminous IRAS galaxy 10026+4347. This galaxy is a narrow-line QSO with very strong FeII emission. Three optical spectra were taken over two years. The full widths at half maximum (FWHMs) of the emission lines are constant whereas the third spectrum seems to show a continuum change. Intermediate-band photometry also shows a small (0.1 mag) but significant decrease in flux. HST WFPC2 images suggest that this object is a post-merger galaxy. The source is X-ray luminous () with a very soft X-ray spectrum (photon index ). The X-ray luminosity exhibits variabilities of a factor of over four years and a factor of two within two days. During these X-ray flux changes, the X-ray spectral shapes are consistent with no variation. All the optical and X-ray properties resemble those of narrow-line Seyfert 1 galaxies (NLS1), except that the FWHM of is about 2500 , larger than that for most NLS1s. We discuss the implications of our results on models of NLS1s.
Key Words.:
Galaxies: active – Galaxies: interactions – quasars: emission lines – Galaxies: Seyfert – Galaxies: nuclei† BAC is jointly sponsored by the Chinese Academy of Sciences and Peking University
1 Introduction
One of the most spectacular results of the IRAS satellite survey was the discovery of a population of ultraluminous IRAS galaxies (ULIGs, see Sanders & Mirabel 1996 for a review). Most ULIGs are strong interacting and/or merging galaxies; some of them are possible post-merger galaxies (e.g., Wu et al. 1998). Analysis of the spectral properties of ULIGs reveals that about 10% of ULIGs are Seyfert 1 galaxies (including QSOs) (Lawrence et al. 1998; Wu et al. 1998). These infrared-selected Seyfert 1 galaxies have different properties from the optically-selected Seyfert 1s (Lipari 1994). For example, most of IRAS Seyfert 1s are strong or extremely strong optical FeII emitters and vice versa (Lawrence et al. 1997). Most infrared-selected Seyfert 1s have relatively low soft X-ray luminosities, very low ratios when compared with optically-selected ones. The differences between the optically-selected and infrared-selected Seyfert 1s are not yet fully understood.
There is a related class of the so-called narrow line Seyfert 1 galaxies (hereafter NLS1, Osterbrock & Pogge 1985). These galaxies are defined by their optical emission line properties. They have narrow hydrogen Balmer lines with typical full width at half maximum (FWHM) 500-2000 . The ratio of [OIII]5007/H is less than 3 and most of them have strong FeII emissions. NLS1s also show systematically steeper slopes in their soft X-ray continuum than normal Seyfert 1s. Some NLS1s exhibit rapid X-ray variabilities as well (Boller et al. 1996).
In this paper, we study the ultraluminous IRAS galaxy 10026+4347, a narrow-line QSO selected from the QDOT redshift survey. We show that this source is an unusual object: it has some common characteristics with NLS1s, such as a very soft X-ray spectrum, strong FeII emissions and rapid time variabilities. On the other hand, it has a larger FWHM () in the H line than most NLS1s. The optical and X-ray properties of this source are presented in §2 and 3. In section 4, we discuss the nature of this object. Throughout this paper we use a Hubble constant of and .
2 Photometric and Spectroscopic Properties
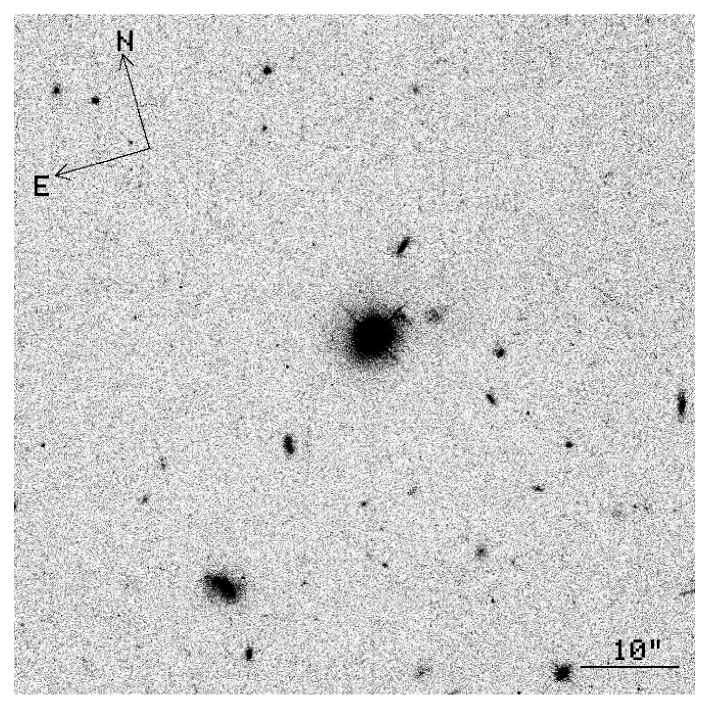
IRAS 10026+4347 (RA=10:05:43.5, DEC=43:32:33.2 in J2000) is a narrow-line QSO discovered in the QDOT redshift survey with infrared luminosity (Rowan-Robinson et al. 1990). This galaxy has a redshift of (as determined from our spectra shown in Fig. 2). At this redshift, corresponds to 4.6 kpc. 600s exposure images were obtained with intermediate-band filters using the 60cm/90cm Schmidt telescope equipped with a 2048x2048 CCD at the Beijing Astronomical Observatory (BAO). The galaxy appears to be a point source on these images. HST snapshot images (Fig. 1) obtained on May 1, 1997, however, clearly shows two faint close companions within of the galaxy; these two objects are very probably physically associated with IRAS 10026+4347. In addition, there are also a number of faint objects within a projected distance of 300 kpc of IRAS 10026+4347. It is however unclear whether these objects are physically related to IRAS 10026+4347 or just foreground or background objects. It is also possible that IRAS 10026+4347 is a post-merger galaxy at the center of a group of galaxies because the picture resembles the JHK images of some low redshift quasars (Hutchings & Neff 1997). To test this possibility, we analyze the surface brightness profile for IRAS 10026+4347 using the HST snapshot image. We find that IRAS 10026+4347 is well described by the de Vaucouleurs () profile out to 10 kpc (Zheng et al. 1998), similar to other elliptical-like ULIGs such as Arp 220 and NGC 6240. The surface profile of IRAS 10026+4347 thus suggests that it is a post-merger galaxy. The apparent B and R magnitudes for this source are about 16.2 and 16.1, respectively, from the USNO-A1.0 catalog (Monet 1996). With , this galaxy is one of the bluest active galaxies selected from ULIGs. The absolute magnitudes can be calculated as and . The optical luminosity of this object therefore falls into the regime of quasars.
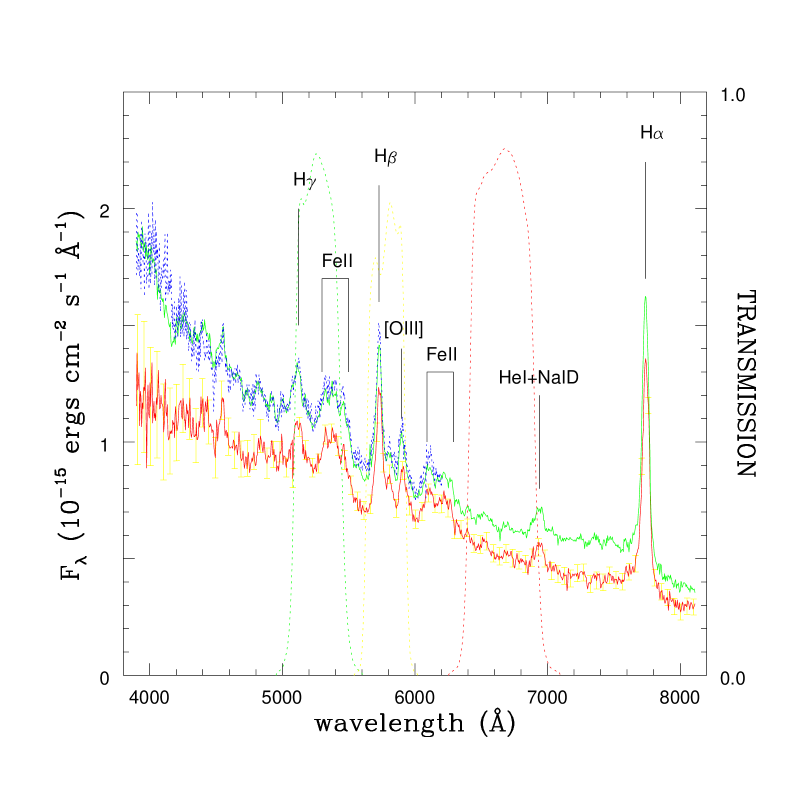
The optical spectrum for this object was first obtained during the QDOT redshift survey. It is clear from the low dispersion spectrum that IRAS 10026+4347 is a strong FeII emitter. We observed this object (with higher resolution) again on Nov. 17, 1996, Jan. 7, 1997 and May 26, 1998 using a Zeiss universal spectrograph mounted on the 2.16m telescope at the Xinglong Station of BAO. A Tektronix 10241024 CCD was used giving a wavelength coverage of 3500Å to 6200Å with a grating of 100Å/mm (for Nov. 1996) and of 3500Å to 8100Å with a grating of 200Å/mm (for Jan. 1997 and May 1998). The spectral resolutions are 4.7Å and 9.3Å (2 pixels), respectively. Wavelength calibration was carried out using an Fe-He-Ar lamp; the resulting wavelength accuracy is better than 1Å. KPNO standard stars were observed to perform flux calibrations. The three spectra are shown in Fig. 2. The absolute flux errors for the first two spectra are about 5% whereas that for the last spectrum is larger, around 15%, since it was taken on a non-photometric night. The first two spectra almost overlap with each other while the third spectrum seems to have a lower amplitude and a flatter continuum particularly at the blue end (Å). This amplitude decrease is supported by two runs of photometric observations in three intermediate-bands conducted on the 60/90cm Schmidt telescope on Feb. 21-22 and April 24-25 1998. These three filters are centered on 5270Å, 5795Å and 6660Å, with width 340Å, 310Å and 480Å (cf. Fig. 2; see Fan et al. 1996 for details). The (relative) photometry is calibrated using many stars within the field. and has an accuracy of about 0.03 mag. The results indicate that there is a gradual 0.1 magnitude drop during these runs in all three filters. Since our spectroscopic observations indicate the emission lines are fairly stable (see below), the changes are therefore from the continuum. Hence, both the photometric and spectroscopic observations strongly suggest that there was a small but real continuum variability.
In addition to the continuum, we have also measured the line fluxes. The measured values , H, and emission lines and the FWHM for and the flux ratio of to FeII are listed in table 1. The FWHM of is about 2500 , broader than the typical values () for NLS1s. The observed is about 2, and since the blend of FeII 4750 accounts for about 25% of the total optical FeII emission (Collin-Souffrin et al. 1986), we infer that the ratio of total optical FeII to is about 8. Therefore, IRAS 10026+4347 qualifies as a very strong FeII emitter. As can be seen from Table 1, that there is no statistically significant line variability during the three observations.
| Date | FeII | H | FWHM | FeII/ | |
|---|---|---|---|---|---|
| 961117 | — | 2.0 | |||
| 970107 | 1.94 | ||||
| 980526 | 1.94 |
3 Soft X-ray Properties
There are three data sets of ROSAT observation for IRAS 10026+4347 in the ROSAT archive: the source was first detected in the ROSAT All Sky Survey (RASS, Trümper 1983; Bade et al. 1995) and later observed using ROSAT PSPC in May 1994 and ROSAT HRI in Nov. 1995. We have reduced the X-ray data using the EXSAS software at MPE (Zimmermann et al. 1992). Table 2 lists the exposure time, count rate, flux and the X-ray luminosity. Note that the flux and luminosity are model-dependent, and we have used a power-law fit in deriving these quantities (see below).
| Instru. | date | exp. (s) | count rate | flux | |
|---|---|---|---|---|---|
| RASS | 1990 | 508 | 2.28 | 2.4 | |
| PSPC | 5/1994 | 949 | 0.29 | 0.31 | |
| HRI | 11/1995 | 4711 | 0.80 | 0.84 |
From table 2 it is obvious that the source varied during the three observations: the count rate in RASS is about 8 times larger than the PSPC observation conducted after 4 years. We also performed time variability test using the RASS data. We bin the data in an interval of 4000s. Notice that the ROSAT wobbling is on the scale of s, and so has no effect on our variability test. We find that the count rates exhibit about a factor of two variability within two days. An examination of the HRI data indicates similar behaviors. So IRAS 10026+4347 is a variable object in the soft X-ray on both short and long time scales.
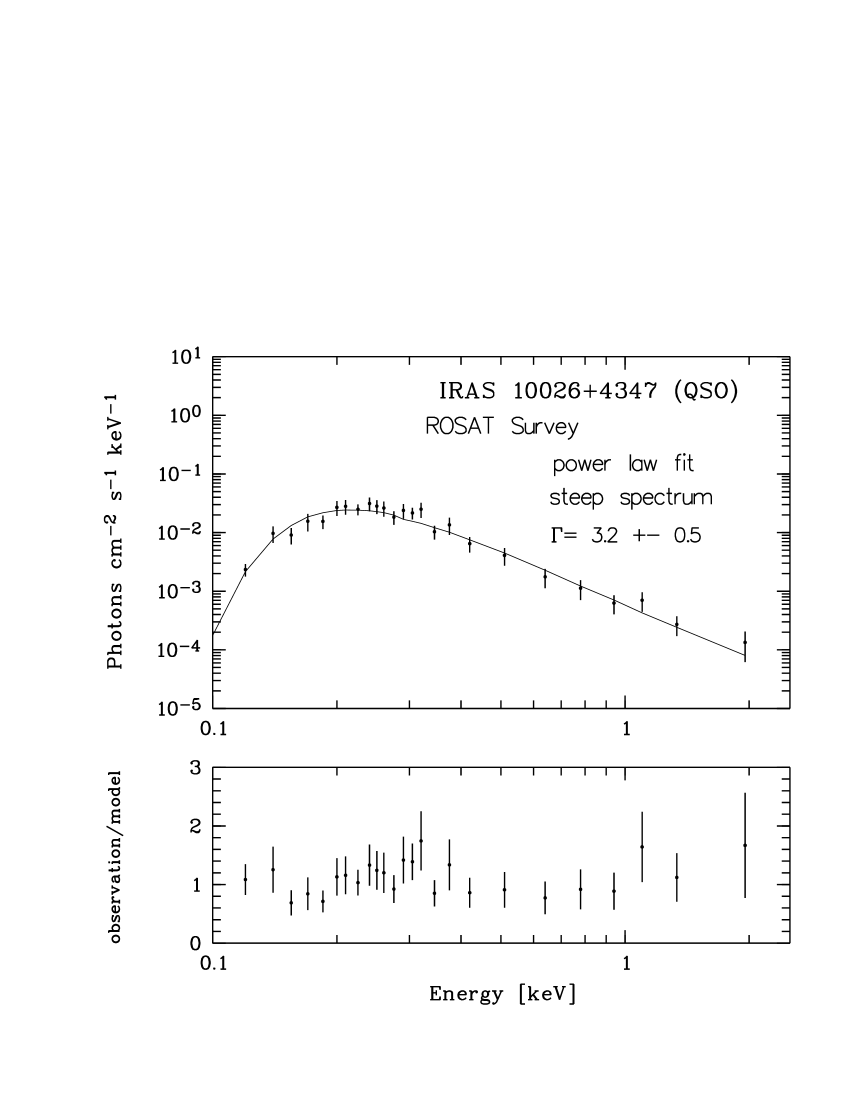
We analyze the soft X-ray spectrum using the RASS data since it has higher photon number counts than that of the later PSPC observation. Fig. 3 shows the spectrum together with a power-law fit. The photon index is found to be . This value is steeper than the average slope of 2.5 for most AGNs, but is in the range of NLS1s (Boller et al. 1996). The spectral shape from the PSPC observation is uncertain (due to limited number of photons), but is in agreement with that found from the RASS data. The data is therefore consistent with no soft X-ray spectral variations while the flux has varied by a factor of .
4 Discussion
It is clear from optical and soft X-ray observations that IRAS 10026+4347 is (like most ULIGs) a merging galaxy with extremely strong FeII emission; in the X-ray, its luminosity is comparable to normal Seyfert 1 galaxies or QSOs and has steep X-ray continuum slope and large soft X-ray variability. In addition, it exhibits optical continuum variability. These optical spectral and photometric variabilities are not unusual for normal Seyfert 1 galaxies (e.g., NGC5548, NGC4151). IRAS 10026+4347 seems remarkably similar to another ultraluminous IRAS galaxy RX J0947.0+4721 (Molthagen et al. 1998). Both sources are X-ray bright with luminosities of and steep soft photon index (4.2 for RX J0947.0+4721). Both objects show large variations in the X-ray count rate while the soft X-ray spectrum remains stable. In the optical, these two sources have quasar level luminosity ( for RX J0947.0+4721) and strong FeII emissions. However, these objects do have a notable difference: RX J0947.0+4721 has very narrow Balmer lines (FWHM ). The similarity between the properties of IRAS 10026+4347 with RX J0947.0+4721, and more generally with the NLS1 class, is striking despite of their differences in the FWHM. This strongly suggests that NLS1, narrow-line QSOs, normal Seyfert 1 galaxies and normal QSOs form a continuum in their properties such as FWHM (cf. Boller et al. 1996).
Many models have been suggested to explain the puzzling characters of NLS1s (see Boller et al. 1996 and references therein). A promising suggestion is that NLS1s are supermassive analogues of galactic black hole candidates in a high supersoft state; in this state, the source is accreting close to the Eddington limit. The resulting X-ray spectrum has a steep slope and is relatively stable (Pounds et al. 1995; Comastri et al. 1998; Puchnarewicz et al. 1998; Wang et al. 1998). The intense soft X-ray flux may prevent the formation of broad-line clouds close to the central source (see Guilbert, Fabian & McCray 1983; White, Fabian & Mushotzky 1984). This scenario is particularly attractive for merging galaxies such as IRAS 10026+4347 (cf. Fig. 1). Numerical simulations (e.g., Lin et al. 1988; Mihos & Hernquist 1996) show that large amount of gas flows into the central regions of merging galaxies, which can presumably fuel the black hole at the Eddington accretion rate. The merging process may also induce intense star formations; the resulting supernovae may enrich metals including iron in the surrounding gas. The intense FeII emissions can therefore also be explained. The optical and X-ray properties of IRAS 10026+4347 are broadly consistent with this picture. Clearly more quantitative modelling is needed to see whether this picture can explain the intense variations seen in NLS1s such as 13224-3809 and PHL 1092, which are also very luminous or ultraluminous IRAS galaxies (Boller et al. 1996).
Galaxies like IRAS 10026+4347 are the best laboratory for studying the emission line region in AGNs. With their rapid X-ray variability, simultaneous optical and X-ray reverberation mapping (e.g., Krolik et al. 1991; Peterson et al. 1998) of NLS1s will provide valuable information on the differences between the emission mechanisms of NLS1s and the general population of Seyfert 1 and 2 galaxies.
Acknowledgements.
We thank Prof. J. Trümper and Prof. L.Z. Fang for stimulating the project of identification of ULIGs with RASS during which the object IRAS 10026+4347 was discovered. We thank Drs. F. Meyers and T. Wang for discussions and Thomas Erben for reducing the HST WFPC2 images. We are also indebted to the BATC group members of BAO, especially to Dr. Jin Zhu, for performing the photometric observations of IRAS 10026+4347. This project was partially supported by the NSF of China and NSFC-DSF exchange program.References
- (1) Bade N., Fink H. H., Engels D., et al., 1995, A&AS 110, 469
- (2) Boller Th., Brandt W.N., Fink H., 1996, A&A 305, 53
- (3) Collin-Souffrin S., Dumont S., Joly M., Pequignot D., 1986, A&A 166,27.
- (4) Comastri A., et al. 1998, A&A 331, 31
- (5) Fan X.H., et al. 1996, AJ 112, 628
- (6) Guilbert P.W., Fabian A.C., McCray R., 1983, MNRAS 266, 466
- (7) Hutchings J.B. Neff, S.G., 1997, AJ 113, 550.
- (8) Krolik J. H., Horne K., Kallman T. R., et al., 1991, ApJ 371, 541
- (9) Lawrence A., Elvis M., Wilkes B. J., McHardy I., Brandt N., 1997, MNRAS 285, 879
- (10) Lawrence A., et al., 1998, in preparation
- (11) Lin D.N.C., Pringle J.E., Rees, M.J., 1988, ApJ 328, 103
- (12) Lipari S., 1994, ApJ 436,102
- (13) Mihos J.C., Hernquist L., 1996, ApJ 464, 641
- (14) Molthagen K., Bade N., Wendker H.J., 1998, A&A 331, 925
- (15) Osterbrock D.E., Pogge R., 1985, ApJ 297, 166
- (16) Peterson B. M., Wanders I., Horne K., et al., 1998, PASP 110, 660
- (17) Pounds K. A., Done C., Osborne J.P., 1995, MNRAS 277, 5P
- (18) Puchnarewicz E. M., Mason K. O., Siemiginowska A., 1998, MNRAS 293, 52
- (19) Rowan-Robinson M., Lawrence A., Saunders W., et al., 1990, MNRAS 247, 1
- (20) Sanders D.B., Mirabel I.F., 1996, ARA&A 34, 749
- (21) Sanders D.B., et al., 1988, ApJ 325, 74
- (22) Trümper J., 1983, Adv. Space Res. 4, 241
- (23) Wang T., Otani C., Cappi M., Leighly K. M., Brinkmann W., Matsuoka M., 1998, MNRAS 293, 397
- (24) White N., Fabian A.C., Mushotzky R.F., 1984, A&A 133, L9
- (25) Wu H., Zou Z.L., Xia X.Y., Deng Z.G. 1998, A&AS 132, 181
- (26) Zheng Z. et al., 1998, in preparation
- (27) Zimmermann H.U., Belloni T., Izzo C., Kahabka P., Schwentker O., 1992, MPE Report, p. 48