High energy phenomena in the Cartwheel’s ring
Abstract
We present the first X-ray detection of the Cartwheel’s ring. The impact that created the characteristic optical structure is responsible also for an enhanced level of star formation to which we can ascribe the relatively high level of X-ray emission observed. Deeper images and spectroscopic information are needed to confirm or disprove the hypothesis that High Mass X-ray Binaries contribute most of the radiation in this band.
1 Introduction
The origin of ring galaxies has been described by Lynds and Toomre (1976) and Toomre (1978): a nearly head-on collision between a compact galaxy and a gaseous disk creates an extra inward gravitational force that causes the orbits of disk particles to contract. The gravitational rebound that follows generates a transient density wave that propagates outward, sweeping the interstellar gas and forming a rather symmetrical feature, the ring, generally at 8-10 kpc (Theys and Spieghel 1977, Hernquist and Weil 1993). The presence of nearby companions, often with disturbed appearance, supports the collision theory for the formation of rings (Theys and Spieghel 1976, Hernquist and Weil 1993). The gas swept up by the density wave and collected in the ring reaches high densities and star formation phenomena are induced and enhanced. Evidence of high levels of star formation in rings is based on their blue optical colors, large far-infrared luminosities and on the presence of large, luminous HII regions with a young population, consistent with an estimated age of rings of yrs (Fosbury & Hawarden 1977, Appleton & Struck-Marcell 1987, Higdon 1995). A comprehensive review of the properties of ring galaxies is given by Appleton & Struck-Marcell (1995).
One of the most spectacular and famous example of a recently formed ring galaxy is the A0035-324 system, named “Cartwheel” because of its optical appearance: a bright, sharp outer ring linked by spiral spokes to the nucleus, reminiscent of a cartwheel. The Cartwheel is well studied in various wavelength ranges, but its X-ray properties have not been studied yet. We present here X-ray HRI ROSAT observations of this peculiar object.
2 The Cartwheel: a spectacular ring galaxy
The Cartwheel is located in a tight, compact group (at z ) of about 0.2 Mpc111We use H0 = 50 km s-1 Mpc-1, that implies a scale of 0.834 kpc/arcsec at the distance of the group, throughout the paper. physical size, found also by the newly developed algorithm that defines the catalog of Southern Compact Groups (Iovino et al, in preparation). The group is composed of four members, with velocities all within 400 km s-1 from one another (Taylor and Atherton 1984; naming as in Higdon 1995): the Cartwheel, two galaxies NE (G1+G2) which are probably in interaction (Higdon 1996), and a fourth object (G3) at to the North. The three companions are all of comparable magnitude (m). While it is likely that one of these is responsible for the creation of the Cartwheel’s ring, the identity of the intruder is still debated. Higdon (1996) suggests G3, from the trail in HI that seems to connect it to the Cartwheel. However, recent simulations by Athanassoula, Puerari and Bosma (1997) successfully reproduce the spokes structure assuming G2 as the intruder.
Two rings have been produced by the impact. The outer one has the largest linear diameter measured in ring galaxies: 80′′ along the major axis, corresponding to 65 kpc at the distance of 180 Mpc. The inner ring, close to the core, has been studied recently in detail with HST (Borne et al 1996; Struck et al. 1996): it is elliptical in shape with obvious dust lanes crossing it.
Many detailed observations of the Cartwheel are available, ranging from radio line (Higdon 1996) and continuum (Higdon 1996), to near- (Marcum et al., 1992) and far-infrared (Appleton and Struck-Marcell, 1987), optical (Theys and Spiegel 1976, Fosbury and Hawarden 1977) and H images (Higdon 1995) and line spectroscopy (Fosbury and Hawarden 1977). All have confirmed the presence of a recent starburst in the outer ring, without any corresponding activity in the inner ring, nucleus or spokes, believed to be relatively devoid of gas. Most of the activity is confined in fact in the S-SW portion of the ring, where massive and luminous HII regions characterized by large H luminosities and equivalent widths are found (Higdon 1995). Both dynamical considerations and stellar evolution models suggest an age of 2-4 108 yr for the star burst. The estimated supernova rate, as high as 1 SN/yr (i.e. almost two orders of magnitude higher than in normal galaxies), coupled with the evidence of very low metallicity, measured in O, N and Ne, also supports the view that star formation in the ring is a recent phenomenon and that gas currently forming stars was nearly primordial at the time of the impact (Fosbury & Hawarden 1977; Higdon 1995; Marcum et al 1992).
3 The X-ray picture
We have detected and imaged the Cartwheel for the first time in the X-ray band, using the HRI on board ROSAT (Trümper 1983). The observation (ROR= 600748) was carried out in December 1994, for a total ontime of 60225 sec. Prior to our observation, only a very uncertain upper limit, derived from a short IPC exposure, was available (Ghigo et al. 1983).
The data have been analyzed with the xray package in IRAF.
We first smoothed the image with different Gaussian widths to enhance
the significance of the features in the image and inspected the results
to check the accuracy of the absolute positions in the sky,
namely the location of the X-ray emission with respect to the
target galaxy.
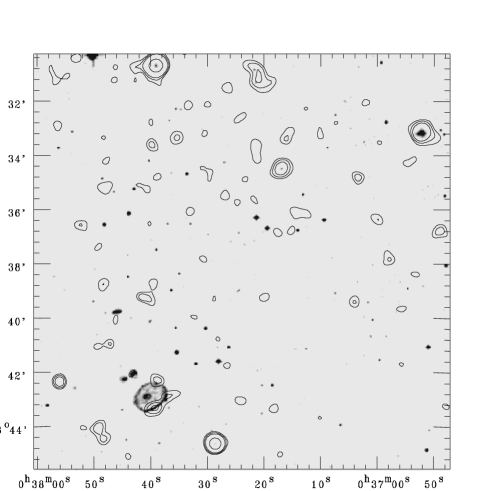
Figure 1 shows the superposition of the X-ray data smoothed with a Gaussian function with on the Digitized Sky Survey plate222The Digitized Sky Survey was produced at the Space Telescope Science Institute (STScI) under U.S. Government grant NAG W-2166.. The positioning of the X-ray emission is accurate, since several X-ray point sources coincide with their optical counterparts in the field of the Cartwheel. Searching the NED database we find that the source at RA(J2000) 00h 36m 52s and Dec(J2000) 33′ 12′′ coincide with ESO 350-IG 038 (a group or interacting pair containing a Seyfert galaxy) and the source at RA(J2000) 00h 37m 29s and Dec(J2000) 44′ 40′′ with the radio source PKS 0035-340.
In order to improve the S/N ratio we have made a selection in Pulse Height Analyzer (PHA) channels. We have extracted total counts from a 2′ diameter circle centered on the Cartwheel optical position, and plotted their distribution in PHA channels against the distribution of background counts, extracted in a nearby region devoid of sources. Selecting PHA channels 2-10 reduces the background considerably (25-30%), while retaining a large enough range in PHA channels that changes in the gain across the detector should not significantly affect our results. This PHA selection applies to all further results.
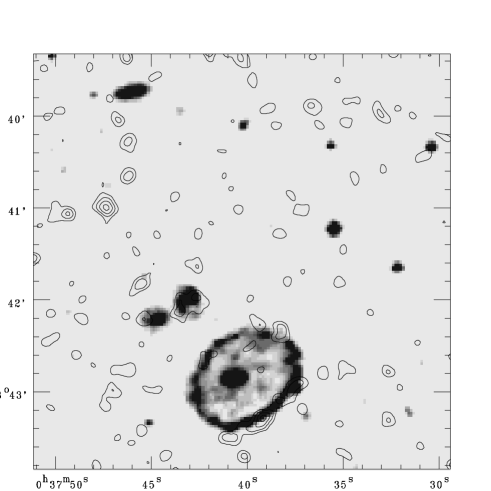
Figure 2 shows the X-ray emission from the Cartwheel galaxy and its companions, again superposed on the DSS. The data are smoothed with a Gaussian function with , that matches the HRI spatial resolution, so that the smallest resolvable features are of the order of 3 kpc at the distance of the group. As can be seen, all of the emission is located in the outer ring, while the nucleus, inner ring and spokes are not detected. In particular the emission is stronger in the Southern quadrant, where the H emission is also stronger (Higdon 1995).

To best define the location and extent of the X-ray emission relative to the optical one and to determine the background level we have derived the radial distribution of the total counts in the image by summing over all angles in radial bins centered at RA(J2000) 00h 37m 41.1s and Dec(J2000) 42′ 54.0′′ (the optical nucleus of the Cartwheel), after removal of unrelated point sources. We have chosen the inner bins such that they maximize the S/N of the emission, while the outer bins are at regular intervals of 1.6′ and are representative of the background level. The resulting profile is plotted in Figure 3. At distances greater than 150′′ the profile is flat with an average value of 0.054 cts/arcsec2.
Figure 3 confirms the conclusion of the visual inspection of the image, that all of the emission is in an annulus at -1.1′ from the nucleus, and can be attributed to the outer ring of the Cartwheel (the majority) and to the two nearmost companions G1/G2. No excess emission is detected inside the ring, or associated with the group or galaxy G3. To better show the significance of the X-ray emission related to the Cartwheel’s ring and the pair G1/G2 we plot in the inset of Figure 3 an enlargement of the profile in different azimuthal sectors. We have chosen angles and (from North to East) and their complementary regions for the 24′′ - 46′′ and 46′′ - 70′′ annuli respectively, while all other points are azimuthally averaged over all angles. The comparison between the regions of emission (solid and open dots in the inset) and their complementary regions at the same angular distance (triangles) clearly indicates the association between X-ray and optical emission in both the Southern part of the ring and the G1/G2 galaxies. The complementary regions are consistent with the background level.
To compute the flux from the Cartwheel’s ring we extracted the net counts in an elliptical annulus matching the X-ray emission from the outer ring for a total of 115.722 net counts above the derived background. We also detect 34.311.5 counts from en ellipse enclosing the G1/G2 galaxies. Given the location of the sources, near the center of the field of view, vignetting corrections are very small and are therefore ignored. The scantiness of the counts and the extremely limited spectral capabilities of the HRI prevent us from obtaining proper spectral information. We have assumed a number of different models, from a spectrum (hot gas) with kT= 0.5 – 5 keV and cosmic abundance 20% or 100%, to a (stellar sources) with = 0.5 – 2. and low energy absorption corresponding to the line-of-sight column density N cm-2 (from Dickey & Lockman, 1990). The results of the various models are virtually insensitive to the choice of parameters within the HRI band. We therefore use a mean conversion factor for which the detected count rate corresponds to a flux f erg cm-2 s-1 and to a luminosity L erg s-1 for the Cartwheel’s ring and to a flux f erg cm-2 s-1 and a luminosity L erg s-1 for the galaxy pair G1/G2. The luminosity of the ring could be as high as L erg s-1 if an intrinsic absorption of N cm-2 (corresponding to the reddening observed in the HII regions) is assumed.
A small fraction (of about 1/10) of the flux attributed to the Cartwheel might be associated with a star superposed on the outer ring (well visible in the HST image [NASA Press Release PRC96-36a, Nov. 26, 1996] and already identified as an object with the colors of a G star of 17-18 mag, Marcum et al. 92). The X-ray to optical flux ratio, estimated in a small circle at the star position, is consistent with values of G stars of this magnitude (see nomogram in Maccacaro et al. 1988).
The upper limit for point source detection at the distance of the Cartwheel is of the order of erg s-1. This is higher than what expected from a starburst nucleus (usually a few erg s-1). Therefore we cannot exclude that the nucleus presents a modest activity, below the detection limit. Also the galaxy G3, or the area corresponding to the HI bridge between the Cartwheel and G3 might show some X-ray emission at a level too faint to be detected by this observation. Since the galaxies belong to a (compact) group we have searched for extended emission from the intragroup hot gas: integrating over different areas does not result in a significant detection at the 3 level. We derive a 3 upper limit of L erg s-1 on the level of the emission from the group, within a radius of 4′, not stringent enough to exclude the presence of hot gas in the area.
4 Results
The ROSAT HRI observation shows that the X-ray emission is linked to the Cartwheel’s ring, while the nucleus and the interior of the ring are not detected. The G1/G2 pair is detected at a relatively high X-ray luminosity. Higdon (1996) gives B magnitudes for the 2 objects: the G2 is an elliptical galaxy of L for which we expect an X-ray luminosity in the range – erg s-1 and G1 is a spiral of L for which we expect a few erg s-1 (following Fig. 19 in Fabbiano et al. 1992 for the LX vs. LB relationships). The observed luminosity therefore appears higher than expected on the basis of observed properties of normal galaxies. However, the pair is believed to be interacting as suggested by HI observations (Higdon 1996) and thus a higher emission is not unlikely. Furthermore, since the number of detected counts is too small to establish if the X-ray emission is extended or not, we cannot exclude the presence of a small active nucleus in one of the two galaxies.
No emission is detected from the intragroup gas, albeit with a non-stringent upper limit. The HRI however is not very sensitive to low surface brightness emission.
A relatively high X-ray luminosity is detected from the Cartwheel, about a factor 10-30 higher than expected for a normal galaxy of the same optical luminosity (from the relationship derived in Fabbiano et al. 1992). The HRI image reveals a remarkable coincidence between the X-ray and the emission in the ring (see Higdon 1995, figures 2a-2c-2e), indicative of a close association with the star formation phenomenon. X-ray emission is higher in the area that contains the brightest HII regions (S-SW quadrant), while no emission is observed from the nucleus or the inner ring, where no star formation enhancement is detected from optical/radio/IR data. This HRI observation does not suggest a one-to-one correspondence between the location of the X-ray peaks with the bright H knots or the radio continuum sources. However, given the limited statistics, we have to postpone a reliable comparison of the details of the morphology at different wavelengths to future more sensitive observations.
While the general association with the ring is firmly established, the origin of the X-ray emission remains to be fully understood. We explore different possibilities, based on the knowledge of emission in similar environments. No ring galaxy has been detected yet in the X-ray band with a data quality that allows a firm determination of the emission mechanisms.
From the relationship between the observed IR luminosity and the X-ray emission for starburst galaxies (eg. David et al. 1992, Boller et al. 1992) we expect LX due to the total starburst contribution in the range erg s-1 for the observed IRAS luminosity of the Cartwheel L (Appleton & Struck-Marcell 1987). The X-ray luminosity observed is higher than this by a factor of a few, but smaller than what would be expected if the FIR flux were due to a Seyfert nucleus (L erg s-1, using the Boller et al. 1992 regressions for Sy nuclei). Moreover, the non-detection of a central (nuclear) source makes the discrepancy even larger. This is an independent confirmation that the IR luminosity in the IRAS band is associated with starburst and not to nuclear activity.
From the observed LX we can estimate some physical quantities, assuming that the emission is all due to a hot plasma. The density of electrons, for a temperature T= is:
where the approximate volume is derived assuming that the detected emission in the South-West region comes from a cylinder of radius 7′′ and height 72.5′′ and is V = cm3. The corresponding cooling time:
is longer than the burst lifetime. The total mass of hot gas in the volume sampled is M, to be compared with in HI derived in the entire Cartwheel galaxy from radio measurements (Higdon 1996).
On the other hand, the Cartwheel contains a relatively high number of young stars, supernovae and bright HII regions, resulting from the recent burst of star formation that can contribute substantially to the X-ray activity. Estimates based on optical and infrared data suggest the presence of a few O stars in the whole ring (Marcum et al. 1992, Fosbury & Hawarden 1977, Appleton & Struck-Marcell 1987), implying O-B type stars. Even in the generous assumption that all emit at the highest level of 1033 erg s-1 as observed in our Galaxy (Vaiana et al. 1981; Chlebowski et al. 1989), the latter would account at most for 5% of the observed luminosity. However, High Mass X-ray Binaries (HMXB) are formed about 1 every 500 O star (Fabbiano et al., 1982); as a consequence, more than 2000 HMXB could have formed in the Cartwheel. HMXB have a range of X-ray luminosities: in our Galaxy, the average LX is erg s-1, while in the Magellanic Clouds (MC), is erg s-1; the higher luminosity in the MC is believed to be linked to the lower abundances found in the Clouds (van Paradijs and McClintock, 1995). If the HMXB in the Cartwheel are of the same type found in the MC, they could contribute erg s-1, consistent with what we observe.
A confirmation of the hypothesis that HMXB are the main source of the X-ray emission from the Cartwheel will however only come from a reliable measure of the X-ray spectrum spectrum coupled with a high spatial resolution, that will become available with future X-ray missions.
It is likely that the HMXB would be located in giant HII regions, which would appear extremely bright compared to equivalent structures in our Galaxy. In fact, giant HII regions and complex structures, typically coincident with peaks of H emission, are observed in actively forming objects like the interacting system “The Antennae” (Read et al. 1995; Fabbiano et al. 1997) with intrinsic X-ray luminosities reaching several 1040 erg s-1. Around young binary systems superbubbles could also be formed, which could be detected in X-rays as bright sources. However, similar systems observed in the LMC only reach luminosities of a few 1037 erg s-1 each (e.g. Wang & Helfand, 1991).
Other phenomena might contribute to the X-ray emission of the Cartwheel, however we do not expect them to dominate on energetic grounds. We list them briefly here:
a) a phenomenon that typically heats the gas to X-ray emitting temperatures are shocks; however, strong shocks are excluded from radio and optical observations (Higdon 1996), while a shock propagating at a speed equal to the expansion velocity of the ring ( 60 km/s, from HI data; Higdon 1996, or even lower from recent H measurements; Amram et al. 1998) would heat the gas at a temperature of kT keV, quite low to be detected by the HRI. The detected counts would correspond in fact to the very improbable luminosity of a few erg s-1, for such a low temperature. The PHA distribution of the counts also argues against such an extreme case: in spite of the very poor spectral capabilities of the HRI, we would expect all the counts in the softest channel, for such low temperature. We however cannot exclude that shocks in high density environments like giant HII regions give a significant contribution. As discussed above, only the much needed spectral information will help us in this matter.
b) The ISM of the Cartwheel’s precursor (thought to be a late spiral) is unlikely, since it would have an X-ray luminosity at least 100higher than that of the ISM in normal spiral galaxies (in the 1039 erg s-1 range at most; Fabbiano 1996).
c) Supernovae and Supernova remnants (SNR) are likely to be responsible for at least a fraction of the observed emission. Given the mean X-ray luminosity of a SNR ( erg s-1 over a typical time yr; Cowie et al. 1981) the total contribution from SNR during the burst is erg s-1 for a SN rate = 1 yr-1 as measured by Fosbury & Hawarden (1977). This is a small fraction of the observed luminosity.
d) In spite of the relatively large number of young stars, coronal emission from normal stars is unlikely to contribute significantly to the observed LX, as seen above.
Even if a spectral measurement with high S/N is necessary to discriminate between the different contributions, we can however check the rough estimates of the masses required by the enhanced star formation scenario against other estimates.
To derive the total mass in stars, we can apply the results of David et al. (1992) for starburst galaxies, namely that the efficiency of producing X-rays through star formation is roughly independent of the star formation rate. If about ergs of radiant energy are produced for each solar mass consumed into stars, we expect a rate . The range quoted reflects the uncertainty on the intrinsic luminosity due to absorption. The value of is consistent with previous estimates from e.g. H measurements (Higdon 1995): 11 (high mass stars) - 67 (total stellar population).
The total mass of stars formed, M (taking into account the uncertainties in both Lx and ), is also consistent with the estimates of Fosbury & Hawarden (1977), who find assuming a mass-to-light ratio of the order of solar for the extreme population I. Using the H band luminosity from the data in Marcum et al. (1992) and the total mass in stars derived above, LH/M , consistent with the value found for HII galaxies by Oliva et al. (1995), thus strengthening the idea of a strong link between X-ray emission and star formation activity in this object .
5 Summary
The HRI observation of the Cartwheel points to a link of the X-ray emission and the star formation activity also in an environment created by a face-on encounter between two galaxies. The observed is higher than that expected from normal galaxies, and could be explained by the (high) number of HMXB created by the starburst if their X-ray luminosities are of the same order of the ones in the Magellanic Clouds. However a substantial contribution might come from a number of other sources, including the gas heated by the star formation related phenomena. The overall parameters derived, like the total mass of stars formed and the mass-to-light ratio, are in agreement with previous results obtained with observations at other wavelengths. However, a precise interpretation of the mechanism of X-ray emission in the Cartwheel’s ring is hampered by the lack of spectral resolution and sufficient statistics. Good quality spectral data and more sensitive observations are therefore necessary in order to reduce the uncertainties and to confirm our hypotheses. The upcoming AXAF and XMM satellites will provide us with the necessary tools to disentangle the problem of the origin and mechanisms of the high energy emission in this peculiar object and to add to our understanding of the star burst phenomenon.
Acknowledgements.
We thank Laura Maraschi, Catarina Lobo and Roberto Della Ceca for useful comments. GT thanks prof. Trümper for hospitality at MPE while part of this work was done. This research has made use of the NASA/IPAC Extragalactic Database (NED) which is operated by the Jet Propulsion Laboratory, CALTECH, under contract with the National Aeronautics and Space Administration (NASA). This work has received partial financial support from the Italian Space Agency.References
- (1) Amram P., Mendes de Oliveira C., Boulesteix J., Balkowski C. (1988): AA, 330, 881.
- (2) Appleton P.N. and Struck-Marcell C. (1987): ApJ 318, 103.
- (3) Appleton P.N. and Struck-Marcell C. (1995): Fund. of Cosimc Physics, 16, 111.
- (4) Athanassoula, E., Puerari I., and Bosma A. (1997): MNRAS, 286, 284.
- (5) Boller Th., Meurs E.J.A., Brinkmann W., Fink H., Zimmermann U., Adorf H.-M. (1992): AA, 261, 57.
- (6) Borne, K.D. et al. (1996): Science with the Hubble Telescope II, P. Benvenuti, F.D. Macchetto, E. Schreier eds. p. 239.
- (7) Cowie L.L., McKee C.F., Ostriker J.P. (1981): ApJ 247, 908.
- (8) Chlebowski, T., Harnden, F.R., and Sciortino, S. (1989): ApJ 341, 427.
- (9) David L.P., Jones C., & Forman W. (1992): ApJ 388, 82
- (10) Dickey J.M. & Lockman F.J. (1990): ARAA, 28, 215
- (11) Fabbiano, G. (1996): in Röntgenstrahlung from the Universe, ed. H.U. Zimmermann, J.E. Trümper & H. Yorke, MPE Report 263, p. 347.
- (12) Fabbiano, G., Feigelson, E., Zamorani, G. (1982): ApJ, 256, 397
- (13) Fabbiano, G., Kim, D.-W., Trinchieri, G. (1992): APJS, 80, 531.
- (14) Fabbiano, G., Schweizer, F., and Mackie, G. (1997): ApJ, 478, 542.
- (15) Fosbury, R.A. and Hawarden, T.G. (1977): MNRAS 178, 473
- (16) Ghigo, F.D, Wardle, J.F.C., and Cohen, N.L. (1983): AJ, 88, 1587.
- (17) Hernquist L., and Weil M., (1993): MNRAS, 261, 804.
- (18) Higdon, J.L. (1995): ApJ 455, 524.
- (19) Higdon, J.L. (1996): ApJ 467, 241
- (20) Mac Low M.-M., Chang T.H., Chu Y.-H., Points S.D., Smith R.C., Wakker B.P. (1998): ApJ 493, 260
- (21) Lynds, R. and Toomre, A. (1976): ApJ 209, 382
- (22) Marcum. P.M., Appleton, P.N. and Higdon, J. (1992): ApJ 399, 57.
- (23) Maccacaro, T. et al. (1988): ApJ 326, 680
- (24) Mulchaey J.S. et al. (1996): ApJ 456, 80
- (25) Oliva, E. Origlia, L., Kotilainen, J.K., and Moorwood, A.F.M., (1995): A&A, 301, 55.
- (26) Ponman, T.J., et al. (1996): MNRAS 283, 690
- (27) Read A.M., Ponman T.J. and Wolstencroft R.D. (1995): MNRAS 277, 397
- (28) Struck, C., Appleton, P.N., Borne, K.D. and Lucas, R.A. (1996): AJ 112, 1868
- (29) Taylor K, Atherton P.D. (1984): MNRAS, 208, 601
- (30) Theys J.C. and Spieghel A.E. (1976): ApJ 208, 650
- (31) Theys, J.C. and Spiegel, A.E. (1977): ApJ 212, 616
- (32) Toomre, A. (1978): IAU Symp. 79, p. 109
- (33) Trümper J. (1983): Adv. Sp. Res. 2, 241
- (34) Vaiana, G.S. et al. (1981): ApJ 245, 163
- (35) van Paradijs, J, & McClintock J.E. (1995): in “X-ray Binaries”, Eds. Lewin, van Paradijs and van den Heuvel, Cambridge Unversity Press, 58.
- (36) Wang Q. & Helfand D.J. (1991): ApJ 373, 497