The emission line properties of the 3CR radio galaxies at redshift one: shocks, evolution, and the alignment effect
Abstract
The results of a deep spectroscopic campaign on powerful radio galaxies with redshift , to investigate in detail their emission line gas properties, are presented. Both the 2-dimensional velocity structure of the [OII] 3727 emission line and the ionisation state of the gas are found to be strongly dependent upon the linear size (age) of the radio source in a manner indicative of the emission line properties of small (young) radio sources being dominated by the passage of the radio source shocks. The consequences of this evolution throughout the few year lifetime of the radio source are discussed, particularly with relation to the alignment of the UV–optical continuum emission of these objects along their radio axis, the nature of which shows similar evolution.
keywords:
Galaxies:active, Galaxies:interstellar medium, Radio continuum: galaxies, Shock waves1 Introduction
Powerful radio galaxies possess extremely luminous extended emission line regions, often aligned along the radio axis (e.g. McCarthy et al. 1996 and references therein). The source of ionisation of this gas has been a long standing question. Robinson et al. (1987) found that optical emission line spectra of most low redshift () radio galaxies are well explained using photoionisation models, and a similar result was found for a composite spectrum of radio galaxies with redshifts (McCarthy 1993). Photoionisation models are supported by orientation–based unification schemes of radio galaxies and radio–loud quasars (e.g. Barthel 1989), in which the radio galaxies will host an obscured quasar nucleus. On the other hand, detailed studies of individual sources (e.g. 3C171; Clark et al. 1998) have revealed features such as enhanced nebular line emission, large velocity widths and ionisation state minima coincident with the radio hotspots, indicating that the morphology, kinematics and ionisation of the gas in some sources are dominated by shocks.
Powerful radio galaxies with also show enhanced optical–UV emission, which is elongated and aligned along the radio axis in a manner similar to the line emission. In recent years we have observed a sample of 28 3CR radio galaxies with using the HST, VLA and UKIRT, to study this aligned emission (e.g. Best et al. 1997). An important result is that the nature of the alignment effect evolves with increasing size (corresponding roughly to increasing age) of the radio source (Best et al. 1996). Small radio sources show intense strings of blue knots which track the passage of the radio jets, whilst larger sources typically have much more diffuse optical–UV emission. Clearly the passage of the radio jet has an important influence on these host galaxies.
In this contribution, the first results of a program of deep spectroscopic observations on this sample of distant radio galaxies are presented. The observations are described in Section 2. The main results are presented in Sections 3 & 4, and in Section 5 the implications of these results for both the emission line gas and the alignment effect of powerful radio galaxies are discussed.
2 Sample selection and observations
From our complete HST sample of 28 3CR radio galaxies (Best et al 1997), our spectroscopic studies were restricted initially to those 18 galaxies with redshifts . Of these, 3C41, 3C65, 3C267 and 3C277.2 were not observed due to constraints of telescope time. The exclusion of these four galaxies was based upon their right ascensions, not upon source properties, and so their exclusion should not introduce any significant selection effects.
The remaining 14 galaxies were observed for between 1.5 and 2 hours each during July 1997 and February 1998, using the twin-armed ISIS spectrograph on the William Herschel Telescope. Low (Å) resolution spectra in the blue arm provided a useful observed–frame wavelength coverage of to Å, and intermediate (Å) resolution red arm spectra sampled the rest–frame wavelength range from Å to Å. This setup covered a broad range of emission lines, allowing investigation of the ionisation state of the gas, and provided reasonably high resolution data on the strong [OII] 3727 emission line, enabling the velocity structures to be determined. Details of the dataset and the data reduction techniques are given by Best et al. (1999).
3 Emission line ratios
The line ratios of CIII] 1909 / CII] 2326 and [NeIII] 3869 / [NeV] 3426 have been determined for these galaxies, the former ratio from the ISIS blue arm data, and the latter from the red arm data (where possible) or from the literature. These line ratios are particularly useful for ionisation studies for three reasons: (i) in both cases the two lines in the ratio involve the same element, and so variations in metallicity or abundance are not important; (ii) the two lines are very close in wavelength, and so differential extinction is minimised; (iii) the theoretical predictions of photoionisation and ionisation by shocks for these line ratios are very different (see below).
Theoretical predictions for these line ratios in photoionisation models have been taken from the study of Allen et al. (1998), who generated these two line ratios (amongst others) using the MAPPINGS II code (e.g. Sutherland et al. 1993) for the simple model of a planar slab of material being illuminated by power–law spectrum of ionising radiation. For two different spectral indices of the input spectrum ( with = 1 and = 1.4), and two different densities of cloud ( and 1000 cm-3), the ratios were calculated for a wide range of ionisation parameter , defined as the ratio of ionising photons striking the cloud to the density of the cloud .
Line ratios for ionisation by shocks were also calculated, using the models of Dopita and Sutherland (1996). These authors tabulated theoretical line strengths for a variety of different shock velocities (150 to 500 km s-1), and ‘magnetic parameters’ ( G cm-1.5). The line ratios were calculated both for the shocked gas, and for the combination of shocked gas with a precursor region, the latter corresponding to emission from the pre–shock gas due to ionising photons produced by the shock diffusing upstream ahead of the shock front (see Dopita and Sutherland 1996 for further discussion).
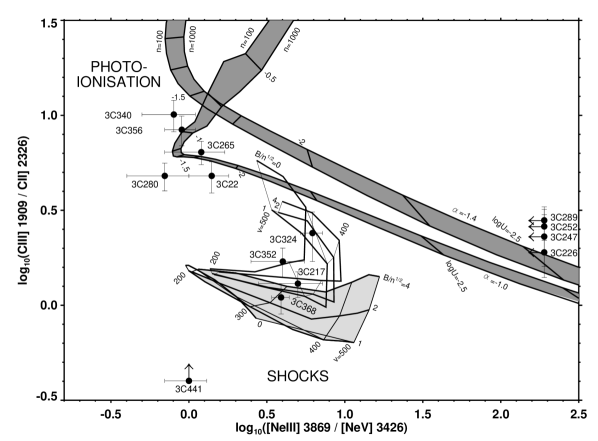
The output of these theoretical calculations are compared with the data in Figure 1. Four galaxies (3C217, 3C324, 3C352, 3C368) lie in the region of the diagram appropriate for shock ionisation, and five (3C22, 3C265, 3C280, 3C340, 3C356) lie close to the photoionisation models. The five sources plotted at the edges of the plots have no data for one of their emission lines. Interestingly, all of the four radio sources in the shock region have radio sizes smaller than 115 kpc (, km s-1 Mpc-1), and the five ‘photoionised sources’ have larger radio sizes. Smaller radio sources appear to have lower ionisation states.
4 Velocity structures of the emission line gas
The 2-dimensional [OII] 3727 velocity profiles of all 14 of the galaxies, along with their intensity distributions, are presented in Best et al. (1999). The most important aspects of those profiles are as follows.
-
There is a strong inverse correlation between the FWHM of the [OII] 3727 emission and the size of the radio source (Figure 2a). The four ‘shock–dominated’ sources from the previous section have the highest FWHM.
-
Large radio sources often have smooth ‘rotation-dominated’ velocity profiles, whilst those of small (lower ionisation; see above) sources are more distorted. Note that Baum et al. (1992) found that radio galaxies with redshifts whose emission line velocities were consistent with rotation typically had a high ionisation state ([OIII] 5007 / H); ‘non-rotators’ had lower ionisation states.
-
The [OII] 3727 line flux, normalised by the integrated K–band flux which essentially measures the stellar mass of the galaxy, correlates inversely with the radio source size. The four ‘shock–dominated’ sources all have high integrated [OII] 3727 fluxes (Figure 2b).
5 Discussion
These results can be fit together in a scenario whereby the passage of the radio bow shocks through the host galaxy dominates the kinematics and ionisation of smaller (younger) radio sources, but large radio sources are more relaxed and photoionisation from the AGN dominates. As the jet passes through the emission line regions: (1) the emission line gas will be accelerated by the shock, giving rise to the larger observed FWHM, and the distorted [OII] velocity structures; (2) the shock will provide additional ionising photons, increasing the [OII] line emission; (3) the emission line clouds will be compressed by the shock, leading to a decrease in the degree of ionisation of the gas.

Together with the results of Best et al (1996,1998) that the aligned optical–UV emission is tightly associated with the radio jet, these results suggest that radio source shocks are also important for the continuum alignment effect. Shock excitation of the emission–line clouds will give rise to an enhanced contribution of nebular continuum emission in small sources (e.g. see Dickson et al 1995). Radio jet shocks may also induce the formation of massive knots of bright young stars, which will disperse and fade over the lifetime of the source. These two mechanisms would each account for both the tight alignment of the optical–UV continuum emission along the radio jet and the observed variation in the luminosity of this emission with radio size. Moreover, shocks may also be responsible for disrupting optically thick clouds along the radio jet direction and exposing previously hidden dust grains (Bremer et al 1997); this would give rise to an enhanced contribution of scattered light, distributed in a non–biconical manner.
In conclusion, these results show that the passage of the radio induced shocks through the host galaxy of powerful radio sources plays a key role in producing the emission line gas properties of these sources. Much of the continuum alignment effect may have its origin in these same shocks.
Acknowledgements.
The WHT is operated on the island of La Palma by the Isaac Newton Group in the Spanish Observatorio del Roches de los Muchachos of the Instituto de Astrofisica de Canarias. This work was supported in part by the Formation and Evolution of Galaxies network set up by the European Commission under contract ERB FMRX– CT96–086 of its TMR programme. We are grateful to Mark Allen for supplying the output of the MAPPINGS II code in digitised form, and to Matt Lehnert for useful discussions.References
- [1] llen M.G., Dopita M.A., Tsvetanov Z.I., 1998, ApJ, 493, 571
- [2] arthel P.D., 1989, ApJ, 336, 606
- [3] aum S.A., Heckman T.M., van Breugel W.J.M., 1992, ApJ, 389, 202
- [4] est P.N., Longair M.S., Röttgering H.J.A. 1996, MNRAS, 280, L9
- [5] est P.N., Longair M.S., Röttgering H.J.A. 1997, MNRAS, 292, 758
- [6] est P.N., Carilli C.L., Garrington S.T., Longair M.S., Röttgering H.J.A. 1998, MNRAS, 299, 357
- [7] est P.N., Röttgering H.J.A., Longair M.S., 1999, MNRAS, submitted
- [8] remer M.N., Fabian A.C., Crawford C.S., 1997, MNRAS, 284, 213
- [9] lark N., Axon D., Tadhunter C., Robinson A., O’Brien P., 1998, ApJ, 494, 546
- [10] ickson R., Tadhunter C., Shaw M., Clark N., Morganti R., 1995, MNRAS, 273, L29
- [11] opita M.A., Sutherland R.S., 1996, ApJS, 102, 161
- [12] cCarthy P.J., 1993, ARAA, 31, 639
- [13] cCarthy P.J., Baum S.A., Spinrad H., 1996, ApJS, 106, 281
- [14] obinson A., Binette L., Fosbury R.A.E., Tadhunter C.N., MNRAS, 227, 97
- [15] utherland R.S., Bicknell G.V., Dopita M.A., 1993, ApJ, 414, 510