\headnoteAstron. Nachr. 319 (1998) 6, 347 – 368 \makeheadline
The ROSAT Bright Survey:
I. Identification of an AGN sample with hard ROSAT X-ray spectra
††thanks: Based on observations at the European Southern Observatory
La Silla (Chile) with the telescope of the
Max-Planck-Society
The ROSAT Bright Survey (RBS) aims to completely optically identify the more than 2000 brightest sources detected in the ROSAT all-sky survey at galactic latitudes (excluding LMC, SMC, Virgo cluster). This paper presents a subsample of 66 bright point-like ROSAT survey sources with almost hard PSPC spectra, the hardness ratio HR1 is for most of the sources. The subsample could be nearly completely identified by low-resolution optical spectroscopy with the following breakdown into object classes: 31 Seyfert galaxies, 22 BL Lac candidates, 5 clusters of galaxies, 1 cataclysmic variable, and 5 bright stars. Only one object remained unidentified and one X-ray source was a spurious detection. The redshift distribution peaks around 0.06 for the Seyferts and around 0.13 for the BL Lac candidates. Observations with medium spectral resolution were obtained for most of the new Seyfert galaxies. A large fraction (20 objects) are type 1 Seyfert galaxies, the other fraction includes Seyfert galaxies of type 1.5 – 1.8 (5 objects), two LINERs, and 4 possible narrow-line Seyfert 1 galaxies (NLS1). About one third of the new Seyfert’s have nearby companion galaxies displaying either emission or absorption lines at the same redshift. Among them are a couple of systems showing direct morphological evidence for interaction. The large fraction of interacting galaxies among our sample suggests a scenario where interaction is the main trigger of AGN activity. END \keywAGN – interacting galaxies – surveys: X-ray – surveys: AGN END
1 Introduction
Active galactic nuclei (AGNs) of different types are the major contributors to the extragalactic X-ray background (XRB). According to recent models by e.g. Comastri et al. (1995) the spectrum of the XRB can be reproduced over the broad energy range 5 – 100 keV by AGN populations with different amounts of absorption, up to cm-2, which undergo strong cosmological evolution. In addition, Compton reflection which is likely associated with the accretion disk, plays an important role in shaping the XRB-spectrum (e.g. Pounds et al. 1990).
Major uncertainties in synthetic XRB-spectra are introduced by uncertain number-flux relations, luminosity functions and their cosmological evolution. Major observational impact, therefore, comes from the definition of statistically significant samples of AGNs using X-ray data. The first such sample (Piccinotti et al. 1982), defined using HEAO-1 data, comprised only 34 AGN (energy band 2 – 10 keV). The soft X-ray band has been opened by the Einstein observatory and the optical identifications of the Extended Medium Sensitivity Survey sources (EMSS, Gioia et al. 1990, Stocke et al. 1991, Maccacaro et al. 1994), which revealed about 450 AGNs in the 0.3 – 3.5 keV passband. The launch of ROSAT finally, the all-sky survey (RASS) performed in 1990/1991 and the ongoing guest investigator program using both detectors onboard, the PSPC and the HRI, allowed to identify large samples of AGNs from wide-angle to shallow surveys using the same well-calibrated instrument in the passband 0.1 – 2.4 keV. The deepest survey has been performed in the Lockman Hole reaching a flux limit of erg cm-2 s-1 in a field (Hasinger et al. 1998, Schmidt et al. 1998). The surveys performed by Mason et al. (1998; RIXOS, see also Puchnarewicz et al. 1996, 1997) and Appenzeller et al. (1998; see also Zickgraf et al. 1997) reached flux limits of erg cm-2 s-1 and erg cm-2 s-1 in and fields, respectively. A first all-sky sample drawn from the RASS with soft PSPC-spectra and countrates s-1 have very recently been published by Thomas et al. (1998), another large-area sample based on the RASS has been published by Bade et al. (1995, 1998) with a survey area of 8480 deg2. The latter authors correlated the RASS with sources identified on Schmidt plates exposed in the framework of the Hamburg Quasar Survey HQS.
Here we report on the identification of another sample of point-like X-ray sources drawn from the RASS with relatively hard X-ray spectra (in ROSAT terms). This work was started as a pilot program for the larger project of identifying all bright, high-galactic latitude X-ray sources found in the RASS, the so-called ROSAT Bright Survey (RBS), which aims to the complete identification of all bright X-ray sources irrespective their X-ray colour and their X-ray extent.
This paper is organized in the following way: In chapter 2 we describe the X-ray properties of our sample, the selection strategy for sources to be identified spectroscopically and give an identification summary for previously known sources. Chapter 3 gives details of our optical observations and the analysis. Our results are summarized in chapter 4 where positions and identifications of the optical counterparts of the X-ray sources are listed. Finding charts and optical spectra of the new objects are presented in the appendix. Preliminary results of this work have been described in Hasinger et al. (1997).
2 Selection of X-ray sources
The work described here is embedded in a larger project, the ROSAT Bright Survey (RBS), which aims to establish a complete, X-ray selected, flux-limited, all-sky sample of AGN’s. This aim is achieved by optical identification of all point-like X-ray sources at high galactic latitudes and above a certain X-ray countrate during the ROSAT all-sky survey (RASS). Inspection of catalogued ROSAT X-ray sources revealed, that the fraction of AGN’s in a sample of X-ray sources becomes higher with harder X-ray color. In the first step of the whole project with the results presented here we tried to maximise the likely AGN content of the subsample by applying a hardness ratio criterion for HR1. The hardness ratio HR1 is defined as (H+S)/(H–S), with the ROSAT-PSPC count rates H in the hard band ( keV) and S in the soft band ( keV). Our original subsample was based on the SASS 1 processed RASS and comprised all sources at high galactic latitude, , brighter than PSPC s-1 with hardness ratio HR1 . We excluded sources within circles of radius centred on () = (), (), and (), respectively, i.e.sources within directions to the Magellanic clouds and the Virgo cluster.
| X-ray Position | Count Rate | Hardness | ||||||||||||
|---|---|---|---|---|---|---|---|---|---|---|---|---|---|---|
| RHS | RBS | 1RXS J… | RA(2000) | DE(2000) | D | CR | ratio | |||||||
| No. | No. | ∘ | ′ | ′′ | ′′ | HR1 | ||||||||
| 01 | 0042 | 00 | 18 | 27.8 | 47 | 30 | P | 07 | 0.46 | 0.04 | 0.36 | 0.07 | ||
| 02 | 0045 | 00 | 20 | 20.7 | 34 | 51 | P | 13 | 0.31 | 0.04 | 0.74 | 0.08 | ||
| 03 | 0078 | 00 | 34 | 22.2 | 05 | 26 | P | 10 | 0.51 | 0.05 | 0.57 | 0.09 | ||
| 04 | 0082 | 00 | 35 | 14.9 | 15 | 13 | P | 08 | 0.24 | 0.02 | 0.35 | 0.11 | ||
| 05 | 0094 | 00 | 40 | 53.2 | 42 | 02 | P | 08 | 0.42 | 0.04 | 0.34 | 0.08 | ||
| 06 | 0104 | 00 | 43 | 53.3 | 24 | 22 | H | 06 | 0.50 | 0.05 | 0.75 | 0.06 | ||
| 07 | 0140 | 00 | 58 | 17.1 | 23 | 00 | P | 08 | 0.33 | 0.03 | 0.74 | 0.07 | ||
| 08 | 0157 | 01 | 09 | 08.0 | 16 | 10 | H | 05 | 0.38 | 0.04 | 0.65 | 0.07 | ||
| 09 | 0161 | 01 | 10 | 50.0 | 54 | 56 | P | 07 | 0.75 | 0.07 | 0.34 | 0.08 | ||
| 10 | 01 | 25 | 58.1 | 18 | 14 | P | 10 | 0.21 | 0.02 | 0.58 | 0.12 | |||
| 11 | 0258 | 01 | 56 | 00.2 | 02 | 06 | P | 09 | 0.31 | 0.03 | 0.69 | 0.08 | ||
| 12 | 0279 | 02 | 06 | 40.0 | 48 | 16 | H | 05 | 0.23 | 0.06 | 0.89 | 0.20 | ||
| 13 | 0281 | 02 | 07 | 02.5 | 30 | 35 | P | 10 | 0.20 | 0.03 | 0.81 | 0.10 | ||
| 14 | 0298 | 02 | 16 | 32.3 | 14 | 48 | P | 10 | 0.38 | 0.04 | 0.82 | 0.07 | ||
| 15 | 0345 | 02 | 42 | 15.2 | 30 | 37 | P | 08 | 0.49 | 0.05 | 0.56 | 0.09 | ||
| 16 | 02 | 45 | 24.3 | 35 | 18 | P | 10 | 0.18 | 0.03 | 0.61 | 0.14 | |||
| 17 | 0379 | 03 | 00 | 07.6 | 30 | 24 | P | 07 | 0.33 | 0.03 | 0.91 | 0.04 | ||
| 18 | 0381 | 03 | 01 | 38.1 | 55 | 20 | H | 06 | 0.21 | 0.03 | 0.90 | 0.07 | ||
| 19 | 0384 | 03 | 03 | 30.0 | 54 | 25 | P | 10 | 0.27 | 0.03 | 0.87 | 0.07 | ||
| 20 | 0400 | 03 | 14 | 23.7 | 19 | 58 | H | 05 | 0.53 | 0.04 | 0.96 | 0.02 | ||
| 21 | 03 | 16 | 12.6 | 04 | 46 | H | 05 | 0.14 | 0.02 | 0.87 | 0.08 | |||
| 22 | 0425 | 03 | 27 | 38.6 | 09 | 38 | P | 08 | 0.22 | 0.03 | 0.78 | 0.10 | ||
| 23 | 0444 | 03 | 34 | 24.5 | 13 | 26 | P | 09 | 0.29 | 0.03 | 0.49 | 0.07 | ||
| 24 | 0487 | 03 | 52 | 57.7 | 31 | 20 | P | 08 | 0.58 | 0.08 | 0.92 | 0.06 | ||
| 25 | 04 | 41 | 54.5 | 26 | 39 | P | 08 | 0.20 | 0.02 | 0.80 | 0.07 | |||
| 26 | 0665 | 05 | 35 | 27.5 | 22 | 47 | P | 08 | 0.21 | 0.03 | 0.42 | 0.12 | ||
| 27 | 0679 | 05 | 43 | 57.3 | 32 | 06 | P | 07 | 0.69 | 0.03 | 0.67 | 0.03 | ||
| 28 | 0702 | 08 | 27 | 13.6 | 28 | 30 | P | 07 | 0.23 | 0.02 | 0.53 | 0.09 | ||
| 29 | 0712 | 08 | 38 | 11.0 | 53 | 36 | P | 12 | 0.21 | 0.03 | 0.74 | 0.10 | ||
| 30 | 0797 | 09 | 47 | 13.2 | 23 | 18 | P | 08 | 0.27 | 0.03 | 0.78 | 0.06 | ||
| 31 | 0921 | 10 | 56 | 07.0 | 52 | 15 | P | 09 | 0.59 | 0.06 | 0.76 | 0.06 | ||
| 32 | 0980 | 11 | 24 | 07.8 | 12 | 56 | P | 08 | 0.42 | 0.03 | 0.54 | 0.06 | ||
| 33 | 1028 | 11 | 45 | 15.2 | 40 | 53 | H | 05 | 0.37 | 0.03 | 0.79 | 0.04 | ||
| 34 | 1068 | 12 | 07 | 11.5 | 46 | 02 | H | 05 | 0.22 | 0.05 | 1.00 | 0.26 | ||
| 35 | 1080 | 12 | 13 | 23.4 | 18 | 08 | H | 05 | 0.29 | 0.04 | 0.82 | 0.10 | ||
| 36 | 1161 | 12 | 48 | 43.1 | 54 | 25 | H | 08 | 0.41 | 0.05 | 0.44 | 0.11 | ||
| 37 | 1279 | 13 | 31 | 13.6 | 24 | 06 | P | 07 | 0.67 | 0.05 | 0.63 | 0.06 | ||
| 38 | 1329 | 13 | 54 | 20.2 | 55 | 48 | P | 07 | 0.83 | 0.05 | 0.36 | 0.05 | ||
| 39 | 1372 | 14 | 19 | 22.2 | 38 | 35 | H | 05 | 1.22 | 0.09 | 0.46 | 0.06 | ||
| 40 | 1411 | 14 | 37 | 03.5 | 42 | 36 | P | 07 | 0.25 | 0.03 | 0.57 | 0.08 | ||
| 41 | 1424 | 14 | 45 | 05.9 | 26 | 14 | P | 08 | 0.25 | 0.03 | 0.68 | 0.10 | ||
| 42 | 1429 | 14 | 47 | 25.6 | 27 | 33 | P | 10 | 0.28 | 0.03 | 0.50 | 0.10 | ||
| 43 | 1431 | 14 | 47 | 38.6 | 33 | 23 | H | 05 | 0.25 | 0.03 | 0.73 | 0.09 | ||
| 44 | 1434 | 14 | 49 | 32.9 | 46 | 22 | H | 05 | 0.42 | 0.03 | 0.49 | 0.06 | ||
| 45 | 15 | 06 | 36.4 | 40 | 11 | P | 10 | 0.14 | 0.02 | 0.51 | 0.13 | |||
| 46 | 1467 | 15 | 08 | 42.5 | 09 | 09 | H | 05 | 0.33 | 0.03 | 0.54 | 0.08 | ||
| 47 | 1478 | 15 | 16 | 18.7 | 23 | 47 | P | 08 | 0.40 | 0.04 | 0.94 | 0.03 | ||
| 48 | 1497 | 15 | 23 | 46.0 | 44 | 27 | H | 05 | 0.32 | 0.04 | 0.89 | 0.06 | ||
| 49 | 1499 | 15 | 24 | 51.4 | 06 | 06 | P | 08 | 0.31 | 0.03 | 0.79 | 0.06 | ||
| 50 | 1505 | 15 | 30 | 49.4 | 26 | 02 | P | 09 | 0.26 | 0.03 | 0.49 | 0.11 | ||
| 51 | 1507 | 15 | 31 | 40.9 | 19 | 27 | P | 09 | 0.23 | 0.03 | 0.60 | 0.10 | ||
| 52 | 1509 | 15 | 32 | 53.7 | 21 | 04 | P | 08 | 0.24 | 0.03 | 0.75 | 0.09 | ||
| 53 | 1524 | 15 | 40 | 16.4 | 55 | 04 | P | 07 | 0.49 | 0.03 | 0.38 | 0.05 | ||
| 54 | 1620 | 17 | 02 | 45.5 | 53 | 30 | P | 07 | 0.41 | 0.02 | 0.70 | 0.03 | ||
| 55 | 1634 | 17 | 17 | 07.1 | 31 | 21 | H | 06 | 0.28 | 0.02 | 0.72 | 0.06 | ||
| 56 | 1688 | 20 | 39 | 27.0 | 18 | 50 | H | 05 | 0.43 | 0.04 | 0.65 | 0.07 | ||
| 57 | 1787 | 21 | 50 | 15.6 | 10 | 48 | P | 10 | 0.58 | 0.05 | 0.70 | 0.07 | ||
| 59 | 1882 | 22 | 40 | 17.3 | 03 | 14 | H | 05 | 0.48 | 0.05 | 0.70 | 0.07 | ||
| 60 | 1888 | 22 | 43 | 41.9 | 31 | 06 | P | 11 | 0.30 | 0.07 | 0.49 | 0.20 | ||
| 61 | 2005 | 23 | 25 | 54.6 | 53 | 10 | P | 07 | 0.56 | 0.04 | 0.63 | 0.05 | ||
| 62 | 2036 | 23 | 41 | 06.5 | 38 | 05 | P | 08 | 0.21 | 0.02 | 0.87 | 0.07 | ||
| 63 | 2040 | 23 | 43 | 13.5 | 37 | 50 | H | 05 | 0.24 | 0.05 | -0.58 | 0.17 | ||
| 64 | 2045 | 23 | 47 | 28.8 | 27 | 44 | P | 07 | 0.26 | 0.02 | 0.75 | 0.05 | ||
| 65 | 2051 | 23 | 50 | 18.0 | 59 | 28 | P | 08 | 0.32 | 0.03 | 0.53 | 0.09 | ||
| 66 | 2061 | 23 | 55 | 48.6 | 30 | 32 | H | 05 | 0.26 | 0.03 | 0.61 | 0.10 | ||
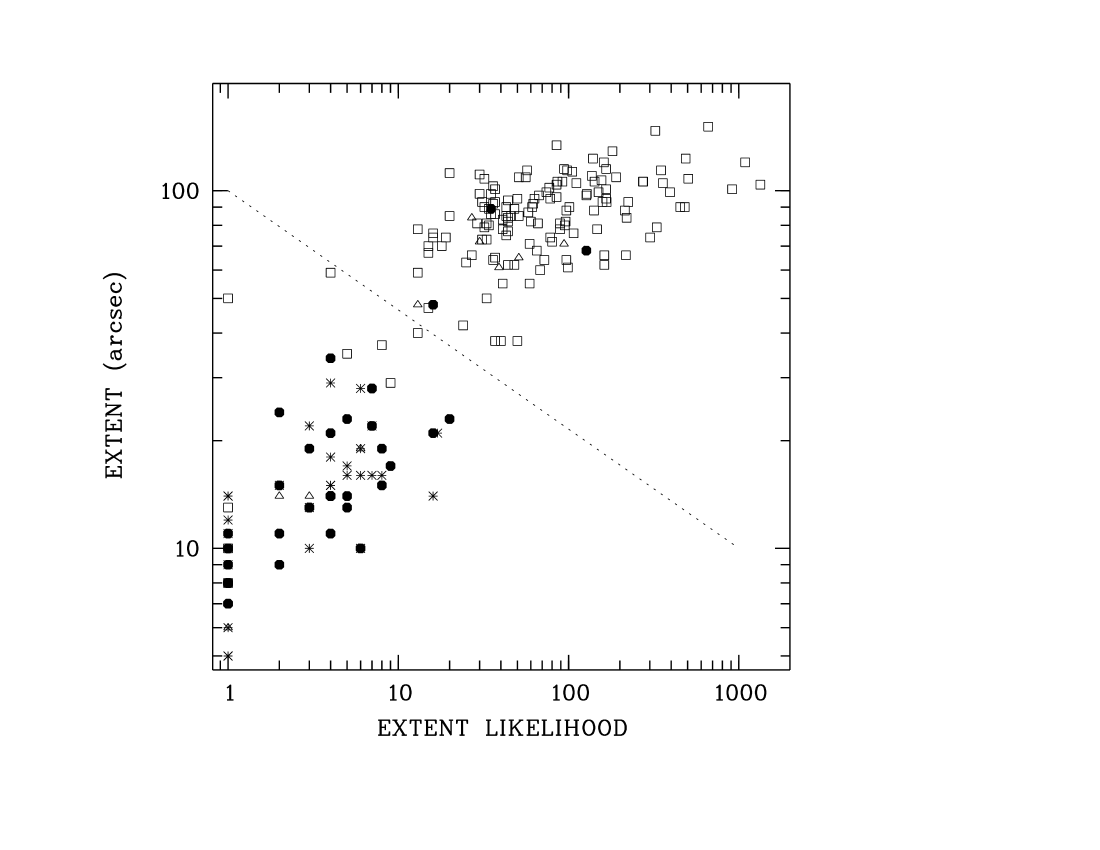
The distribution of objects on the celestial sphere is shown in Fig. 1 in Hasinger et al. (1997). The whole survey area is 20 391 deg2. After elimination of 37 sources in the Virgo, LMC, SMC regions we were left with 351 sources. Their positions were correlated with the major optical, radio and infrared catalogues using SIMBAD and the NED. A large fraction of 76% (268 sources) could be identified this way with the following breakdown into object classes: 140 clusters of galaxies, 46 AGNs, 23 unspecified galaxies, 11 nearby normal galaxies, 34 active stars (including coronally active stars, CVs and XRBs), and 14 SNRs (see Hasinger et al. 1997). Only 83 objects remained unidentified or were catalogued as galaxies (active or inactive) but without measured redshifts. Up to this point all bright, hard RASS X-ray sources were considered. Among these 83 sources a number of clusters were expected. We excluded these by application of an X-ray extent criterion (Fig. 1). The SASS reveals two quantities addressing the extent of an X-ray source, the measured extent and the extent likelihood (see Voges et al. 1996). By plotting these quantities for the identified sources a clear distinction between the extended X-ray sources (galaxies, clusters) in the upper right and the point-like X-ray sources in the lower left part of the diagram could be established. The dashed line in the figure defines our dividing line, only sources below this line were considered for optical identification, 15 cluster candidates above the line are excluded. Two further sources turned out to be X-ray ghosts by inspection of the X-ray images derived from the RASS. Finally, we were left with 66 point-like X-ray sources with unidentified optical counterparts which were suspected AGN-candidates.
| Grism # | Wavelength range (Å) | Dispersion (Å/Pixel) |
|---|---|---|
| 1 | 3400 – 9200 | 8.4 |
| 3 | 3520 – 5470 | 1.9 |
| 5 | 5800 – 8400 | 2.5 |
| 6 | 4600 – 7200 | 2.7 |
| 8 | 4640 – 5950 | 1.3 |
| 10 | 6600 – 7820 | 1.2 |
Table 1 contains the X-ray positions, ROSAT-PSPC count rates and hardness ratios of these sources. We refer to individual sources by ”RHS” (for ROSAT Hard Survey) followed by a sequence number as given in Table 1. As mentioned above, the RHS was a sort of pathfinder project within the larger ROSAT Bright Survey (RBS). The RHS-sources thus form a subsample of the RBS, whose identification is still in progress and a catalogue paper is in preparation (Schwope et al. 1998). We, therefore, also list in Tab. 1 the sequence number of the RHS-sources in the RBS-sample. The RBS is derived from the ROSAT All-sky Bright Source Catalogue (1RXS, Voges et al. 1996), based on the merged data SASS 2 whereas at the beginning of the project, when the RHS was defined, only a preliminary processing step of the RASS (SASS 1) was available. The advanced processing eliminated ghosts and changed the survey positions, countrates, X-ray colors or the information about the X-ray extent of several X-ray sources. This notion explains why some of the RHS-sources listed in Tab. 1 have hardness ratios smaller than the original limit of 0.5 and why other sources have count rates smaller than the original limit of 0.2 s-1. Consequently, some of the sources selected for the RHS are no longer part of the RBS whereas new sources came in. This means that the RHS is statistically not complete, it is, nevertheless, a step in the identification of the whole RBS. The positions given in Tab. 1 are the best available for the sources in the sample, they are not exclusively drawn from the ROSAT Bright Source Catalogue (Voges et al. 1996). Whenever possible we used coordinates from our HRI pointings. In order to allow a comparison between survey coordinates and those derived from pointed observations, we include in Tab. 1 also the 1RXS-names of the sources. Count rates and hardness ratios are those from the 1RXS-catalog with the exception of RHS10, where we used the SASS1-processed survey data. Although the existence as X-ray source of RHS10 is not in doubt it did not pass the SASS 2 processing step and did not enter the 1RXS-catalog due to its large attitude uncertainty caused by the presence of only one visible guide star. RHS58 turned out to be an X-ray ghost (by an HRI-pointing of the authors and the SASS 2 process). Both sources were therefore eliminated from the 1RXS-catalogue. The other sources contained in Tab. 1 without RBS-entry (16, 21, 25, 45) are confirmed X-ray sources but have revised countrates below 0.2 s-1, the defining threshold of the RBS sample.
3 Optical identifications
Finding charts for the likely optical counterparts of the X-ray emitters were produced using the APM/ROE-scans of the POSS/ESO/SERC Schmidt-plates. In most cases only one or two likely candidates for the optical counterparts were detected in the X-ray error circles. A few sources had no likely optical counterpart and were proposed for short observations with the high-resolution imager HRI onboard ROSAT in order to improve on the X-ray positions and to search for a possible X-ray extent.
Optical observations of the AGN candidates took place on several occasions since 1994 using the ESO/MPG 2.2m telescope at La Silla, the SAO 6m telescope at Zelentschuk, the 3.5m telescope at Calar Alto and the 10m Keck telescope. All these telescopes were equipped with low-resolution spectrographs and CCDs as detectors, yielding spectra with typical resolution of 8–12 Å FWHM over the spectral range 3500 – 9000 Å. The ‘working horse’ of our program, the ESO/MPG 2.2m telescope, was equipped with the ESO Faint Object Spectrograph and Camera (EFOSC2), which also allows to take CCD images of the X-ray fields with a field of view of about . For most of the northern RBS-sources we have only images from the digitized sky survey plates.
With EFOSC2 at the ESO/MPG 2.2m-telescope, we took at least low resolution spectra with grism G#1, which gave spectra with about 40 Å FWHM spectral resolution (see Table 2 for a list of grism properties). Spectra with higher resolution using one of the other grisms were taken for emission line objects if telescope time was available.
During all spectroscopic observation runs spectra of standard stars were taken which allowed a spectrophotometric calibration of the target spectra with estimated 50% accuracy or better in the center of the spectra. Since the spectra were not in general taken at the parallactic angle, they suffer from light losses at the blue or red end of the wavelength range covered. Hence, the flux decrease below 4500 Å seen in several spectra should not be taken too literally.
We determined -band magnitudes for our targets by folding the spectra through a corresponding filter curve. These magnitudes are listed in Tab. 3, which collects the results of our identification program. For extended objects like normal galaxies, cluster galaxies or AGNs with a strong underlying galaxy contribution even these rather crude brightness estimates are superior to those from the APM scans which gives often spurious results for these types of objects.
Since the main aim of the present study and the project in which it is embedded is the definition of a large, statistically complete, X-ray selected AGN sample, we did not obtain spectra of bright stars, , which are very likely coronal emitters. This applies to the sources with RHS sequence numbers 16, 28, and 36, respectively.
The optical spectra were analysed and classified in a manner similar to those described in related papers on identification of X-ray sources (see e.g. Stocke et al. 1991 for the EMSS or Appenzeller et al. 1998 for identification of RASS-sources in selected areas). In Fig. 2 a flow chart used for classification of the objects is presented. Additional information on the nature of the X-ray sources was derived from X-ray data (RASS or pointed observations), which was used to discriminate between point-like emission from an AGN or extended emission from a cluster.
We applied multi-component spectral fits to the emission-line AGN in order to determine their subtype. Usually four Gaussian components were fitted to the H/[O iii] and the H/[N ii] complex, thus allowing for broad and narrow Balmer lines as well as narrow forbidden lines. The narrow components of allowed and forbidden lines were restricted to the same redshift and the same width. The redshifts of the broad and narrow Balmer lines were not determined separately but set by definition to the same values.
During the course of the project we became aware that our emission-line AGNs are often accompanied by galaxies of similar brightness separated by several galaxy radii (in all cases the companions were located outside the X-ray error circles). In order to test if these are physical or apparent companions and to address the question of AGN activity triggered by interaction we took low-resolution spectra of them if telescope time was available. Hence, the census of interacting Seyfert galaxies given in the next chapter is incomplete and a more comprehensive study is necessary.
It is known from previous X-ray surveys (e.g. Maccacaro et al. 1988) that BL Lac objects are characterized by the highest -ratio and this does apply to our sample too, hence, they belong optically to the faintest objects. The discrimination between e.g. the noisy spectrum of a normal field galaxy, a cluster galaxy and a BL Lac object is therefore not easy. Indications pointing to a BL Lac nature of a specific source are: absence of emission lines, optical continuum emission preferentially blue, contrast of the Ca-break smaller than 30%, stellar-like appearance on an optical image, point-like X-ray emission. Usually a combination of these features applies to a BL Lac object. The tentative classification as BL Lac is supported if a strong radio flux is observed and if the candidate source lies in the region of the diagram usually populated by this source class. The use of such diagrams for classification was discussed by Stocke et al. (1991) and Nass et al. (1996). A few BL Lac spectra show bumps and/or troughs in the continuum (associated with e.g. the G-band or the Ca ii break) or absorption lines from the underlying host galaxy. In these cases redshifts were determined by subtracting a smooth continuum and crosscorrelation of the residuum with a zero-velocity template spectrum.

| Optical Position | ||||||||||||||
|---|---|---|---|---|---|---|---|---|---|---|---|---|---|---|
| RHS | RA(2000) | DE(2000) | Class | Type | z | Note | ||||||||
| No. | ∘ | ′ | ′′ | ′′ | mag | cgs | mJy | |||||||
| 01 | 00 | 18 | 27.8 | 47 | 32 | 02 | AGN | BL | 0.100 | 19.4 | 4.3 | 34.7 | C,1 | |
| 02 | 00 | 20 | 21.7 | 34 | 45 | 16 | AGN | Sy1 | 0.163 | 17.4 | 3.7 | |||
| 03 | 00 | 34 | 16.6 | 05 | 21 | 16 | AGN | Sy1 | 0.074 | 15.4 | 5.7 | |||
| 04 | 00 | 35 | 14.9 | 15 | 04 | 09 | AGN | BL | 16.3 | 2.1 | 18.7 | |||
| 05 | 00 | 40 | 52.9 | 42 | 10 | 10 | AGN | Sy1 | 0.055 | 16.5 | 3.7 | |||
| 06 | 00 | 43 | 52.0 | 24 | 21 | 18 | CLG | 0.083 | 17.2 | 5.8 | 49.9 | C,2 | ||
| 07 | 00 | 58 | 16.7 | 23 | 14 | 15 | AGN | BL | 20.3 | 3.8 | 9.2 | 1 | ||
| 08 | 01 | 09 | 08.2 | 16 | 07 | 04 | AGN | BL | 16.6 | 4.2 | 90.8 | |||
| 09 | 01 | 10 | 49.9 | 55 | 02 | 07 | AGN | BL | 0.234 | 17.9 | 6.4 | 17.4 | C | |
| 10 | 01 | 25 | 58.0 | 18 | 12 | 02 | AGN | Sy1 | 0.111 | 17.5 | 2.3 | |||
| 11 | 01 | 56 | 00.2 | 02 | 13 | 07 | AGN | BL | 0.080 | 19.8 | 3.6 | C,1 | ||
| 12 | 02 | 06 | 39.0 | 48 | 21 | 07 | AGN | Sy1 | 0.260 | 18.8 | 2.8 | 501.0 | 3 | |
| 13 | 02 | 07 | 02.2 | 30 | 46 | 12 | AGN | Sy1.8 | 0.111 | 16.8 | 2.6 | 1613.1 | 4 | |
| 14 | 02 | 16 | 32.1 | 14 | 47 | 03 | AGN | BL | 17.9 | 5.1 | 35.7 | 5 | ||
| 15 | 02 | 42 | 14.6 | 30 | 36 | 09 | AGN | Sy1 | 0.069 | 16.0 | 5.1 | 3.1 | I | |
| 16 | 02 | 45 | 24.1 | 35 | 22 | 05 | STAR | 7.9 | 2.3 | 6 | ||||
| 17 | 03 | 00 | 08.0 | 30 | 15 | 10 | AGN | Sy1 | 0.035 | 16.4 | 5.0 | |||
| 18 | 03 | 01 | 38.2 | 55 | 15 | 05 | CLG | 0.170 | 18.0 | 2.9 | 393.6 | C,2 | ||
| 19 | 03 | 03 | 30.1 | 54 | 17 | 08 | AGN | BL | 0.196 | 17.9 | 3.9 | 29.6 | C | |
| 20 | 03 | 14 | 23.9 | 19 | 57 | 03 | AGN | BL | 17.9 | 8.7 | 29.3 | |||
| 21 | 03 | 16 | 12.8 | 04 | 43 | 04 | AGN | BL | 18.2 | 2.3 | 55.4 | |||
| 22 | 03 | 27 | 39.2 | 09 | 50 | 13 | STAR | dKe | 11.7 | 2.5 | ||||
| 23 | 03 | 34 | 24.4 | 13 | 40 | 14 | AGN | Sy1.5 | 0.035 | 15.8 | 3.0 | 4.7 | I,7 | |
| 24 | 03 | 52 | 57.4 | 31 | 19 | 02 | CLG: | 0.087 | 17.1 | 7.9 | 175.0 | C,8 | ||
| 25 | 04 | 41 | 53.9 | 26 | 34 | 10 | AGN | Sy1: | 0.044 | 15.7 | 2.5 | 9 | ||
| 26 | 05 | 35 | 26.7 | 22 | 45 | 09 | AGN | Sy1.5 | 0.065 | 16.8 | 1.9 | |||
| 27 | 05 | 43 | 57.3 | 32 | 08 | 02 | AGN | BL | 17.4 | 8.3 | ||||
| 28 | 08 | 27 | 13.9 | 28 | 38 | 08 | STAR | 10.6 | 2.3 | 6 | ||||
| 29 | 08 | 38 | 11.1 | 53 | 44 | 08 | AGN | Sy1: | 0.028 | 16.3 | 2.4 | 65.6 | I,10 | |
| 30 | 09 | 47 | 12.5 | 23 | 14 | 04 | AGN | LINER | 0.354 | 19.2 | 3.0 | 22.4 | ||
| 31 | 10 | 56 | 06.6 | 52 | 13 | 06 | AGN | BL | 0.235 | 19.5 | 6.8 | 4.3 | ||
| 32 | 11 | 24 | 07.3 | 12 | 47 | 13 | AGN | Sy1.5-1.8 | 0.036 | 16.2 | 4.3 | |||
| 33 | 11 | 45 | 16.3 | 40 | 52 | 03 | AGN | Sy1/NLS1 | 0.006 | 15.2 | 4.5 | |||
| 34 | 12 | 07 | 11.5 | 46 | 06 | 04 | AGN | BL: | 20.5 | 3.0 | 4.3 | 11 | ||
| 35 | 12 | 13 | 23.0 | 18 | 07 | 06 | AGN | BL | 0.278 | 19.0 | 3.9 | 7.3 | ||
| 36 | 12 | 48 | 43.1 | 54 | 22 | 03 | STAR | G0 | 8.9 | 3.7 | 12 | |||
| 37 | 13 | 31 | 13.7 | 24 | 02 | 04 | AGN | Sy1.5-1.8 | 0.026 | 15.7 | 7.7 | 12.9 | 13 | |
| 38 | 13 | 54 | 20.0 | 55 | 50 | 03 | AGN | Sy1 | 0.026 | 15.4 | 7.0 | 3.7 | 14 | |
| 39 | 14 | 19 | 22.2 | 38 | 41 | 06 | AGN | Sy1 | 0.022 | 14.9 | 12.1 | 13.4 | I,15 | |
| 40 | 14 | 37 | 03.4 | 42 | 27 | 10 | CV | NL | 20.5 | 2.6 | 16 | |||
| 41 | 14 | 45 | 06.2 | 26 | 12 | 03 | AGN | BL | 17.2 | 2.9 | 21.6 | |||
| 42 | 14 | 47 | 26.0 | 27 | 12 | 22 | CLG: | 0.190 | 19.9 | 2.6 | 17 | |||
| 43 | 14 | 47 | 38.5 | 33 | 26 | 03 | AGN | Sy1 | 0.196 | 16.4 | 3.2 | |||
| 44 | 14 | 49 | 32.7 | 46 | 21 | 02 | AGN | BL | 0.225 | 18.6 | 3.9 | 90.1 | ||
| 45 | 15 | 06 | 37.0 | 40 | 05 | 11 | 20.0 | 1.5 | ||||||
| 46 | 15 | 08 | 42.8 | 09 | 10 | 04 | AGN | BL | 18.5 | 3.3 | 39.9 | |||
| 47 | 15 | 16 | 18.5 | 23 | 45 | 04 | AGN | BL | 19.6 | 5.7 | 8.0 | |||
| 48 | 15 | 23 | 46.0 | 44 | 25 | 02 | STAR | dKe | 11.3 | 4.3 | ||||
| 49 | 15 | 24 | 51.4 | 05 | 59 | 07 | AGN | Sy1 | 0.144 | 17.3 | 4.3 | 18 | ||
| 50 | 15 | 30 | 49.5 | 26 | 05 | 04 | AGN | Sy1/NLS1 | 0.216 | 16.7 | 2.6 | |||
| 51 | 15 | 31 | 41.2 | 19 | 29 | 06 | AGN | Sy1/NLS1 | 0.051 | 17.2 | 2.5 | |||
| 52 | 15 | 32 | 53.7 | 20 | 55 | 09 | AGN | LINER | 0.362 | 19.1 | 2.6 | 23.8 | ||
| 53 | 15 | 40 | 15.7 | 55 | 05 | 01 | AGN | BL | 17.6 | 4.5 | 69.9 | 19 | ||
| 54 | 17 | 02 | 44.1 | 53 | 28 | 07 | AGN | Sy1 | 0.053 | 16.4 | 4.6 | 4.3 | 20 | |
| 55 | 17 | 17 | 07.0 | 31 | 20 | 01 | CLG | 0.275 | 19.6 | 3.1 | 3.2 | 21 | ||
| 56 | 20 | 39 | 27.0 | 18 | 53 | 03 | AGN | Sy1/NLS1 | 0.080 | 16.0 | 4.8 | 5.9 | ||
| 57 | 21 | 50 | 15.5 | 10 | 50 | 03 | AGN | BL | 0.229 | 18.5 | 6.6 | 68.3 | C | |
| 60 | 22 | 43 | 41.5 | 31 | 38 | 33 | AGN | BL | 0.226 | 20.0 | 3.1 | 10.5 | C | |
| 61 | 23 | 25 | 54.4 | 53 | 16 | 07 | AGN | Sy1 | 0.120 | 15.9 | 6.2 | 6.0 | I | |
| 62 | 23 | 41 | 06.3 | 38 | 09 | 05 | AGN | Sy1 | 0.041 | 16.5 | 2.7 | 5.1 | I | |
| 63 | 23 | 43 | 13.5 | 37 | 54 | 04 | AGN | Sy1 | 0.622 | 16.0 | 0.6 | 10.3 | ||
| 64 | 23 | 47 | 28.7 | 27 | 46 | 03 | AGN | Sy1 | 0.157 | 17.1 | 3.1 | I | ||
| 65 | 23 | 50 | 17.9 | 59 | 28 | 01 | AGN | BL | 0.515 | 19.5 | 3.2 | 25.1 | C | |
| 66 | 23 | 55 | 48.2 | 30 | 32 | 05 | AGN | Sy1 | 0.057 | 16.1 | 2.8 | 12.4 | I,22 | |
Notes:
I: Interacting Seyfert galaxy
C: Redshift determined by crosscorrelation with a zero-velocity template spectrum
1: Nass et al. (1996)
2: Crawford et al. (1995)
3: PKS0205-720
4: 3C59
5: Object ’A’ on the chart with BL Lac-type spectrum, object ’B’ has faint, red spectrum without emission lines, probably a normal galaxy
6: Identification inferred from the Digitized Sky Survey
7: Very active companion galaxy ’B’ with Seyfert-type spectrum, companion ’C’ has Seyfert-type spectrum too, but at a redshift of 0.15, and does not belong to the group
8: Galaxies ’A’ and ’B” have redshifts of 0.087 and 0.088, respectively, and are probable cluster galaxies. No X-ray extent in the RASS, rather small Ca ii break with contrast 30%, therefore BL Lac classification not completely excluded
9: 1ES0439-085
10: MRK1218, Keel (1996)
11: Uncalibrated, noisy spectrum without emission lines; single faint optical counterpart only
12: SIMBAD
13: ESO509-G038
14: MRK663
15: ESO511-G030
16: H Balmer and He i emission, no He ii
17: Spectrum of a normal galaxy, several faint galaxies around, no X-ray extent, the brighter objects below the X-ray error circle are normal stars with no indication for activity. The spectrum of the galaxy has a rather small contrast of 30% in the Ca ii break, we cannot exclude therefore a BL Lac classification
18: HE1522-0955
19: 1ES1544+820
20: UGC10697
21: Point-like X-ray emission in RASS, extended in HRI-pointing
22: VV 697, IRAS 23532+2513, Zou et al. (1995)
4 Results
The results of our spectroscopic observations are summarized in Tab. 3, in the appendix we show the spectra on which our classification is based (Figs. 6 and 7). We do not show the spectra of the galaxy clusters and of the active stars. Finding charts are reproduced in Fig. 5. In total we obtained spectra for 60 of the original 66 fields which formed the RHS. We did not obtain spectra for the bright stars, which are the likely counterparts of RHS16, RHS28, and RHS36, but we regard their identification as coronal emitters as certain. After the start of the optical identification work we became aware, that a few fields we were working on did not reveal likely counterparts. We then observed those fields with the high resolution imager onboard ROSAT in order to improve on the accuracy of the X-ray positions and to search for extended X-ray emission. As a result of these short HRI-pointings (typical exposure time 2 ksec) the positions of some X-ray sources were shifted considerably. One of the original sources turned out to be a ghost image (RHS58), the revised positions of two further sources were matching those of catalogued objects (RHS36, a bright star, and RHS59, a Seyfert 1.8 galaxy) and thus were not observed spectroscopically.
After all, only the field of RHS45 remained unobserved. Since the SASS-2 processed RASS gives a countrate for that object below 0.2 s-1 we finally did not attempt to classify this object spectroscopically. Some other identifications remain ambiguous due to low signal-to-noise in our spectra. This applies exclusively to objects without emission lines, hence, the identification of or discrimination between BL Lac objects, galaxy clusters and normal galaxies might in some cases be doubtful. These cases are discussed in the notes to Tab. 3.
Table 3 is organized in the following way: the first column is the RHS-sequence number, columns 2 to 7 contain the equatorial coordinates of the objects that have been spectroscopically observed, column 8 shows the positional difference between the optical and the X-ray coordinates as listed in Tab. 1, columns 9 and 10 labeled ’Class’ and ’Type’ give the identification of the X-ray sources, column 11 (labeled ) holds the redshift as far as it could be determined, column 12 (labeled ) lists the optical brightness, column 13 the integrated X-ray flux between 0.5 and 2.0 keV, column 14 the radio flux at 1.4 GHz and the last column labeled ’Note’ references notes at the end of the table. Most optical brightness values are derived from actually observed spectra, for RHS34 and the bright stars magnitudes from the APM-scans are listed. The X-ray flux given in the table is the unabsorbed flux in units of erg -1 cm-2 s-1 and has been computed assuming a power law spectrum with energy index (Hasinger et al. 1993) taking into account the galactic column density towards the source. The radio fluxes are taken from the NRAO/VLA Sky Survey (NVSS, Condon et al. 1998), except those for RHS12 and #24 which were taken from the Parkes-MIT-NRAO survey (PMN, Griffith & Wright 1993). The PMN-fluxes, given at 4.85 GHz, were transformed to those at 1.4 GHz assuming a power law with energy index (Stocke et al. 1991).
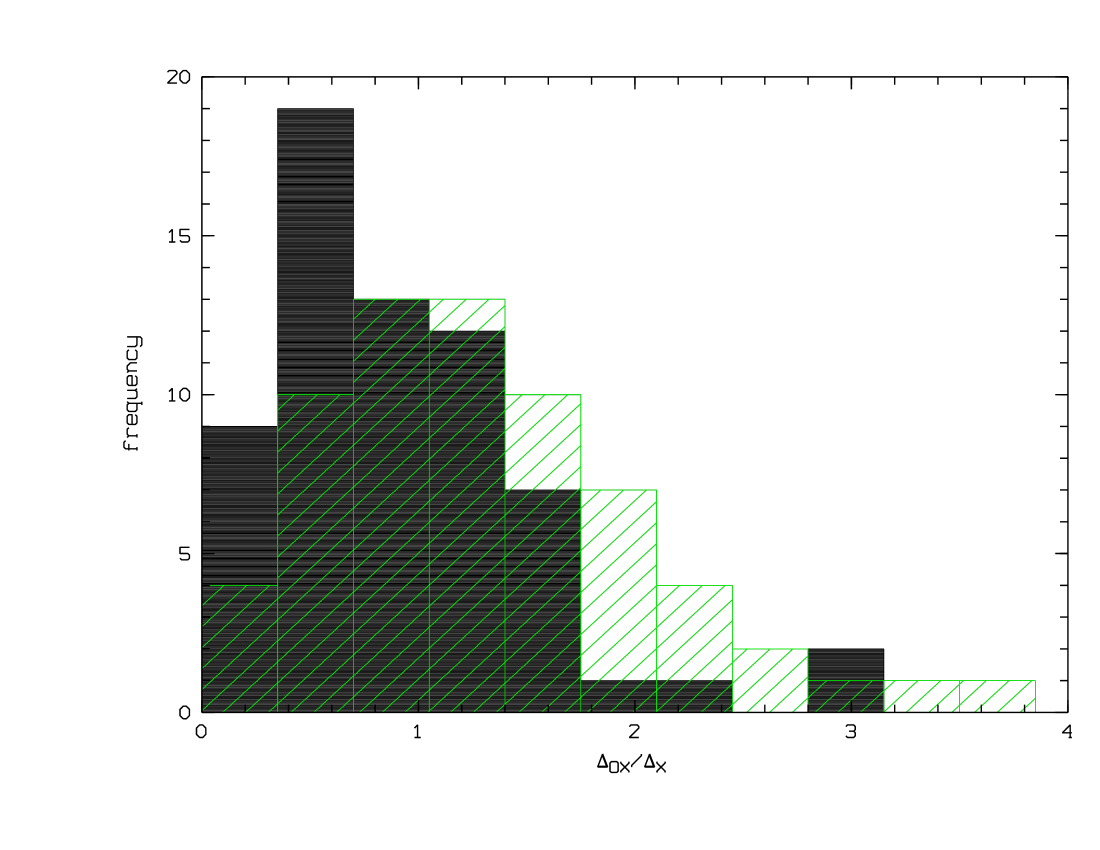
The distribution of the separations between the X-ray sources and the identified optical counterparts, normalized to 1 positional uncertainty, is shown in Fig. 3. The result expected for a 2d-Gaussian distribution of positional offsets is included in the figure. The 90%-confidence error radius is derived from the 1- positional uncertainties and given in the 1RXS catalogue as ( as given in Tab. 1). There is no excess of the observed distribution over the Gaussian, the contrary seems to be true. This might be slightly indicative of too large estimated errors for the X-ray positions. In the diagram the observed cluster galaxies have been included. Since the center of the X-ray emission of a cluster and the optical position of the observed galaxy do not necessarily coincide, the good positional coincidence as expressed in Fig. 3 is even more surprising. Only one cluster, RHS06, is located at . The statistics of the normalized separations between X-ray and optical positions confirms that the proposed counterparts are very likely the correct identifications.
In sum, only one X-ray source, which after SASS-2 processing of the RASS does not further obey the original selection criteria, remains unidentified. All others have almost secure optical identifications, a few cases remain ambiguous (see notes to Tab. 3). Our sample contains 5 coronally active stars and one faint cataclysmic variable star, all other 59 X-ray sources are of extragalactic origin. Not so surprisingly since we tried to exclude this type of X-ray source we find only five (#6, #18, #24, #42, #55) clusters of galaxies in our sample. After SASS-2 processing RHS6 has migrated into the upper right regime of Fig. 1, RHS55 lies on and RHS42 near to the dotted dividing line between extended and point-like objects whereas RHS18 and RHS24 lie well inside the regime usually populated by AGNs. An HRI-pointing, however, has revealed clearly extended X-ray emission from RHS18 and the identification as cluster can be regarded as certain. Short pointed X-ray observations of RHS24 and RHS42 are necessary in order to ascertain their identification. For the time being, an identification as BL Lac object cannot be excluded for these two sources.
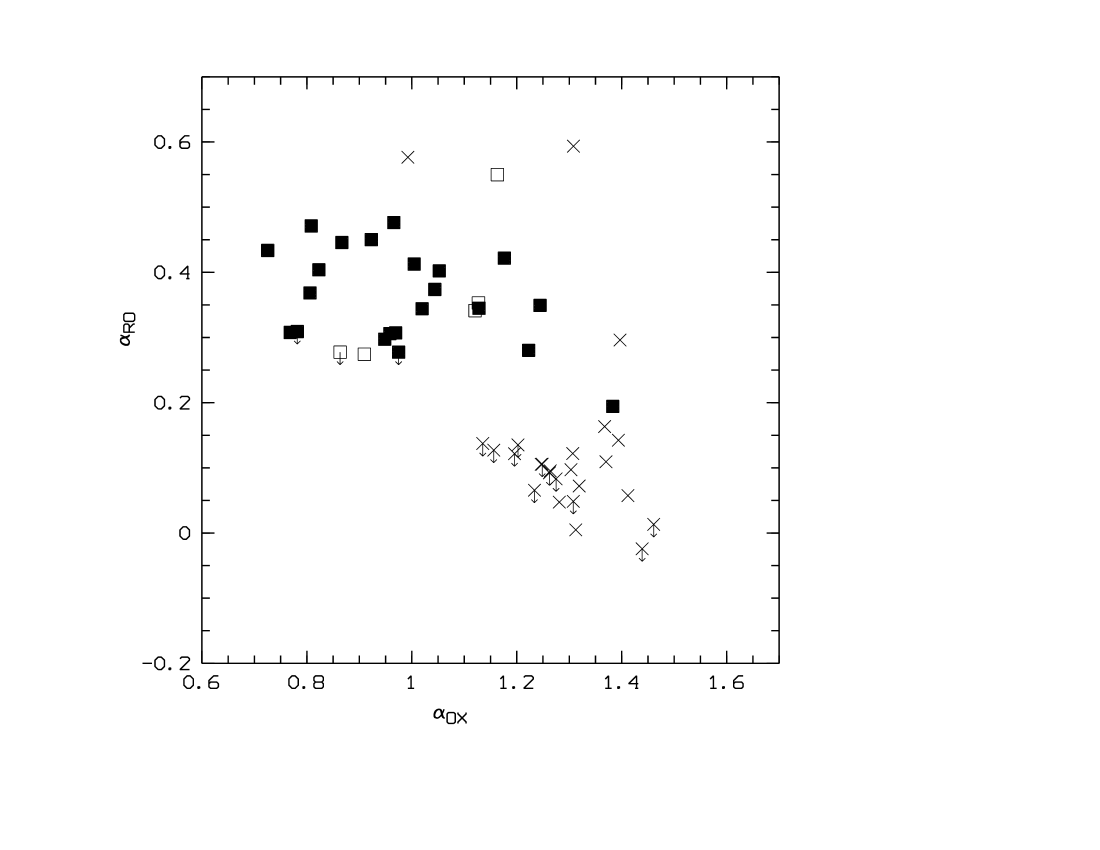
The large majority of the RHS X-ray sources turned out to be AGNs (Seyfert galaxies and BL Lac objects). The fraction of BL Lac objects, about one third of the total number of RHS-sources, is high. These sources have not been noticed previously due to their low optical brightness and they pop up here because of their high energy output in the X-ray regime. The use of the high -ratio in order to search new BL Lac objects in X-ray surveys has been discussed by Nass et al. (1996). In Fig. 4 we show the locations of our new identifications in the plane. For calculation of the corresponding values of our sources we were using the radio flux at 1.4 GHz, the optical flux at 6000 Å, and the X-ray flux at 1 keV. The objects labeled in Tab. 3 as BL Lac objects are found in a narrow strip centered on which supports our identification (cf. Nass et al. 1996, Stocke et al. 1991). The only exception is RHS04 which is found in the vicinity of the radio quiet emission-line AGNs. From its optical spectrum it is, however, a certain BL Lac object. The diagram gives no further clue to the nature of the RHS24 and 42, which are both found in the region populated by BL Lac objects, since the regions populated by clusters and BL Lacs have a large overlap.
Most of the AGNs in the RHS sample are emission line objects of different subclasses, including two LINERs, 5 Seyfert galaxies of types , and 4 possible narrow-line Seyfert 1 galaxies (NLS1) but the majority of them being of Seyfert type 1. Some of the objects listed in Tab. 3 were previously catalogued, we mention e.g. Mrk1218, Mrk663 or VV697 (RHS29, 38, and 66, respectively). However, when the project was started, their nature as Seyfert galaxies or their redshifts were unknown and these galaxies were included therefore in our identification program. With the exception of RHS12 and 13 all emission line AGNs are radio quiet.
Among the new Seyfert-type AGNs a surprisingly large fraction is in interaction with a nearby single companion or in a small group. We have eight confirmed examples (marked ’I’ in column ’Note’ of Tab. 3) with a redshift difference between Seyfert and companion and a few more candidates. CCD images and spectra of the confirmed cases are shown in Fig. 8. From the APM finding charts or from CCD images we tentatively identified a couple of further possible cases (#12, #13, #17, #25, #37, #38 and #43). It turned out by low-resolution spectroscopy of the galaxies labeled ’B’ on the finding charts (Fig. 5) of RHS12 and 43, respectively, that these galaxies are apparent companions only (RHS12B: normal galaxy, z=0.049; RHS43B: emission line galaxy at z=0.129). Some of the companion galaxies itself show indication of activity by e.g. enhanced star formation visible in their optical spectra as prominent H emission lines (RHS 15, 23, 61, 66). The eight certain cases together with the five possible cases (RHS13, 17, 25, and 38) represent between 26% and 42% of all new emission-line AGNs. This large fraction of interacting Seyfert galaxies is clearly much higher than that found in an optically selected sample (Rafanelli et al. 1995 found a 12% excess of galaxy-Seyfert pairs over galaxy-galaxy pairs) and supports recent scenarios of tidal interaction triggering starburst and Seyfert activity (see e.g. Cavaliere & Vittorini 1998, Bahcall et al. 1997).
Acknowledgements.
We thank Klaus Reinsch (Göttingen) for providing the spectra for RHS33 and RHS54. We acknowledge many helpful comments of the referee T. Maccacaro. The ROSAT project is supported by the Bundesministerium für Bildung, Wissenschaft, Forschung und Technologie (BMBF/DLR) and the Max-Planck-Gesellschaft. We thank the ROSAT team for performing the All-Sky Survey and producing the RASS Bright Source Catalogue. This research has made use of the SIMBAD database operated at CDS, Strasbourg, France, and the NASA/IPAC Extragalactic database (NED) operated by the Jet Propulsion Laboratory, California Institute of Technology under contract with the National Aeronautics and Space Administration. Identification of the RASS X-ray sources was greatly facilitated by use of the finding charts based upon the COSMOS scans of the ESO/SERC J plates performed at the Royal Observatory Edinburgh and APM catalogue based on scans of the red and blue POSS plates performed at the Institute of Astronomy, Cambridge, UK. Based in part on photographic data of the National Geographic Society – Palomar Observatory Sky Survey (NGS-POSS) obtained using the Oschin Telescope on Palomar Mountain. The NGS-POSS was funded by a grant from the National Geographic Society to the California Institute of Technology. The plates were processed into the present compressed digital form with their permission. The Digitized Sky Survey was produced at the Space Telescope Science Institute under US Government grant NAG W-2166. This work has been supported in part by the DLR (former DARA GmbH) under grant 50 OR 9403 5.References
- [] Appenzeller, I., Thiering, I., Zickgraf, F.-J., et al.: 1998, ApJS117, 319
- [] Bade, N., Engels, D., Voges, W., et al.: 1998, \aaas127, 145
- [] Bade, N., Fink, H.H., Engels, D., Voges, W., Hagen H.-J., Wisotzki, L., Reimers, D.: 1995, \aaas110, 469
- [] Bahcall, J.N., Kirhakos, S., Saxe, D.H., Schneider, D.P.: 1997, ApJ479, 642
- [] Cavaliere, A., Vittorini, V.: 1998, Proceedings 12th Postdam Cosmology Workshop, World Scientific, in press (astro-ph/9712295)
- [] Comastri, A., Setti, G., Zamorani, G., Hasinger G.: 1995, Astron. Astrophys. 296, 1
- [] Condon, J.J., Cotton, W.D., Greisen, E.W., Yin, Q.F., Perley, R.A., Taylor, G.B., Broderick, J.J.: 1998, AJ115, 1693
- [] Crawford, C. S., Edge, A. C., Fabian, A. C., et al.: 1995, MNRAS274, 75
- [] Gioia, I.M., Maccacaro, T., Schild, R.E., Wolter, A., Stocke, J.T., Morris, S.L., Henry, J.P.: 1990, Astrophys. J. Suppl. 72, 576
- [] Griffith, M., Wright, A.E.: 1993, AJ105,1666
- [] Hasinger, G., Burg, R., Giacconi, R., et al.: 1993, \aaa275, 1
- [] Hasinger, G., Fischer, J.-U., Schwope, A.D., Boller, T., Trümper, J., Voges, W.: 1997, Astron. Nachr. 318 (6), 329
- [] Hasinger, G., Burg, R., Giacconi, R., et al.: 1998, \aaa329, 482
- [] Keel, W.C.: 1996, ApJS106, 27
- [] Maccacaro, T., Gioia, I.M., Wolter, A., Zamorani, G., Stocke, J.T.: 1988, ApJ326, 680
- [] Maccacaro, T., et al.: 1994, Astrophys. Lett. and Commun. 29,267
- [] Mason, K.O., Carrera, F.J., Hasinger, G., et al.: 1998, MNRAS, submitted
- [] Nass, P., Bade, N., Kollgard, R.I., et al.: 1996, \aaa309, 419
- [] Pounds, K.A., Nandra, K., Stewart, G.C., George, I.M., Fabian, A.C.: 1990, Nature 344, 132
- [] Piccinotti, G., Mushotzky, R.F., Boldt, E.A., Holt, S.S., Marshall, F.E., Serlemitsos, P.J., Shafer, R.A.: 1982, Astrophys. J. 253, 315
- [] Puchnarewicz, E.M., Mason, K.O., Romero-Colmenero E., et al.: 1996, Mon. Not. R. Astron. Soc. 281, 1243
- [] Puchnarewicz, E.M., Mason, K.O., Carrera, F.J., et al.: 1997, Mon. Not. R. Astron. Soc. 291, 177
- [] Rafanelli, P., Violato, M., Baruffolo, A.: 1995, Astron. J. 109(4), 1546
- [] Schmidt, M., Hasinger, G., Gunn, J., et al.: 1998, \aaa329, 495
- [] Stocke, J.T., Morris, S.L., Gioia, I.M., et al.: 1991, ApJS76, 813
- [] Thomas, H.-C., Beuermann, K., Reinsch, K., Schwope, A.D., Trümper, J., Voges, W.: 1998, Astron. Astrophys. 335, 467
- [] Voges, W., Aschenbach, B., Boller, Th., et al.: 1996, to be published in A&A
- [] Zickgraf, F.-J., Thiering, I., KrautterJ., et al.: 1997, Astron. Astrophys. Supp. 123, 103
- [] Zou, Z.-L., Xia, X.-Y., Deng, Z.-G., Wu, H.: 1995, \aaa304, 369
Hermann Brunner, Astrophysikalisches Institut Potsdam,
An der Sternwarte 16, D-14482 Potsdam, Germany,
e-mail: HBrunner@aip.de
\rfJens-Uwe Fischer, Astrophysikalisches Institut Potsdam,
An der Sternwarte 16, D-14482 Potsdam, Germany,
e-mail: JUFischer@aip.de
\rfGünther Hasinger, Astrophysikalisches Institut Potsdam,
An der Sternwarte 16, D-14482 Potsdam, Germany,
e-mail: GHasinger@aip.de
\rfAxel Schwope, Astrophysikalisches Institut Potsdam,
An der Sternwarte 16, D-14482 Potsdam, Germany,
e-mail: ASchwope@aip.de
\rfThomas Boller, Max-Planck-Institut für extraterristrische Physik,
D-85740 Garching, Germany,
e-mail: bol@mpe-garching.mpg.de
\rfJoachim Trümper, Max-Planck-Institut für extraterristrische Physik,
D-85740 Garching, Germany,
e-mail: jtrumper@mpe-garching.mpg.de
\rfWolfgang Voges, Max-Planck-Institut für extraterristrische Physik,
D-85740 Garching, Germany,
e-mail: whv@mpe-garching.mpg.de
\rfSergej Neizvestny, SAO RAS, Nizhnij Arkhyz, Zelenchukskaya,
Karachaevo-Cherkesia, Russia, 357147