Molecular Gas in The Cartwheel Galaxy ††thanks: based on observations made with the Swedish-ESO Submillimeter Telescope (SEST) at La Silla, Chile
Abstract
We present the first detection of molecular gas in the Cartwheel, the prototype of a collisional ring galaxy formed in the head-on encounter of two galaxies. Until now, only very little atomic gas and no CO had been detected in the centre, where gas is theoretically expected to pile up. Using the Swedish ESO Submm Telescope, we detected both 12CO(1–0) and (2–1) line emission towards the central position. The line ratio and the line widths suggest that the CO(2–1) emission is sub-thermal and that the CO(1–0) emission arises within the central 22′′ (13 kpc); it is probably associated with the inner ring and nucleus. We infer a mass of molecular gas (H2) of 1.5 to 6 M⊙, which is significantly higher than the M⊙ of atomic gas within that region. The low excitation of the gas, whether it is due to a low temperature or a low density, is consistent with the weak star-forming activity observed in the centre of the Cartwheel.
Key Words.:
Galaxies: individual: AM 0035-33 – Galaxies: individual: The Cartwheel – Galaxies: ISM – Radio lines: galaxies1 Introduction
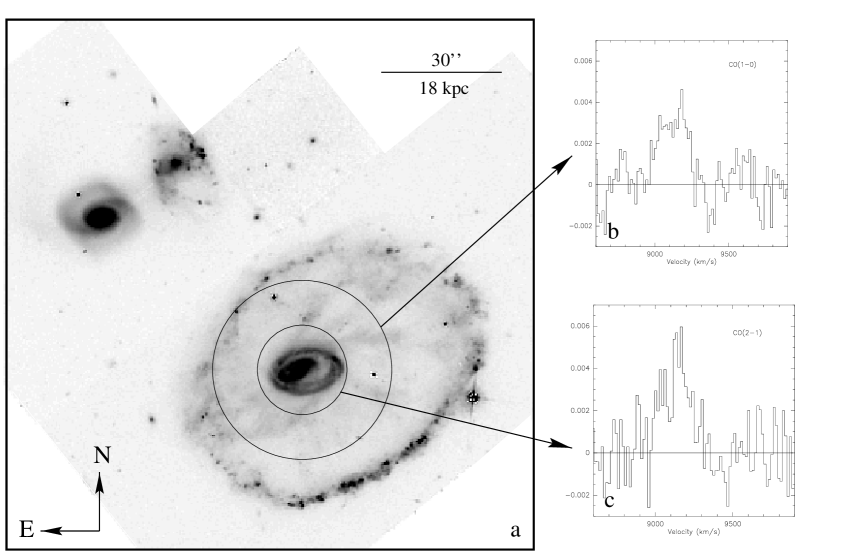
The Cartwheel Galaxy, discovered by Zwicky (zwicky (1941)), earned its nickname from the prominent system of spokes which connects the bright outer ring to the inner ring (see Figure 1). The nature of the Cartwheel was elucidated by early numerical simulations, which showed convincingly that such ring systems can form when a companion galaxy plunges through the centre of a larger rotating disk (Lynds & Toomre lt (1976); Theys & Spiegel ts (1976)). The passage of the “intruder” triggers a ring-wave that propagates through the disk of the “target” galaxy and induces massive star formation in a well-defined ring.
In contrast to most merging galaxies in which star formation is significantly enhanced in a very small area (the very centre), ring galaxies exhibit starbursts on a large scale. Most observed ring galaxies have blue colours and elevated CO, H, far-infrared and radio continuum emission (see Appleton & Struck-Marcell rings (1996) for a review). Because of the simple geometry of the interaction, they appear as textbook examples to study the effects that a collision has on the interstellar medium of a galaxy and to follow the chronology of the star-formation in the expanding ring.
The Cartwheel Galaxy, because of its well-defined inner and outer rings, is considered as the prototype of its class. It has been the subject of several observational studies as well as dynamical modeling (Struck-Marcell & Higdon curt_jim (1993); Hernquist & Weil hw (1993); Mihos & Hernquist mihos (1994)). Optical and near-IR imaging showed strong radial colour gradients in the disk interior to the outer ring, which may trace the evolution of the stellar population in the wake of the density wave (Marcum et al. marcum (1992)). HST images have revealed with unprecedented detail the distribution of massive young clusters in the outer ring, as well as the diffuse and knotty structure of the spokes (Borne et al. borne (1997); Appleton et al. iau (1998)).
The outer ring of the Cartwheel ( 70 in diameter) is expanding, has blue colours and is populated by massive star-forming regions (Higdon jim_ha (1995), Amram et al. amram (1998)). Most of the star formation occurs in the southern quadrant of the ring, where the H emission, as well as the 20 cm and 6 cm radio continuum emission peak (Higdon jim_hi (1996)). Spectroscopy of a few H ii regions in the outer ring indicates a low metallicity (Fosbury & Hawarden fh (1976)). Most of the atomic gas (Hi ) is associated with the outer ring. The detection of a massive Hi plume extending more than 80 kpc in projection in the direction of a companion galaxy (G3) suggests that G3 rather than one of the two nearer companions collided with the Cartwheel and produced its present-day appearance (Higdon jim_hi (1996)).
The inner ring ( 18 in diameter) and nucleus of the Cartwheel seem gas-poor and until recently, no evidence of star formation could be found. This is in disagreement with the models that predict an infall of gas towards the centre and vigorous star formation in the inner ring (Struck-Marcell & Appleton cp (1987)). However, a number of recent observations has revealed a richer environment in the inner regions of the Cartwheel:
i) The HST images resolve a network of dust lanes in the inner ring and luminous kiloparsec-size cometary structures which are suggestive of massive dense clouds traveling through the ambient gas (Struck et al. struck (1996)).
ii) H emission has been detected at a low level throughout the inner ring and nucleus (Amram et al. amram (1998), Higdon et al. jim_baas (1997)).
iii) ISOCAM images show strong 7 m and 15 m emission in the inner ring and nucleus. The mid-IR fluxes indicate the presence of hot dust and are consistent with weak star formation activity (Charmandaris et al. vassilis (1998)).
These new results strengthened our expectation that molecular gas must be present in the central region of the Cartwheel. Previous searches for 12CO(J=1–0) line emission had been unsuccessful, and the Cartwheel was one of the two galaxies that remained undetected in the survey of 16 ring galaxies of Horellou et al. (1995). Here, we present the first 12CO(1–0) and 12CO(2–1) detections towards the centre of the Cartwheel. For =75 km s-1 Mpc-1, the distance to the galaxy is 121 Mpc.
2 Observations and Data Reduction
We have observed at =00h37m40.8s, =42′56.9′′ (J2000), which is the peak of emission of the Cartwheel nucleus in the HST I–band image.
The observations have been carried out in July 1998 in La Silla (Chile) with the 15m Swedish-ESO Submillimeter Telescope (SEST) (Booth et al. booth (1989)). We used the IRAM 115 and 230 GHz receivers to observe simultaneously at the frequencies of the 12CO(1–0) and the 12CO(2–1) lines. At 115 GHz and 230 GHz, the telescope half-power beam widths are 43′′ and 22′′, respectively. The main-beam efficiency of SEST is =0.68 at 115 GHz and 0.46 at 230 GHz (SEST handbook, ESO). The typical system temperature varied between 220 and 320 K (in unit) at both frequencies. The total on-source integration time was 6 hours. A balanced on-off dual beam switching mode was used, with a frequency of 6 Hz and two symmetric reference positions offset by 12′ in azimuth. The pointing was regularly checked on the SiO maser R Aqr. The pointing accuracy was 4′′ rms. The backends were low-resolution acousto-optical spectrometers. The total bandwidth available was 500 MHz at 115 GHz and 1 GHz at 230 GHz, with a velocity resolution of 1.8 km s-1. The data were reduced with the software CLASS. Only first-order baselines were subtracted from the spectra.
3 Results and Discussion
In Figure 1 we present the CO(1–0) and CO(2–1) spectra obtained towards the centre of the Cartwheel, as well as the HST image (Borne et al. borne_hst (1996)) on which the sizes of the CO beams have been superimposed. The parameters of the lines, derived from gaussian fits after smoothing to a final velocity resolution of 15 km s-1, are given in Table 1. The central velocities agree with the systemic velocity of 9089 km s-1 determined from H i observations (Higdon jim_hi (1996)). An indicative molecular gas mass within the CO(1–0) beam is given in the last column of Table 1. It has been computed using a standard CO-H2 conversion factor (see below).
| Line | M(H2) | ||||
|---|---|---|---|---|---|
| km s-1 | km s-1 | K km s-1 | mK | 109M⊙ | |
| CO(1–0) | 912313 | 21823 | 0.820.10 | 1.0 | 1.5 |
| CO(2–1) | 913612 | 21127 | 0.950.11 | 1.2 |
3.1 Molecular gas mass and CO(2–1)/(1–0) line ratio
To convert CO intensities into H2 column densities, we use the factor of Strong et al. (strong (1988)):
| (1) |
where is the main-beam line area. This yields a mass
| (2) |
where is the half-power beam width of the telescope.
From the CO(1–0) line intensity, we estimate a mass of molecular gas (H2) of 1.5 109 M⊙ within the 43′′ beam. This value should be interpreted with caution since it is known that the CO-to-H2 conversion factor () is dependent on the metallicity (e.g. Maloney & Black maloney (1988)). Due to the very weak line emission in the centre, the metallicity could be measured only in the outer star-forming ring of the Cartwheel, and it is 12+log[O/H]=8.1 (Fosbury & Hawarden fh (1976)), compared with 8.9 in Orion. If the nucleus has the same metallicity as the outer ring, then the conversion factor would be higher than the standard one by a factor of about 4 (Wilson wilson (1995)), and the H2 mass as well. However, it is also known that most galactic disks present a metallicity gradient, with metallicities in the nucleus up to times higher than in the outer parts of the disk (Smartt & Rolleston smartt (1997)). Although may vary linearly with the reciprocal of metallicity when the metallicity is low, is expected to become less sensitive to metallicity at values above that of Orion (Sakamoto sakamoto (1996)). Thus, if we take into account the metallicity gradient across the disk, the value of for the nucleus of the Cartwheel might be not much lower than the standard value. We can bracket the conversion factor in the nucleus: , and the H2 mass within the 43′′ beam:
H2 masses in this range are common for central regions of normal spirals of intermediate and late types (e.g., see Fig. 133 in Young et al. young (1995)) and are similar to those inferred for other ring galaxies (Horellou et al. horellou (1995)).
More unusual is the fact that we observe similar integrated intensity in the CO(1–0) and CO(2–1) lines, despite the difference of a factor of 4 in the beam areas. If the CO lines were thermalized, this would imply that the surface density of the CO gas would be nearly constant within the 25 kpc CO(1–0) beam diameter, which is very improbable. The surface density of most disk galaxies shows an exponential radial decrease. Even if the spokes were gas-rich, as some numerical simulations predict (Hernquist & Weil hw (1993), Mihos & Hernquist mihos (1994)), their filling factor is likely to be low. For a linear decrease of the surface density, one expects a line ratio of 0.5. We rather suggest that the CO(2–1) emission is sub-thermal, possibly because of a low temperature or a low gas density, and that the CO emission is concentrated within the 13 kpc CO(2–1) beam (which is consistent with the fact that both lines have similar widths). Correcting for the different beam sizes, one obtains a CO(2–1)/CO(1–0) line ratio of 0.3 , which is significantly lower than the ratio of 0.9 observed in nearby spirals (Braine & Combes braine (1992)). Such low ratios have been observed in dark clouds of M31 where there is little evidence of star-forming activity (Allen & Lequeux allen (1993)).
3.2 Comparison of CO, Hi and H emission

Let us try to compare the spatial distribution and kinematical signature of the CO gas with those of the atomic and the ionized hydrogen. Neutral hydrogen is undetected within the central of the galaxy ((Hi ) 0.3 M⊙ pc-2) and has a roughly constant surface density from to 22′′. ((Hi ) 4 M⊙ pc-2, Higdon jim_hi (1996)). The Hi mass within our 43′′ CO(1–0) beam is 1.5 109 M⊙, which is of the same order as the molecular gas mass that we have calculated, but it is only M⊙ within the 22′′ CO(2–1) beam. If, as argued in the previous paragraph, the CO emission is concentrated, then the interstellar medium within the central 22′′ is predominantly molecular.
The rotation curve rises smoothly from the inner to the outer ring (see Figure 2). Atomic gas is infalling near the inner ring, where concentrations are seen. Assuming that the CO gas is distributed in an inclined plane (), we can use the line widths to estimate the rotational velocity in the central region of the galaxy. For the CO(2–1) line we find == 138 km s-1 which is significantly higher than the velocities measured for the Hi gas at radii (see Fig. 2). The CO point is more consistent with the H rotation curve. The difference between the Hi velocity on one hand and the H and CO velocities on the other hand is likely to be due to different distributions of the atomic and molecular gas, the latter being more concentrated.
4 Conclusion
We have presented the first detection of 12CO(1–0) and 12CO(2–1) line emission towards the nucleus of the Cartwheel galaxy and estimated the mass of molecular gas within the central 43′′ (1.5 10 M(H2) M⊙). The limited angular resolution of these single-dish observations does not allow us to determine precisely the location of the molecular gas, but it is probably concentrated within the central where little atomic gas is found ( M⊙, Higdon jim_hi (1996)). The CO(2–1) to (1–0) line ratio is low, suggesting sub-thermal excitation, which is consistent with the low level of star-forming activity observed in the central region of the Cartwheel. These CO measurements make it possible to justify future interferometric observations to study the distribution and the dynamics of the molecular gas with a better spatial resolution and to establish whether it is associated with the inner ring and/or the dust-lanes, and whether it is of pre-collisional origin or infalling onto the nucleus as numerical simulations predict.
Acknowledgements.
We are grateful to L.-Å. Nyman and to the SEST staff for the support during the observations, to S. Leon (Observatoire de Paris), C. Struck (Iowa State University) and J.H. Black (Onsala Space Observatory) for useful discussions and comments. C.H. aknowledges financial support from the Swedish Natural Science Research Council (NFR). V.C. acknowledges the financial support from the TMR fellowship grant ERBFMBICT960967. We would like to thank an anonymous referee for critical comments on the manuscript.References
- (1) Allen, R.J. & Lequeux, J., 1993, ApJ 410, L15
- (2) Amram, P., Mendes de Oliveira, C., Boulesteix, J. & Balkowski, C., 1998, A&A 330, 881
- (3) Appleton, P.N. & Struck-Marcell, C., 1996, Fund. of Cos. Phys. 16, 111
- (4) Appleton, P.N., et al., 1998, in Galaxy Interactions at Low and High Redshift, IAU 186, in press.
- (5) Booth, R., Delgado, G., Hagström, M., et al. 1989, A&A 216, 315
- (6) Borne, K.D., Lucas, R., Appleton, P.N. et al., 1996, in Science with the Hubble Space Telescope II, edited by P. Benvenuti, F.D. Macchetto, and E.J. Schreier, (STScI, Baltimore)
- (7) Borne, K. et al., 1997, Rev. Mex. Astron. Astrofis. 6, 141
- (8) Braine, J., Combes, F., 1992, A&A 264, 433
- (9) Charmandaris, V. et al., 1998, A&A, in press
- (10) Fosbury, R. & Hawarden, T., 1976, MNRAS 178, 473
- (11) Higdon, J.L., 1995, ApJ 455, 524
- (12) Higdon, J.L., 1996, ApJ 467, 241
- (13) Higdon, J.L., Cecil, G., Bland-Hawthorn, J., Lord, S.D., 1997, AAS 191, 8907
- (14) Hernquist, L. & Weil, M., 1993, MNRAS 261, 804
- (15) Horellou, C., Casoli, F., Combes, F. et al., 1995, A&A 298, 743
- (16) Lynds, R. & Toomre, A., 1976, ApJ 209, 382
- (17) Maloney, P., & Black, J.H., 1988, ApJ 325, 389
- (18) Marcum, P., Appleton, P. N., & Higdon, J., 1992, ApJ 399, 57
- (19) Mihos, J.C., & Hernquist, L., 1994 ApJ 437, 611
- (20) Sakamoto, S., 1996, ApJ 462, 215
- (21) Smartt, S.J., Rolleston, W.R.J., 1997, ApJ 481, L47
- (22) Strong, A.W., Bloemen, J.B.G.M., Dame, T.M., et al., 1988, A&A 207, 1
- (23) Struck, C., Appleton, P.N., Borne, K.D., & Lucas, R.A. 1996, AJ 112, 1868
- (24) Struck-Marcell, C. & Appleton, P.N., 1987, ApJ 323, 480
- (25) Struck-Marcell, C. & Higdon, J.L., 1993, ApJ 411, 108
- (26) Theys, J. & Spiegel, E., 1976, ApJ 212, 616
- (27) Thronson, H.A.Jr. & Telesco, C.M., 1986, ApJ 311 98
- (28) Wilson, C.D., 1995, ApJ 448, L97
- (29) Young, J., Shuding Xie, Tacconi, L. et al., 1995 ApJS, 98, 219
- (30) Zwicky, F., 1941, in Th. von Karman Anniversary volume, p. 137, Contribution to Applied Mechanics and Related Subjects, California Institute of Technology, Pasadena