Results from the CASTLES Survey of Gravitational Lenses
Abstract
We show that most gravitational lenses lie on the passively evolving fundamental plane for early-type galaxies. For burst star formation models (1 Gyr of star formation, then quiescence) in low cosmologies, the stellar populations of the lens galaxies must have formed at . Typical lens galaxies contain modest amounts of patchy extinction, with a median differential extinction for the optical (radio) selected lenses of () mag. The dust can be used to determine both extinction laws and lens redshifts. For example, the elliptical lens in MG 0414+0534 has an mean extinction law. Arc and ring images of the quasar and AGN source host galaxies are commonly seen in NICMOS H band observations. The hosts are typically blue, galaxies.
1. Introduction
In the last few years the number of known gravitational lenses has exploded to a total of over 40 systems111see http://cfa-www.harvard.edu/castles.. With such a large statistical sample the lenses become excellent tools for studying the structure and evolution of the lens galaxies, the luminosity function of lens galaxies, dust in the lens galaxies, and cosmology. Many of these applications, particularly the evolution and luminosity function studies, depend on possessing accurate surface photometry of the lens galaxies. When we attempted the first survey of galaxy evolution and structure using lenses (Keeton et al. 1998), we discovered that the accumulated photometric data were inadequate to the task. Individual groups had observed individual lenses in a remarkable array of filters, frequently using short snapshots which were adequate to verify lens candidates but inadequate for detailed surface photometry of the lens galaxies.
The goal of the CfA/Arizona Space Telescope Lens Survey (CASTLES) is to remove these limitations and to fully enable the use of lenses as precision tools in astronomy. To date we have obtained NICMOS H images of 37 lenses and binary quasars, with complementary WFPC2 V and I images scheduled for 1999. Further observations proposed for Cycle 8 would expand the database to 60 lenses and binary quasars. The data are homogeneously reduced with typical astrometric accuracies of 3 mas or better (checked on VLBI lenses), and initially fit with a series of standard photometric and gravitational lens models (e.g. Lehár et al. 1998).
Rather than discuss well known applications of gravitational lenses such as determinations of (e.g. Barkana 1998, Impey et al. 1998), the cosmological model (Kochanek 1996, Falco et al. 1998), or the mass distribution of the lenses (e.g. Keeton et al. 1997), we will discuss three new applications. First, we will study the fundamental plane of lens galaxies and its evolution, along with a few preliminary observations about the luminosity function of lens galaxies. Second, we will study extinction and extinction laws in lens galaxies. Third, and finally, we will quickly survey the properties of the host galaxies of the source quasars and AGN.
2. The Fundamental Plane of Lenses
Djorgovski & Davis (1987) and Dressler et al. (1987) discovered that early type galaxies show a tight correlation between the effective radius , mean surface brightness and central velocity dispersion which is now known as the fundamental plane (FP). The FP is clearly related to the virial theorem, and the differences between the FP and the relation expected from the virial theorem are usually interpreted as variations in the mass-to-light ratio with luminosity. Van Dokkum et al. (1998) and Pahre (1998) have used the fundamental plane of early-type galaxies in rich clusters out to to study the evolution of the mass-to-light ratio of the early-type galaxies and to demonstrate that they follow the predictions for passively evolving stellar populations formed at . There is no comparable study of early-type galaxies in low density environments due to observational limitations, although some models of galaxy formation (e.g. Kauffmann & Charlot 1998) would predict significantly different star formation histories for field early-types.
Most lens galaxies are predicted (e.g. Fukugita & Turner 1991) and observed (e.g. Keeton et al. 1998) to be early-type (E and S0) galaxies in low density environments. Many lenses are in groups and very few are in poor clusters. To use the FP we need not only and , which we can obtain from the CASTLES photometry, but also the central velocity dispersion. While we know the mass enclosed by the lensed images with extraordinary accuracy compared to that obtainable from stellar dynamical studies of even nearby galaxies, we have few direct measurements of the central velocity dispersion. We can, however, indirectly estimate from the separation of the images . Both lens models (e.g. Kochanek 1995) and modern stellar dynamical models (e.g. Rix et al. 1997) of early-type galaxies favor an overall mass distribution corresponding to a flat rotation curve. In these models, the image separation depends only on the dispersion of the dark matter , and stellar dynamical models of local early-type galaxies using the same mass model show that to remarkable accuracy (Kochanek 1994). Thus we estimate the velocity dispersion by km s-1 where and are the lens-source and observer-source distances.


We compare the lenses to the local FP by mapping the properties of the lenses to the redshift of Coma, and then comparing the predicted properties of the lenses to the sample of early-type galaxies in nearby clusters studied by Jorgensen et al. (1996). To make the transformation we must select a cosmological model (we will use the currently popular , model) and a stellar population evolution model. We used burst models in which star formation starts at a formation redshift and lasts for 1 Gyr, which provides a good match to the colors of the lens galaxies for .
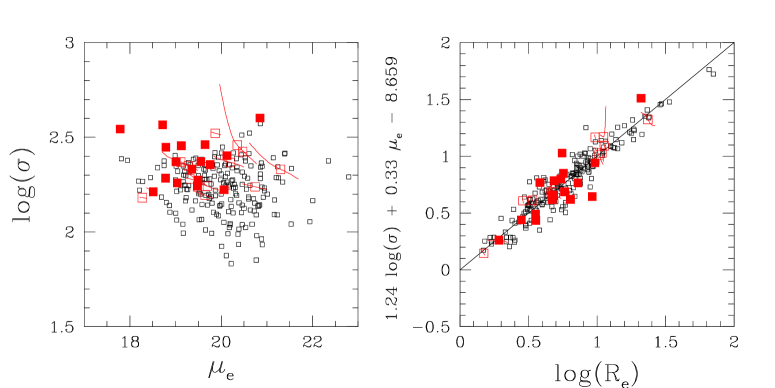
Figure 1 shows the FP at Coma and the predicted properties of the lens galaxies. With no adjustable parameters other than the star formation epoch, the vast majority of lenses with known redshifts lie on the fundamental plane with little more scatter than seen in the local samples! The success of the comparison again emphasizes that most lens galaxies are early-type galaxies, and that the dark matter model we have used to estimate the central velocity dispersion is making accurate dynamical predictions. Changes in the cosmological model tend to make the galaxies slide along the FP, while changes in the star formation history tend to move the galaxies perpendicular to the FP. Figure 2 shows the relative probabilities of the star formation onset redshift for the burst models. For this particular model the preferred epoch is , rather similar to the results for early-type galaxies in rich clusters despite the vast difference in environmental densities.
Even though the lens galaxies fall on the present day FP, they are not a random subset of it. As the left panel of Figure 1 shows, the lenses are concentrated toward high velocity dispersion. We see little difference in the effective radius and surface brightness distribution of the lens galaxies and the Jorgensen et al. (1996) local sample. Note, however, the selection effect that the lenses with spectroscopic redshifts tend to have higher surface brightnesses than the lenses with only estimated redshifts. The concentration of the lens galaxies at high velocity dispersions compared to local samples is expected from the strong velocity dispersion dependence of the probability that a galaxy will be a lens ().
Many redshifts for optically selected lenses remain unmeasured because the quasar/galaxy contrast makes the observations technically challenging, and the continuing redshift incompleteness is a severe limitation on using the lenses to determine the cosmological model. We can use the constraint that a lens lies on the FP as a means of estimating unmeasured lens redshifts because the predicted physical properties of the lens at Coma as a function of lens redshift follow a trajectory that is largely perpendicular to the FP. Thus, it is only at or near the true lens redshift that the galaxy properties will lie on the FP. Figure 3 compares the spectroscopic and FP estimates for the redshifts of 15 lenses. The rms redshift difference is only . The least accurate estimate is for HST 14113+5211 (Fischer et al. 1998), where the lens galaxy is in a cluster. The cluster potential boosts the image separation, leading to an overestimated galaxy velocity dispersion. Sometimes the trajectory for a particular filter moves along the FP for some redshift region, causing the larger uncertainties seen for two lenses near with only H band data. Multicolor data breaks the degeneracy.
Finally, if we know the redshifts of the lens galaxies we can also estimate the mean luminosity function (LF) of the lenses and compare it to the predictions from local estimates of the LF. The LF of the lens galaxies differs from the LF of all galaxies because the lens cross section rises with luminosity, and we must include the appropriate cross section weighting of the LF when we make comparisons. As emphasized by Kochanek (1996) and Falco et al. (1998), the uncertainties in the luminosity function of galaxies by type contributes as much to the uncertainties in the cosmological limits derived from lens statistics as the Poisson errors arising from the small size of the samples. When parametrized by a Schechter function, , different local surveys (e.g. EEP (Efstathiou et al. 1988), LPEM (Loveday et al. 1992), MGHC (Marzke et al. 1994), LCRS (Lin et al. 1996)) find mutually discrepant values for the faint end slope , break luminosity , and number density of early-type galaxies.
Figure 4 shows the likelihood of fitting the observed LF of the lens galaxies and the separation distribution of the images as a function of the Schechter function parameters and (the absolute B magnitude corresponding to ) in an , cosmology. We mark the central point of the standard model used by Kochanek (1996) and Falco et al. (1998) and five alternative models used by Chiba & Yoshii (1998). The value of is that from the original LF surveys (listed above), while the value of is an estimate by Chiba & Yoshii (1998) after converting from the photometric band of the original survey. The two models selected by Chiba & Yoshii (1998) to revise the cosmological limits (LPEM and MGHC) are the two models most discrepant with the lens data, probably because of problems in the estimate of . Figure 4 reveals why the LPEM model fails. The likelihood contours for the lens data show a degeneracy between and which is very similar to the apparent degeneracy that links most of the local LF estimates. These LF comparisons are extremely preliminary, but with the full sample it should be possible to constrain and more accurately, while measuring the changes in the comoving density with redshift.
3. Extinction
We possess little direct information on extinction in galaxies outside the Local Group and almost none on early-type galaxies (see reviews by Mathis 1990, Fitzpatrick 1998). Accurate extinction estimates almost always depend on knowing the intrinsic spectrum of the reddened object, which is generally true only of stars. Once inferences about extinction depend on modeling the fluxes of stellar populations mixed with dust, the accuracy drops dramatically (e.g. Witt et al. 1992). Extinction laws are measured almost exclusively in the Galaxy, the LMC and the SMC. No accurate extinction curve is measured in an early-type galaxy, although several studies (e.g. Warren-Smith & Berry 1983) suggest that dust in early-type galaxies may be quite different from “standard” Galactic dust. Moreover, since both the mean metallicity and star formation rates are strong functions of redshift, it would be surprising if the mean extinction curve failed to evolve with redshift.
We can use the lenses to determine the differential extinction between the lensed images from the variation in the flux ratios with wavelength. If there is sufficient dust and wavelength coverage, the extinction law can be determined (Nadeau et al. 1991), and it may be possible to determine the redshift of the dust (Jean & Surdej 1998). The magnitude difference between two images and as a function of wavelength is
| (1) |
where is the magnification ratio, is the extinction difference (), and is the extinction law in the rest frame of the dust. Systematic errors arise if the magnification ratio depends on wavelength or temporal variations by the source mimic a wavelength dependence.
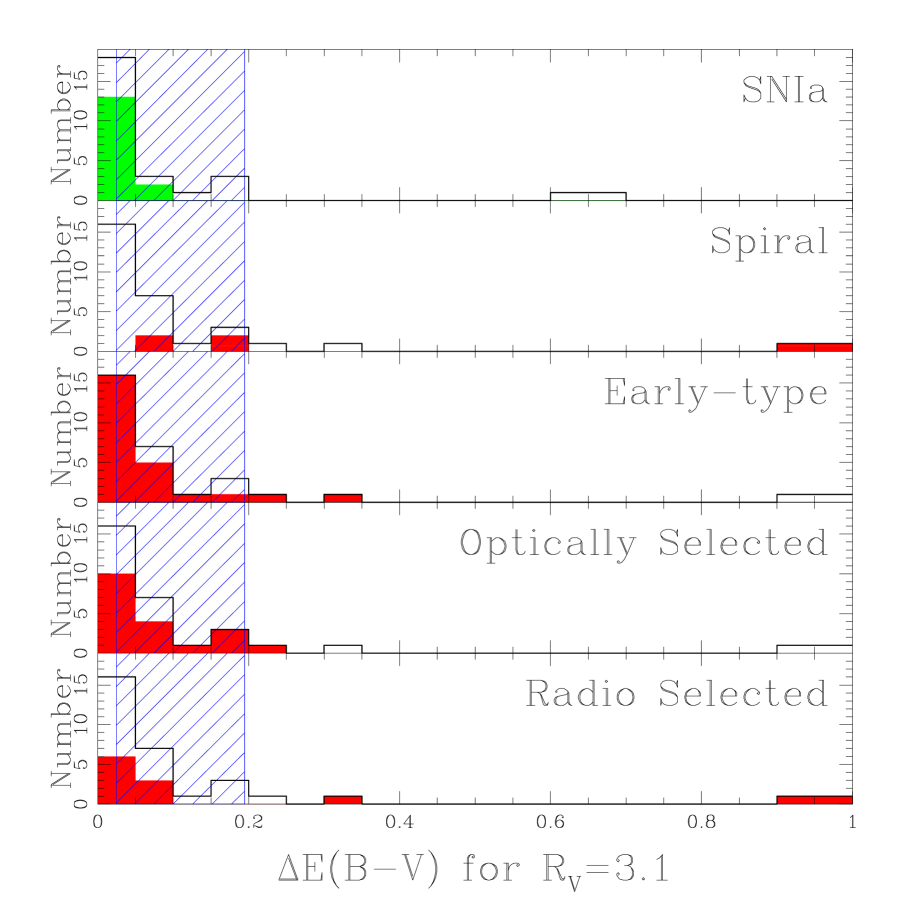
Figure 5 presents a histogram of differential extinctions on 37 lines of sight in 23 lens galaxies. The median rest frame differential extinction of the optically selected lenses is mag and the median for the radio selected lenses is mag. The distributions for optical and radio selected lenses are similar except for the two radio-selected lenses with high differential extinctions. Both B 0218+357 and PKS 1830–211 are face-on spiral galaxies (Lehár et al. 1998) with high molecular gas content (e.g. Wiklind & Combes 1995, 1996). There is no correlation of the differential extinction with impact parameter, which suggests that the diffuse dust is patchy. For comparison to the differential extinction, we had previously obtained an estimate of the mean extinction in lens galaxies of mag by comparing the statistics of radio and optically selected lenses (Falco et al. 1998). Thus the mean extinction is comparable to the differential extinction, also consistent with a patchy dust distribution.


For systems with sufficient extinction and wavelength coverage we can estimate the extinction law. Figure 6 shows the extinction law of the elliptical lens in MG 0414+0534 derived both parametrically using the Cardelli et al. (1989) models and non-parametrically. The values of in the non-parametric models and in the parametric models are well below the standard Galactic value of . In fact, standard Galactic dust is ruled out at a , and we confirm the local indications that dust in early-type galaxies may have a different mean extinction law than that of the Galaxy.
Following Jean & Surdej (1998) we can also estimate a dust redshift for the systems using the dependence of the extinction at observed wavelength on the extinction curve at the rest wavelength in the dust ). The determination of dust redshifts requires better data than determining the extinction curve because it depends on detecting the deviations of the extinction curve from a self-similar power law (e.g. Mathis 1990). For five cases we can compare the spectroscopic lens redshift to the dust redshift (see Figure 7), including MG 0414+0534. The agreement is remarkably good. Moreover, the fact that the anomalous extinction law predicts the observed redshift of the MG 0414+0534 lens strongly suggests that the result is not a consequence of systematic errors.
We are measuring extinctions and extinction laws at redshifts and impact parameters very similar to the those of the Type Ia supernovae used by Perlmutter et al. (1997) and Riess et al. (1998) to determine the cosmological model. It is critical to the cosmological determination that the supernova fluxes be accurately corrected for extinction. We can make four observations about the supernovae from the lens samples. First, if even early-type galaxies at these redshifts contain dust, it would be surprising if the supernova samples showed no dust. Second, from the radio lenses like MG 0414+0534, we can rule out the existence of dust which is gray in the optical. Where we can measure the extinction curves in lens galaxies they resemble the Cardelli et al. (1989) parametrized forms. Third, galaxies at high redshift, like galaxies at low redshift, show a range of extinction curves. It is dangerous to assume that the extinction curve will match a mythical standard extinction law. Fourth, we could not compare the lens and supernovae extinction distributions. Perlmutter et al. (1997) do not estimate extinctions. While Riess et al. (1998) estimate extinctions, the distribution is peculiar because 11 of 15 supernovae have negative estimated extinctions. Simple statistical tests show that the preponderance of negative extinctions in the sample is inconsistent with the assumption that they are produced by random photometric errors with the stated uncertainties at a slightly greater than 2- confidence level.
4. A Quick Tour of Host Galaxies
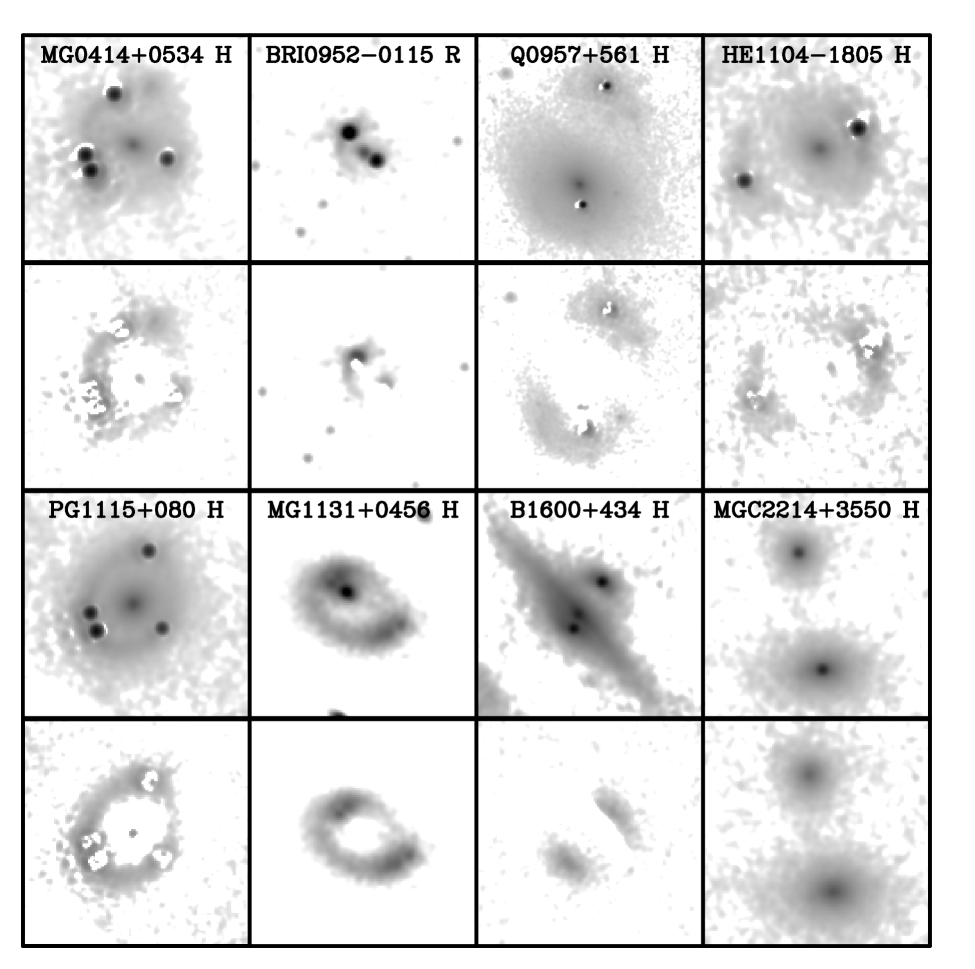
A large fraction of the lens systems now show arc and ring images of the quasar or AGN host galaxies either in the optical or in the infrared. Figure 8 shows a sample of the hosts. Seven of the eight hosts are new discoveries. MG 0414+0534 () is the system used to determine the extinction law in §3. BRI 0952–0115 () is the highest redshift detection of a host galaxy. Q 0957+561 () shows two enormous arc images of the host whose morphologies essentially rule out the popular Grogin & Narayan (1996) models for the system. These models predict a radially stretched image of the Northern host relative to the lens galaxy, while we observe a tangentially stretched image. HE 1104–1805 () shows two arc images of the host. PG 1115+080 () has an Einstein ring image of the host galaxy which could be used to break the degeneracies in the estimates of for the system if NICMOS is repaired (Impey et al. 1998). B 1600+434 () shows two images of the host straddling the bulge of the lens. MGC 2214+3550 () is a beautiful example of a binary quasar. The lower source is a radio loud quasar and the upper is not, with a radio flux ratio of . Both H band sources are perfectly modeled by a point source for the quasar at the center of a de Vaucouleurs profile host. MG 1131+0456 () has a spectacular infrared ring image of the host (Kochanek et al. 1998). The ring is 4–5 times brighter than the lens galaxy in the infrared and virtually invisible in the optical. The red colors of the system are due to the flux from the stars in the host galaxy rather than to dust in the lens.
We have started to estimate the properties of the host galaxies, and the two generic statements seem to be that many correspond to sub- galaxies for their redshifts and that they are relatively blue. In many cases the host galaxies are actually bluer in their I–H colors than the early-type lens galaxies. While the very luminous hosts of radio-loud objects (e.g. MG 1131+0456) have been seen previously, our lensing results constitute the first secure detection for a sample of radio-quiet hosts. While in nearby quasars the host luminosities do not depend on the radio properties, we find that at , the radio loud hosts are on average 2 mag brighter than the radio quiet ones. One possible interpretation is that the radio flux as well as the rest-optical luminosity get boosted during star-burst phases.
5. Summary
The next ten years will be the period when gravitational lenses make their most dramatic scientific impact. As recently as two years ago, there were too few lenses to attack many of the most interesting scientific problems, and ten years from now there will be several hundred lenses and progress will again slow. Today, with 40–50 lens systems and 4–5 time delay determinations we are at the cusp where science using gravitational lenses will advance most rapidly. The CASTLES project in combination with archival HST observations of gravitational lenses now has about half of the final data set for the 47 currently known lenses, but new lenses are being discovered almost as fast as HST is observing the old lenses.
We can use this explosion in data to dramatically expand the range of scientific problems that gravitational lenses can attack. In this short review we have illustrated only three new examples of gravitational lenses as tools. The fundamental plane of lens galaxies shows that most lenses are normal early-type galaxies, that early-type galaxies in low density environments are very similar to those in the centers of rich clusters, and that the stellar populations of the early-type lenses must have formed at . The differential extinction in lens galaxies shows that early-type galaxies contain modest amounts of diffuse dust. The amount of dust is sufficient to bias cosmological limits based on the statistics of lensed quasars, as already discovered by Falco et al. (1997) in their comparison of the statistics of lensed quasars and radio sources. The dust in the lenses can be used to determine both extinction laws and lens redshifts. Finally, HST images of lenses, particularly infrared images, commonly show arc and ring images of the quasar or AGN host galaxies. The lens magnification pulls the host galaxy out from under the bright central point source and makes it significantly easier to detect and model the properties of the host galaxies.
Acknowledgements: Support for the CASTLES project was provided by NASA through grant numbers GO-7495 and GO-7887 from the Space Telescope Science Institute, which is operated by the Association of Universities for Research in Astronomy, Inc. CSK was also supported by the NASA Astrophysics Theory Program grant NAG5-4062. HWR is also supported by the Alfred P. Sloan Foundation.
References
- (1) Barkana, R., Lehár, J., Falco, E.E., et al., 1998, astro-ph/9808096
- (2) Cardelli, J.A., Clayton, G.C., & Mathis, J.S., 1989, ApJ, 345, 245
- (3) Chiba, M., & Yoshii, Y., 1998, astro-ph/9808321
- (4) Djorgovski, S., & Davis, M., 1987, ApJ, 313, 59
- (5) Dressler, A., Lynden-Bell, D., Burstein, D., et al., 1987, ApJ, 313, 42
- (6) Efstathiou, G., Ellis, R.S. & Peterson, B.A., 1988, MNRAS, 232, 431
- (7) Falco, E.E., Kochanek, C.S., & Muñoz, J.A., 1998, ApJ, 494, 47
- (8) Fischer, P., Schade, D., & Barientos, F., 1998, astro-ph/9806273
- (9) Fitzpatrick, E.L, 1998, astro-ph/9809387
- (10) Fukugita, M., & Turner, E.L., 1991, MNRAS, 253, 99
- (11) Grogin, N.A., & Narayan, R., 1996, ApJ, 564 92 (erratum: ApJ, 473, 570)
- (12) Impey, C., Falco, E., Kochanek, C., et al., 1998, ApJ in press, astro-ph/9809371
- (13) Jean, C., & Surdej, J., 1998, astro-ph/9810218
- (14) Jorgensen, I., Franx, M., & Kjaergaard, P., 1996, MNRAS, 280, 167
- (15) Kauffmann, G., & Charlot, S., 1998, astro-ph/9810031
- (16) Keeton, C.R., Kochanek, C.S., & Seljak, U., 1997, ApJ, 482, 604
- (17) Keeton, C.R., Kochanek, C.S., & Falco, E.E., 1998, ApJ in press, astro-ph/9708161
- (18) Kochanek, C.S., 1994, 436, 56
- (19) Kochanek, C.S., 1995, 445, 559
- (20) Kochanek, C.S., 1996, ApJ, 466, 638
- (21) Lehár, J., Falco, E.E., Impey, C., et al., 1998, in preparation
- (22) Lin, H., Kirshner, R.P., Schechtman, et al., 1996, ApJ, 464, 60
- (23) Loveday, J., Peterson, B.A., Efstathiou, G., & Maddox, S.J., 1992, ApJ, 390, 338
- (24) Marzke, R.O., Geller, M.J., Huchra, J.P., & Corwin, H.G., 1994, AJ, 108 437
- (25) Mathis, J.S., 1990, ARA&A, 28, 37
- (26) Nadeau, D., Yee, H.K.C., Forrest, W.J., et al., 1991, ApJ, 376, 430
- (27) Pahre, M., 1998, Caltech PhD thesis
- (28) Perlmutter, S., Gabi, S., Goldhaber, G., et al., 1997, ApJ, 483, 565
- (29) Riess, A.G., Filippenko, A.V., Challis, P., et al., 1998, AJ, 116, 1009
- (30) Rix, H.-W., de Zeeuw, P.T., Cretton, N., et al., 1997, ApJ, 488, 702
- (31) van Dokkum, P., Franx, M., Kelson, D., & Illingworth, G., 1998, ApJL, 504, 17L
- (32) Warren-Smith, R.F., & Berry, D.S., 1983, MNRAS, 205, 889
- (33) Wiklind, T., & Combes, F., 1995, A&A, 299, 382
- (34) Wiklind, T., & Combes, F., 1996, Nature, 379, 139
- (35) Witt, A., Thronson, H., & Capuano, J., 1992, ApJ, 393, 611