3 (11.06.2; 11.12.2; 13.18.1)
G. Gavazzi Gavazzi @ trane.uni.mi.astro.it 11institutetext: Universitá degli Studi di Milano, Via Celoria 16, 20133, Milano, Italy 22institutetext: Laboratoire d’Astronomie Spatiale, Traverse du Siphon, BP 8, F-13376 Marseille Cedex 12, France
On the local radio luminosity function of galaxies. I: the Virgo cluster
Abstract
We cross-correlate the galaxies brighter than in the Virgo cluster
with the radio sources in the NVSS survey (1.4 GHz), resulting in 180
radio-optical identifications. We determine the radio luminosity function
of the Virgo galaxies, separately for the early- and late-types.
Late-type galaxies develop radio sources with a probability proportional
to their optical luminosity. In fact their radio/optical () distribution
is gaussian, centered at , i.e. the radio luminosity is
0.3 of the optical one.
The probability of late-type galaxies to develop radio sources is almost
independent of their detailed Hubble type, except for Sa (and S0+S0a) which
are a factor of 5 less frequent than later types at any .
Giant elliptical galaxies feed ”monster” radio sources with a probability strongly
increasing with mass. However the frequency of fainter radio
sources is progressively less sensitive on the system mass.
The faintest giant E galaxies () have a probability
of feeding low power radio sources similar to that of dwarf E galaxies as faint as
.
111Table 1 is only available in electronic form at
the CDS via anonymous ftp to cdsarc.u-strasbg.fr (130.79.128.5)
or via http://cdsweb.u-strasbg.fr/Abstract.html
keywords:
Galaxies: luminosity function; Clusters: individual: Virgo; Radio continuum: galaxies1 Introduction
A robust determination of the local
(z=0) Radio Luminosity Function (RLF) of normal galaxies, jointly with
similar determinations carried out at cosmological distances
(e.g. Prandoni et al. 1998),
is the essential tool for addressing several relevant cosmological issues,
such as estimating the rate of evolution in galaxies,
more directly than by modeling the distribution of the faint radio
source counts (see Condon 1989).
Since the seventies this issue received strong attention among the
scientific community, culminating with the analyses of elliptical
galaxies by Auriemma et al. (1977) and of spiral galaxies by Hummel (1981).
The study of the radio
properties of late-type galaxies in the Coma supercluster by Gavazzi
& Jaffe (1986) contributed
establishing that the radio continuum luminosity of these galaxies is
to first order
proportional to their optical luminosity, and to second order
to their current star formation rate. In other words, cosmic ray
electron acceleration is provided primarily
by type II supernovae explosions (see also Condon 1992) which are more
abundant in massive spiral galaxies.
Deep radio surveys, carried out in the nineties with the
VLA, provided the mean
of re-determining the RLF of elliptical galaxies (Ledlow & Owen 1996),
which turned
out to be in remarkable agreement with the early determination of
Auriemma et al. (1977).
Their main finding is that the probability of E galaxies to develop
powerful radio sources () is strongly
dependent on their optical luminosity (). Below
this dependence becomes weaker with decreasing .
Due to the lack of extensive radio and optical surveys of galaxies of both
early- and late-type, the present knowledge is still limited to relatively
bright radio sources () and bright optical
luminosities (), typical of giant galaxies.
To go one step further
it seems natural to re-determine the RLF using the Virgo cluster, which
contains thousands of galaxies, spanning a large luminosity range,
from giant to dwarfs as faint as mag.
Surprisingly the latest systematic study of this cluster at centimetric
wavelengths dates back 1981, when Kotanyi (1981) carried out with the WSRT
a survey of this cluster. Not only these early
measurement were limited by the current sensitivity (several mJy/beam),
but also they lacked the necessary cluster coverage.
We are now in the position of re-addressing the issue
taking advantage of the recent
all sky NVSS radio survey carried out with the VLA
(Condon et al. 1998) and of the supreme quality of the Virgo Cluster
Catalogue (VCC) of Binggeli et al. (1985), which provides us with reliable
photometry and classification for over 2000 galaxies.
The major improvement of the new radio observations is not primarily their higher sensitivity, which is in fact only few times better than
previously available,
but mostly the unprecedented homogeneous sky coverage.
In this paper we make use of the NVSS data to construct the RLF of
an optically complete () sample of galaxies extracted from
the VCC. With these data we wish to discuss two issues:
i) is the dependence of the RLF on Hubble type well determined?
ii) does the dependence of the RLF on galaxy mass, which is known to
exist for giant galaxies, extend to the dwarf population?
Issues i) and ii) are addressed in Section 4.
In a companion paper (Gavazzi & Boselli
1999: Paper II) we address another question:
iii) is the local RLF of late-type galaxies universal or is it
influenced by the environment? To study this issue we compare
the RLFs of late-type galaxies in five nearby clusters
(Virgo, Cancer, A262, A1367 and Coma) with that of galaxies in less dense
regions of the universe at similar distances.
is used throughout this paper.
2 The Sample
2.1 The Optical Data
The present investigation is based on the
Virgo Cluster Catalogue (VCC) by Binggeli et al. (1985).
The VCC catalogue contains 2096 galaxies brighter than .
Photographic photometry with 0.35 mag uncertainty and
detailed morphological classification are given in the VCC.
The VCC coordinates are affected by 10 arcsec uncertainty (Binggeli et al.
1985) or slightly better.
The VCC also contains a (morphological) estimate of the membership
to the various structures constituting the Virgo cluster:
cluster A (M87), cluster B (dominated by M49), W, W’, M clouds,
and Southern extension. General members and possible members are
treated in this work as belonging to the cluster.
We use an updated version of the VCC containing the following improvements:
i) for 305 galaxies listed in Binggeli & Cameron (1993) we substitute the
eye estimated with obtained on digitized plates.
ii) we include the redshift and consequent membership re-assignments
given in Binggeli et al. (1993). We complement these data
with (few) other redshifts found in the New Extragalactic Database (NED).
iii) for 565 galaxies we substitute the celestial coordinates with the
more precise ones (few arcsec) listed in NED. By comparing this set of new
coordinates with the original VCC ones we find an rms difference of
6.75 arcsec.
We extract from the catalogue a subsample of 1342 objects complete to
. Among these, 589 have yet no redshift in the literature
(140 are possible members, 379 belong to cluster B and another 70
are background galaxies).
Based on the most recent Cepheyds determination, we consider members of
clusters A and B, general members, members of clouds W’, M and Southern
extension at the distance of 17 Mpc. Members of W cloud are taken at
28 Mpc (see also Gavazzi et al. 1998).
2.2 1.4 GHz continuum data
Radio continuum 1.4 GHz data in the regions covered by the present
investigation are available from a variety of sources:
1) Full synthesis and snap-shot observations of specific regions
were undertaken with the VLA and with the WSRT (”pointed” observations).
Hummel (1980) and Kotanyi (1980) did observations of the Virgo cluster
with the WSRT. Condon (1987) and Condon et al. (1990)
observed with the VLA nearby galaxies projected onto the Virgo
region. These surveys do not generally constitute a complete set of
observations.
2) Recently, the all-sky NVSS survey (Condon et al. 1998) carried out with
the VLA at 1.4 GHz became available.
The D array (FWHM = 45 arcsec) NVSS survey covers the sky north of
, with an average rms=0.45 mJy.
Except in specific regions
of the sky near bright sources, where the local rms is higher than average,
this survey
offers an unprecedented homogeneous sky coverage. It not only provides us
with extensive
catalogues of faint radio sources, but also with homogeneous upper limits
at any celestial position.
The VCC region is covered by 13 NVSS maps which are available via
the World Wide Web.
Since radio data from more than one source exist for several target galaxies,
we choose between them adopting the following list of priorities:
1) in general we prefer NVSS data to any other source because of its
homogeneous character,
relatively low flux density limit and because its FWHM beam
better matches the
apparent sizes of galaxies under study, thus providing us with flux
estimates little affected by missing extended flux.
2) For individual bright radio galaxies (e.g. M87) we prefer
data from specific ”pointed” observations since they should provide us
with more reliable estimates of their total flux.
3) in all cases where the flux densities from NVSS are lower than those
given in other references we privilege the reference carrying the
largest flux density.

2.3 The radio-optical identifications
At the position of all optically selected galaxies
we search for
a radio-optical coincidence. For the remaining undetected galaxies
we compute an upper limit flux using .
For the purpose of our study we proceed as follows:
1) we pre-select sources from the NVSS data-base, allowing for a maximum
radio-optical positional
discrepancy of 45 arcsec, because of the large apparent size of the galaxies
in this nearby cluster.
2) we inspect the NVSS maps at the position
of all candidate radio-optical associations. We discard few spurious radio
sources listed in the NVSS database, which turn out to be grating rings
associated with strong radio sources. These belong to 3 regions of
approximately 40 arcmin radius around M87, NGC4261 (3C-270), and around
the source . In these regions we also re-compute the local
rms radio noise.
3) at the position of all pre-selected optical-radio matches we compute an
”identification
class” (ID) according to a criterion which is a slight modification of the
one adopted by Jaffe & Gavazzi (1986).
For each galaxy we calculate the quantity:
(1)
where is the radio - optical positional offset,
is the radio position uncertainty,
and is the uncertainty in the galaxy position.
The latter quantity is assumed to be the 3% of the galaxy optical diameter
plus the
uncertainty in the optical position itself:
(2)
where A is the galaxy optical major axis, and is
the uncertainty in the optical position (see Section 2.1).
The errors on the radio positions are assumed to be inversely proportional
to the signal-to-noise ratio as:
(3)
Identification class ID=1 includes pointlike radio sources with .
Identification class ID=2 are extended sources not meeting the
criterion.
Identification class ID=3 are dubious identifications not meeting the
criterion (not used in the following analysis).
Identification class ID=4 include pointlike sources whose radio-optical
offset is within
the optical extent of the galaxy. These are dubious identifications,
which are nevertheless used
because off-set radio sources are often found associated with disk galaxies.


The 180 positive radio-optical matches are listed in Table 1 as follows:
Column 1: the VCC (Binggeli et al. 1985) designation.
Column 2: the photographic magnitude corrected for extinction in
our Galaxy according to Burstein & Heiles (1982) and for internal extinction
following the prescriptions of Gavazzi & Boselli (1996), except that the correction
for internal extinction has been omitted for Irr and dwarfs.
Column 3: the morphological classification as given in the VCC.
Column 4: the membership to the individual clusters and clouds in the
Virgo area as given in Binggeli et al. 1985 and revised in Binggeli et al. (1993).
Columns 5, 6: the (B1950) optical celestial coordinates of the target galaxy.
Columns 7, 8: the (B1950) celestial coordinates of the radio source.
Column 9: the radio-optical offset (arcsec).
Columns 10: the identification class (see above).
Column 11: the 1.4 GHz total flux density (mJy).
Columns 12, 13: the extension parameters of the radio source (major and minor axes
in arcsec).
Column 14: reference to the 1.4 GHz data. All except 12 identifications
are based on NVSS data.
All our ID=1 sources are found within 35 arcsec from the central optical
coordinates of the parent galaxies. Some (generally fainter than 10 mJy)
ID=2 and ID=4 sources lie between 35 and 45 arcsec.
An estimate of the number of possible chance-identifications ()
among the 180 sources/galaxies listed in Table 1 is carried out with two
independent
methods. Using Condon et al. (1998) Fig. 6 we estimate that the probability
of finding an unrelated source within 45 arcsec of an arbitrary position
is 2 %. Thus about 3.6 sources in Table 1 should be spurious associations.
An independent estimate is computed according to:
(4)
where the summation is extended to all radio sources (approximately 7000)
found in the area A () containing the Virgo cluster, and
is the total number of galaxies considered (1342).
is 5.3, in good agreement with the previous determination.

3 The radio-optical luminosity
For all galaxies we have a measurement of the total
radio flux density
(for 180 detections) or an upper limit (undetected objects).
Combining this with the distance to the objects
we determine their radio luminosity (or ) in .
Let us consider the detected galaxies first. The existence of a
correlation between the radio and optical luminosity is well known:
(see e.g. Condon 1980; Gavazzi & Jaffe
1986; Gavazzi & Contursi 1994). Figs. 1 a and b show this correlation separately for the
early and late-types.
In spite of a large scatter which indicates that,
beside the optical magnitude other quantities determine the radio
properties of galaxies, it appears that late-type galaxies obey to an
almost direct proportionality between the two quantities.
Early type galaxies instead show a strongly non-linear behavior:
galaxies fainter than approximately have an average radio luminosity
, independent of their optical luminosity. Galaxies brighter
than have a radio luminosity strongly increasing with .
These are the ”monster” radio galaxies. It is interesting to notice in Fig.
1b that ”monsters” are absent among S0+S0a galaxies.
4 The Radio Luminosity Functions
Given the small number of actual radio detections (180) with respect to the number of optical candidates (1342), Fig. 1 might not give a realistic representation of the radio properties of an optically selected sample of galaxies. More appropriately, that can be derived in the form of the Fractional Radio Luminosity Function (RLF), which gives the probability distribution that galaxies develop a radio source of a given luminosity (), taking into account the number of detected objects in each bin of radio luminosity , as well as the upper limits (see Avni et al. 1980).
The differential distribution can be derived adopting method III of Hummel
(1981)
which has been shown to be equivalent to the expression given by
Avni et al. (1980):
(5)
where:
is the number of detected objects with ,
is the number of undetected objects with .
The uncertainty on is given by:
(6)
The cumulative distribution is thus:
(7)
4.1 Late-type galaxies
Spiral galaxies are well known to develop radio sources with an average
radio luminosity
proportional to their optical luminosity (see Section 3). For these objects it is
convenient
to define the (distance independent) radio/optical ratio:
,
where is the B magnitude and is the factor appropriate
to transform the broad-band B magnitudes in mJy.
gives the ratio of the radio emission per unit light emitted
by the relatively young stellar population.
The distribution of , that is the probability that a
galaxy develops a radio source with
a radio/optical ratio can be derived similarly to
using equation (5).
Since the radio/optical ratio is a distance independent quantity, we extend
the present analysis to all galaxies in the VCC, including the background
objects. The exclusion of these objects reduces significantly the statistics,
without changing the results.
The for all galaxies (from Sa to BCD), given in Fig 2,
appears as a normal distribution peaked at Log between -1 and -0.5.
About 20 %
of all galaxies are detected at the peak of the distribution.
At the sensitivity of
the present radio survey about 70 % of Virgo galaxies have .
Let us now consider separately the following 9 morphological type classes:
Sa, Sab, Sb, Sbc, Sc, Scd, Sd+Sdm+Sm, Im, and BCD.
Barred and ringed spirals are mixed with normal spirals.
The cumulative distributions
are shown in 9 panels of Fig. 3 respectively.
All panels show, for comparison, also the distribution of all late-type
galaxies together (open dots connected with a solid line).
It is striking that, within the statistical uncertainties,
all RLFs are consistent among each other, except for the Sa’s.
The Sa’s develop radio sources, at any given value of , about 5 times
less
frequently than all others late-type galaxies. Sd+Sdm+Sm are slightly underluminous than average,
but this difference is barely significant.
We have also computed the distribution of S0+S0a (not shown
in Fig. 3), which results identical to that of Sa galaxies.
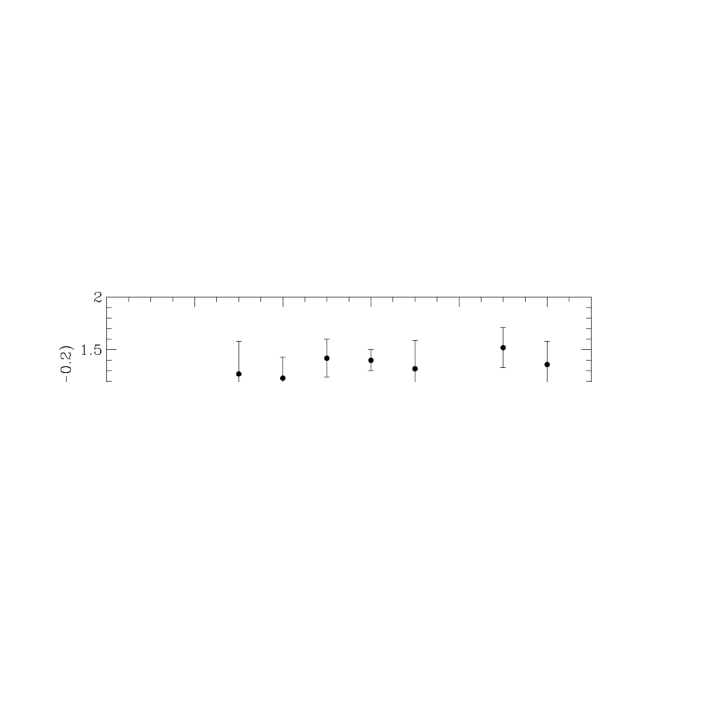
Fig. 4 summarizes the dependence of the radio properties on Hubble type
using the cumulative fraction .
These results are in full agreement with the findings of Hummel (1981).

4.2 Early-type galaxies
Early-type galaxies do not develop radio sources with a radio luminosity
proportional to their optical luminosity (see Section 3). For these objects
the radio/optical ratio is meaningless.
This is consequent to the very existence of radio galaxies. These galaxies
develop radio sources with a broad range of power, whose nature is nuclear,
thus it is only indirectly related with the total luminosity
of their host galaxies.
For early-type galaxies it is convenient to analyze the ”bivariate” (i.e. per
interval of optical luminosity) distribution of
radio luminosity. Obviously this analysis is restricted to the
members of Virgo, disregarding the background objects.
The cumulative representation is shown in Fig. 5 in
5 bins of optical luminosity, such that each of them contains a significant
number of objects: (7); (22); (141);
(159) and (211).
Within the range of radio power covered by the present
analysis () it appears that the probability for E galaxies
to develop radio sources decreases steeply with the optical luminosity
only above (which corresponds to ).
Below this optical luminosity,
where dEs dominate, the fraction becomes independent of
the optical luminosity.

5 Discussion
A clearcut result of the present investigation is that spiral-Irr galaxies
develop extended radio sources whose luminosity scales with the optical luminosity,
independently of the detailed Hubble type.
Their radio/optical ratio is linearly correlated with
their current, massive star formation rate, as derived from their
emission line intensity (Kennicutt, 1999).
Fig. 6 shows that, among the detected galaxies, the relation between and
the equivalent width of the line is one of direct
proportionality, implying that cosmic-ray acceleration is primarely associated with
type II supernovae.
Elliptical galaxies develop radio sources whose nature is nuclear.
Auriemma et al. (1977) determined the RLF of E galaxies brighter of .
They found that the RLF shows a
pronounced break at the radio luminosity , independent of the
galaxy optical luminosity. Beyond the break scales
with the optical luminosity as . Below , instead
the dependence of on is weaker.
The RLF determined in this work extends to optical luminosities 5
magnitude fainter than Auriemma et al. (1977). However, it does
not comprise radio luminosities greater than . The
only powerful radio galaxy in Virgo is M87, which is in fact
right above .
With our data we can study how the radio properties of E galaxies
scale with the optical luminosity below .
The dependence of the probability for E galaxies
to develop radio sources with is represented in Fig. 7
as a function of the optical luminosity.
Together with our data, Fig. 7 also represents the
results of Auriemma et al. (1977) (dotted line, adapted from their
Fig. 5) which appear in full agreement with ours.
The three brightest points () are
well represented by ; however, below , the data
are consistent with no further dependence from .
It is instructive to compare Fig. 1b with Fig. 7, which contain complementary
information: Fig. 1 shows the dependence of the radio on the optical luminosity
of the detected objects, while Fig. 7 adds the information on the frequency
at which Early-type galaxies develop radio sources (with a given radio luminosity)
as a function of the optical luminosity.
We conclude that, while the frequency with which E galaxies feed
the ”monsters” in their nuclei is strongly related to their total
mass, that of fainter radio sources is progressively less sensitive on the
system mass. In fact it does not decrease from to
. The faintest giant E galaxies have similar probability
of feeding low power radio sources than dwarf E galaxies 3-4
mag fainter.
6 Summary
In summary the present investigation brought us to the following empirical results:
1) Late-type galaxies develop radio sources with a probability proportional
to their optical luminosity. In fact their radio/optical ratio is a gaussian
distribution centered at , i.e. the radio luminosity is 0.3
of the optical one. About 20 % of all spiral galaxies is detected at the peak
of the distribution.
2) The probability of late-type galaxies to develop radio sources is almost
independent of their detailed Hubble type, except that Sa (and S0+S0a) are at
least a factor of 5 less frequent at any value of radio/optical.
3) The relation between and the equivalent width of the line
is of direct proportionality.
4) The luminosity of radio sources associated with Early-type galaxies increases
non-linearly with the optical luminosity of their parent galaxies.
5) The probability of finding low luminosity () radio sources
associated with Early-type galaxies scales non-linearly with the optical luminosity.
Acknowledgements.
We wish to thank P. Pedotti for her contribution to this work, T. Maccacaro for useful discussions and B. Binggeli for providing us with the VCC in digital form. This work could not be completed without access to the New Extragalactic Data- Base (NED) which is operated by the Jet Propulsion Laboratory, California Institute of Technology, under contract with the National Aeronautics and Space Administration. We wish also to acknowledge J. Condon and the NVSS team for their magnificent work.References
- [] Auriemma C., Perola C., Ekers R., et al. 1977, A&A, 57, 41
- [] Avni Y., Soltan A., Tananbaum H., Zamorani C., 1980, ApJ, 238, 800
- [] Binggeli B., Sandage A., Tammann G., 1985, AJ, 90, 1681 (VCC)
- [] Binggeli B., Popescu C., Tammann G., 1993, A&AS, 98, 275
- [] Binggeli B., Cameron L., 1993, A&AS, 89, 297
- [] Burstein D., Heiles C., 1982, AJ, 87, 1165
- [] Condon J., 1980, ApJ, 242, 894
- [] Condon J., 1987, ApJS, 65, 485
- [] Condon J., 1989, ApJ, 338, 13
- [] Condon J., Helou G., Sanders D., Soifer B., 1990, ApJS, 73, 359
- [] Condon J., 1992, ARA&A, 30, 575
- [] Condon J., Cotton W., Greisen E., et al., 1998, AJ, 115, 1693 (NVSS)
- [1986] Gavazzi G., Jaffe W., 1986, ApJ, 310, 53
- [] Gavazzi G., Contursi A., 1994, AJ, 108, 24
- [1996a] Gavazzi G., Boselli A., 1996, Astroph. Lett & Commun, 35, 1
- [] Gavazzi G., Boselli A., Scodeggio M., Pierini D., Belsole E., 1998, MNRAS (in press)
- [] Gavazzi G., Boselli A., 1998, A&A (in press) (Paper II)
- [] Jaffe W., Gavazzi G., 1986, AJ, 91, 204
- [] Hummel E., 1980, A&AS, 41, 151
- [] Hummel E., 1981, A&A, 93, 93
- [] Kennicutt R., 1999, ARA&A, (astro-ph/9807187)
- [] Kotanyi C., 1980, AAS, 41, 421
- [] Ledlow M., Owen F., 1996, AJ, 112, 9
- [] Prandoni I., Gregorini L., Parma P., et al., 1998, in Looking Deep in the Southern Sky, eds. Morganti & Couch (Springer-Verlag), in press.