A NEAR-INFRARED STUDY OF THE PLANETARY NEBULA NGC 2346 ††thanks: Based on observations obtained at the TIRGO telescope
Abstract
This paper presents new near-infrared observations of the planetary nebula NGC 2346. The data include a broad K–band image, an image in the H vibrationally excited 1-0S(1) line and K band slit spectra at three positions in the nebula. In the H 1-0S(1) line, the nebula is characterized by a central, bright torus, surrounded by weaker emission with a typical butterfly shape, as seen in H and CO lines. The K band spectra show 11 H lines with excitation energies from 6150 to 12552 K. The H data have been compared to the predictions of models which follow the evolution with time of the H emission in PNe of different core mass and shell properties (Natta & Hollenbach 1998). These models compute the emission originating in the photodissociation region (PDR) created at the inner edge of the neutral shell by the UV radiation of the central core, as well as the emission in the shock associated to the expansion of the shell inside the precursor red-giant wind. In NGC 2346, a PDR origin of the H emission in a low-density molecular shell ( cm) is indicated. At these low densities, time-dependent H chemistry and X-ray heating of the neutral gas enhance the predicted PDR H line intensity by large factors.
Key Words.:
Planetary Nebulae; NGC 2346; IR spectroscopy; H lines1 Introduction
NGC 2346 is a much studied bipolar planetary nebula at a distance pc (Acker et al. 1992)111 After this work was completed, a new determination of the distance (=690 pc) was quoted by Terzian (1997). It is close enough to the value we adopt in this paper that none of the conclusions needed to be changed.. At its center lies a binary system, formed by a main-sequence star of spectral type A5V, with mass M, temperature K and luminosity L(Méndez and Niemela 1981; Walsh 1983) and hot star, not detected in the visual, with T K (Méndez 1978), which excites the nebula. Its luminosity is very uncertain, as we will discuss in §4. Estimates in the literature give L L(Méndez 1978; Calvet and Peimbert 1983).
In the optical, the nebula has a butterfly shape (Balick 1987; Walsh et al. 1991), with well developed bipolar lobes and a bright torus which surrounds the central star. The temperature and density of the ionized gas in the torus have been estimated to be K and cm, respectively (Liu et al. 1995; McKenna & Keenan 1996). The nebula contains a large amount of material in the form of molecular gas, as revealed by the CO observations of Knapp (1986), Huggins & Healy (1986), Healy & Huggins (1988). Bachiller et al. (1989) have mapped the entire nebula in the two CO lines J=1-0 and J=2-1; the morphology of the molecular gas follows very closely that of the ionized gas, showing a clumpy, inhomogeneous torus, tilted with respect to the line of sight by about 56, which is expanding outward. Scaled to our adopted distance pc, the torus has a radius of 0.05 pc, and mass 0.26 M, much larger than the mass of ionized gas (0.01 M, Walsh 1983). The radial velocity of the most intense CO condensations is of the order of 15–35 km s, which results in a dynamical age of about 2500 yr (but see also Walsh et al. 1991).
NGC 2346 is a Type I nebula, originated by a massive progenitor (Calvet and Peimbert 1983). As many PNe of similar type, NGC 2346 is detected in the vibrationally excited lines of H(Webster et al. 1988). Zuckerman & Gatley (1988) have mapped the nebula in the 1-0S(1) line at 2.12 m using a single-beam 12 arcsec spectrometer with resolution 200. The morphology of the nebula in this line is again very similar to the morphology observed in the optical lines and in CO. This result was confirmed more recently by the images obtained in the same line with much better spatial resolution (about 1-2 arcsec) by Kastner et al. (1994) and Latter et al. (1995).
The excitation mechanism of the vibrationally excited H lines in this, as in other PNe, is still uncertain. Zuckerman & Gatley (1988) discuss the possibility that they form in a shock driven by the fast wind emitted by the central star. Kastner et al. (1994) surveyed a sample of bipolar planetary nebulae (including NGC 2346); they conclude that the H emission very likely originates in thermally excited (possibly shocked) molecular gas. Recently, Natta & Hollenbach (1998; hereafter NH98) have computed theoretical models of the evolution of PN shells and predicted, among others, the intensity of the most commonly observed H vibrationally excited lines (namely, the 1-0S(1) at 2.12 m and the 2-1S(1) at 2.25m). They consider the emission of the photodissociation region (PDR) formed by the UV photons emitted by the central star impinging on the shell, including in the calculations time-dependent H chemistry and the effects of the soft X-ray radiation emitted by the central star, which are important in sources like NGC 2346 where T K. NH98 compute also the emission of the shocked gas at the interface between the shell and the wind ejected by the central star in its previous red giant phase. They point out that both mechanisms (PDR and shocks) can produce lines of similar intensity, with reasonable values of the model parameters.
The PN properties that determine the intensity of the H lines are very different in the two cases. As discussed in NH98, if the emission is produced in the warm, neutral PDR gas, the line intensity depends mostly on the stellar radiation field which reaches the shell and, to a lower degree, on the density of the neutral gas itself. If the emission is produced in the shocked gas, then the line intensity does not depend directly on the properties of the central star or of the PN shell, but only on the shock velocity and on the rate of mass-loss of the precursor red-giant. It is therefore clear that, before attributing any diagnostic capability to the H lines, we need to understand which of the possible excitation mechanisms dominate the PN emission.
This paper is a first attempt to understand the H emission of a well-studied PN in a quantitative way, i.e., by comparing the observations to detailed models of PDR and shock emission, such as those discussed in NH98. To this purpose, we have collected new near-IR broad and narrow-band images of NGC 2346 as well as K band spectra with resolution 1000. These observations are described in §2. The results are described in §3 and compared to the predictions of PDR and shock models in §4. A discussion of the results follows in §5; §6 summarizes the main conclusions of the paper.
2 Observations
2.1 ARNICA Observations
NGC 2346 was observed during two observing runs in January 1996 using ARNICA (ARcetri Near Infrared CAmera) mounted on the 1.5m TIRGO222The TIRGO telescope is operated by the C.A.I.S.M.I.-C.N.R Firenze, Italy telescope. ARNICA is equipped with a 256x256 NICMOS3 array, the pixel size with the optics used at TIRGO is ; for a complete description of instrument performances, see Lisi et al. (Lea96) and Hunt et al. (Hea96). Images were obtained in the K broad-band filter (centered at 2.2 m) and in a narrow-band filter centered on the 2.12 H 1-0S(1) line (, Vanzi et al. VGCT97 ). The seeing was approximately 2-3″and the observed field was , covering all the nebula.
Data reduction was carried out using the IRAF333IRAF is made available to the astronomical community by the National Optical Astronomy Observatories, which are operated by AURA, Inc., under contract with the U.S. National Science Foundation and ARNICA (Hunt et al. 1994) software packages. Photometric calibration in the K band was performed by observing the photometric standards of the FS14 group from the list of Hunt et al. (Hea97). The quality of the night was rather poor, and the calibration accuracy is estimated to be .
The image in the H 1-0S(1) line has been calibrated using the 5 brightest (unsaturated) stars in the ARNICA images, under the assumption that for each star the flux density measured in the line filter was equal to the flux density measured in the K band. Integrated line fluxes on the nebula were then obtained multiplying the flux density by the bandwith of the narrowband filter (Vanzi et al. 1998). The accuracy is 15%.
2.2 LONGSP Observations
K (2.2 m) band spectra of NGC 2346 were obtained using the LonGSp (Longslit Gornergrat Spectrometer) spectrometer mounted at the Cassegrain focus on the TIRGO telescope. The spectrometer is equipped with cooled reflective optics and grating in Littrow configuration. The detector is a 256256 engineering grade NICMOS3 array (for detector performances see Vanzi et al. VMG95). The pixel sizes are 11.5 Å (first order) and 173 in the dispersion and slit directions, respectively. LONGSP operates in the range 0.9-2.5 m achieving a spectral resolution at first order of 950 in K. For a more comprehensive description of the instrument, refer to Vanzi et al. (Vea97).
Observations were conducted in March 1998 under non-photometric conditions. The slit had dimensions 3570″ and was oriented N-S. The seeing during the observations was in the range 2″–4″. NGC 2346 was observed at three slit positions labeled as E, S, W and shown in Fig. 1 superimposed on the image in the H 1-0S(1) line. Position E and W are centered on the peaks of the line emission located east and west of the central star, respectively (see Zuckerman and Gatley 1988). Position S is centered on the star. At each grating position we performed 5 ABBA cycles (A=on source, B=on sky) with an on-chip integration time of 60 sec, for a total of 10 min integration on source.
Data reduction was performed with the ESO package MIDAS, within the context IRSPEC, modified to take into account LonGSp instrumental characteristics. The frames were corrected for bad pixels, flat-fielded, sky subtracted and wavelength calibrated using the OH sky lines present in all the frames (Oliva & Origlia OO92). After direct subtraction, sky removal was optimized by minimizing the standard deviation in selected areas where the OH sky lines were poorly subtracted but no object emission was present. The wavelength calibration was performed to better than 1/5 of a pixel (2Å). The spectra were then corrected for telluric absorption by dividing the spectra by the spectrum of the A star BS 2714 after removing its photospheric features (mainly Br). For more details on LonGSp data reduction, see Vanzi et al. Vea97.
Flux calibration of the spectra was achieved by rescaling the observed flux distribution along the slit to match that obtained from the ARNICA image in the 1-0S(1) line at the positions of the slits.
3 Results
The image in the H 1-0S(1) line is shown in Fig. 1. As verified with the spectra, the continuum emission is everywhere negligible but at the position of the central star, i.e. in a 5″ radius region centered on the star.
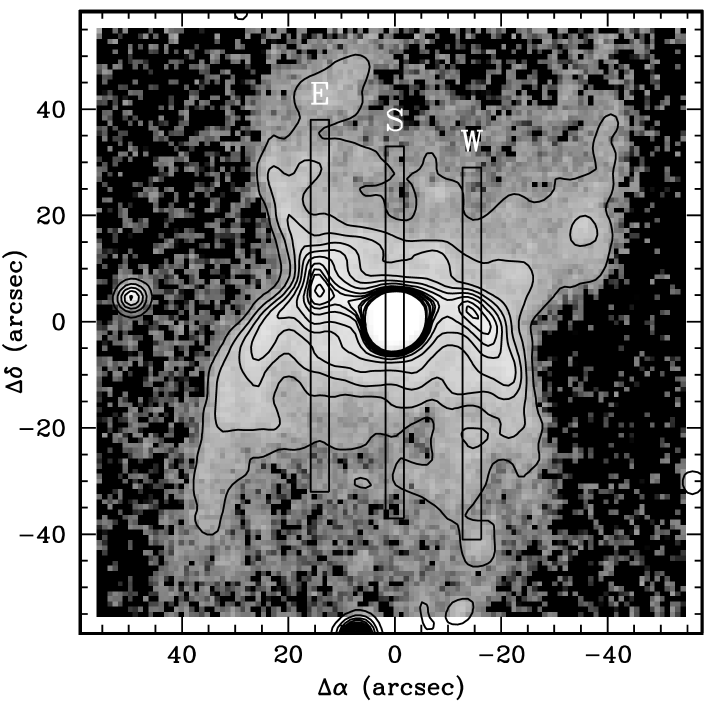
The H 1-0S(1) image of Fig. 1 shows the well-known NGC 2346 morphology, with a bright central region of size 50″20″ and two very extended lobes of weaker emission (Kastner et al. 1994). The central region has two peaks of emission, to the east and west of the star and matches well the bright torus, tilted with respect to the line of sight, seen in optical tracers and in CO (Walsh 1983; Bachiller et al. 1989). The H 1-0S(1) intensity is erg cm s sron both peaks. The total luminosity of the nebula in this line is about 0.06 L(for pc), of which about 48% is contributed by the torus. The average line intensity over the torus (defined as the central region of size 20″50″) is erg cm s sr. These numbers are very similar (within 10-20%) to those derived by Zuckerman and Gatley (1988).
The K band spectra in the three positions E, S and W are shown in Fig. 2. The spectra have been averaged over a region of 20″ (12 pix) along the slit centered on the torus midplane. The line intensities are given in Table 1 , which gives in Column 1 the line identification, in Column 2 the wavelength of the line, in Column 3 the intensity in the W position, in Column 4 that on the E position, in Column 5 that in the S position of the slit. The lines are normalized to the 1-0S(1) line set equal to 100; the intensity of the 1-0S(1) line is given in the Table’s note. Typical uncertainties on the line ratios are 10% for ratios 50, and 30% for the others. Lines whose intensity is particularly uncertain are marked with a semicolon.

| Line | W | E | S | |
|---|---|---|---|---|
| (m) | ||||
| 1-0S(3) | 1.958 | 50 | 68 | 43 |
| 1-0S(2) | 2.034 | 36 | 37 | 39 |
| He I | 2.058 | 6: | 2 | 6 |
| 2-1S(3) | 2.073 | 6.2 | 5.9 | 9: |
| 1-0S(1) | 2.122 | 100 | 100 | 100 |
| 2-1S(2) | 2.154 | 4 | 4 | 11 |
| Br | 2.166 | 8.7 | 4.7 | 16 |
| 3-2S(3) | 2.201 | 4 | 4 | – |
| 1-0S(0) | 2.223 | 20 | 21 | 23 |
| 2-1S(1) | 2.248 | 7.0 | 6.7 | 9 |
| 3-2S(2) | 2.287 | 4 | 4 | – |
| 2-1S(0) | 2.355 | 4 | 4 | – |
| 3-2S(1) | 2.386 | 4 | 4 | – |
| 1-0Q(1) | 2.406 | 44 | 44 | 49 |
| 1-0Q(2) | 2.415 | 20 | 25 | 20 |
| 1-0Q(3) | 2.424 | 46 | 41 | 35 |
| 1-0Q(4) | 2.437 | 24 | 26 | 20 |
| 1-0Q(5) | 2.454 | 51 | 55 | 43 |
Note: 1-0S(1) intensity 100 corresponds to
erg cms sr in the W position,
erg cms sr in the E position
and erg cms sr in the S
position.
The spectra have been averaged over a slit portion 10″ centred on the torus midplane.