Federal Republic of Germany 22institutetext: CEA/Saclay, DAPNIA, Service d’Astrophysique, L’Ormes des Merisiers, Bât. 709,
F–91191 Gif-sur-Yvette, France
X-ray observations of the starburst galaxy NGC 253:
I. Point sources in the bulge, disk and halo
††thanks:
based partially on observations performed at the European
Southern Observatory, La Silla, Chile
Abstract
We report the results of a deep spatial, spectral, and timing analysis of ROSAT HRI and PSPC observations of the edge-on starburst galaxy NGC 253. In this first paper, point-like X-ray sources detected within the galaxy and in the field are discussed. The sources are characterized by their X-ray properties (including comparisons with results from the Einstein and ASCA satellites), by correlations with other wavelength and some optical spectroscopic follow up observations.
In total, 73 X-ray sources have been collected in the NGC 253 field, 32 of which are associated with the disk of the galaxy. Though 27 of these disk sources are detected with the HRI (some being resolvable with the PSPC), the remaining 5 PSPC-only detected sources are likely not to be real point sources, being instead due to fluctuations within the X-ray structure of the disk. The source close to the center of the galaxy is extended ( erg s-1 in the ROSAT 0.1–2.4 keV band), and is most likely associated with the nuclear starburst activity. The remaining sources have luminosities ranging from erg s-1 to erg s-1, yielding an integrated point source luminosity of erg s-1. The brightest point-like source is located south of the nucleus, at the border of a plume of diffuse X-ray emission. Its high X-ray luminosity, time variability and hard spectrum make it a good candidate for a black hole X-ray binary.
Including four Einstein detections of X-ray transients the number of point-like X-ray sources in NGC 253 increases to 30 sources, 13 of which are time variable. These time variable sources are all brighter than erg s-1 and most likely represent X-ray binaries radiating close to or at the Eddington limit. Besides the nuclear source there is only one source above this luminosity that shows no time variability and therefore may represent a young supernova or extremely bright supernova remnant, or an unresolved cluster of several X-ray sources. The point source population of NGC 253 is compared to that of other galaxies, and it is shown that the luminosity distribution matches ROSAT results obtained for M 31 and M 33.
The halo of NGC 253 is filled with diffuse, filamentary X-ray emission. Seven sources are located (or projected) in this diffuse emission region. Time variability arguments, together with optical identifications, are put forward to explain 4 sources as background objects, the other 3 sources likely being spurious detections caused by local enhancements in the diffuse emission of the halo of NGC 253. The diffuse X-ray emission components of NGC 253 will be discussed in a separate paper.
The sources detected in the field outside the disk of NGC 253 cover a flux range from erg cm-2 s-1 in the 0.1–2.4 keV band. None of the sources in the field correlate with published lists of globular cluster candidates. Optical counterparts are proposed for 27 of them, and a few also correlate with radio sources. While two sources are identified as foreground stars, the remaining ones are mostly background active galactic nuclei.
Key Words.:
Galaxies: individual: NGC 253 – Galaxies: spiral – Galaxies: starburst – X-rays: galaxies1 Introduction
NGC 253 is a nearby, almost edge-on spiral galaxy. Some physical parameters of the galaxy, such as distance, inclination or diameter, are summarized in Table 1. The galaxy is classified as a starburst galaxy with a very high level of nuclear starburst activity (cf. Carral et al. 1994 for an overview). Detailed X-ray observations of the galaxy have been carried out in the past with the Einstein satellite (Fabbiano & Trinchieri 1984, Fabbiano 1988). More recent X-ray observations obtained with the ASCA satellite are reported by Ptak et al. (1997).
| Ref. | ||
|---|---|---|
| Type | Sc | ∗ |
| Assumed distance | 2.58 Mpc | ♯ |
| (hence 1 pc) | ||
| Position of | † | |
| center (2000.0) | ||
| 254 | ∗ | |
| Corrected | 188 | ∗ |
| Axial ratio | 0.23 | ∗ |
| Position angle | 52° | ‡ |
| Inclination | 86° | ∗ |
| Galactic foreground | 1.3 cm-2 | ♣ |
References:
∗ Tully (1988)
♯ Puche & Carignan (1988)
† Forbes et al. (1991)
‡ SIMBAD data base, operated at CDS, Strasbourg, France
♣ Dickey & Lockman (1990)
The Einstein HRI and IPC measurements established a total X-ray luminosity of erg s-1 and erg s-1, respectively, for the disk of NGC 253 (0.2–4 keV Einstein band, corrected for Galactic foreground absorption). Eight point-like sources with luminosities erg s-1 were detected in the bulge and disk of the galaxy, with an integrated point source luminosity of erg s-1. The brightest point source, south of the center of the galaxy, reached erg s-1, and X-ray emission in the inner bulge of the galaxy was discernible with erg s-1. A plume-like, diffuse X-ray emission feature (‘jet’) protrudes along the minor axis from the nucleus towards the south east, with a luminosity of erg s-1. Fabbiano & Trinchieri (1984) attributed this emission to a hot ( K), gaseous component of the interstellar medium, connected to the nuclear starburst activity. Additional diffuse X-ray emission from the hot component was detected both, in the disk ( erg s-1) and to the north western side of the halo ( erg s-1) (Fabbiano 1988).
Contrary to the Einstein data, ASCA observations allow detailed spectral analysis of the integral NGC 253 emission ( erg s-1 in the 0.5–10 keV ASCA band). However, it is difficult to disentangle the different point sources due to the large ASCA point spread function (PSF) of at Full Width Half Maximum (FWHM).
We performed deep X-ray observations of NGC 253 with the ROSAT high resolution imager (HRI) and position sensitive proportional counter (PSPC). A description of the satellite and the detectors on board is given in Trümper (1983) and Pfeffermann et al. (1987). Whereas the ROSAT HRI allows good spatial separation of point sources from diffuse emission, due to its narrow PSF ( FWHM), with the PSPC (high sensitivity in the 0.1 – 2.4 keV band, FWHM for the 0.5–2.0 keV band), one can perform spectral analysis for bright point-like sources and diffuse emission components, and establish X-ray colors (hardness ratios).
In this paper, we make use of the high collecting power of the ROSAT telescope/detector systems to derive a detailed point source catalog for the NGC 253 field with special emphasis on the sources in the bulge, disk and halo of NGC 253 (Sects. 2 and 3). In Sect. 4, the nature of the detected point-like sources is discussed and the source catalog is compared to previous results regarding X-ray point sources in NGC 253 and other galaxies and to results from other wavelengths. Sect. 5 gives a summary of the results. X-ray sources in the field of NGC 253, together with identifications proposed from cross-correlations with optical and radio catalogs and optical follow-up spectroscopy are discussed in the appendix.
In a complementary paper (Pietsch et al. 1998a, hereafter PEA), we investigate the diffuse X-ray emission features in the bulge, disk and halo of NGC 253, after subtracting the point sources.
2 Observations and data analysis
NGC 253 was observed with the ROSAT HRI and PSPC for 57.7 ks and 22.8 ks, respectively. Both the HRI and PSPC observations are each spread over approximately 3.5 years and consist of 6 HRI and 2 PSPC observation blocks, each subdivided into several observation intervals (OBIs). The date and integration times for the different observation blocks are listed in Table 2.
| Det. | Date | rel. time in days | ||
|---|---|---|---|---|
| 1 | HRI | 08 NOV – 10 DEC 1991 | 0 – 0.9 | 3.1 ks |
| 2 | PSPC | 25 DEC – 31 DEC 1991 | 11.9 – 15.9 | 11.7 ks |
| 3 | PSPC | 03 JUN – 05 JUN 1992 | 125.7 – 126.6 | 11.2 ks |
| 4 | HRI | 05 JUN – 06 JUN 1992 | 127.1 – 127.5 | 15.1 ks |
| 5 | HRI | 06 JUN – 07 JUN 1992 | 127.7 – 127.9 | 10.1 ks |
| 6 | HRI | 03 JAN – 07 JAN 1995 | 791.6 – 794.5 | 9.5 ks |
| 7 | HRI | 13 JUN – 15 JUN 1995 | 905.5 – 906.9 | 13.9 ks |
| 8 | HRI | 05 JUL – 07 JUL 1995 | 921.2 – 922.7 | 5.9 ks |
The data reduction was performed with the ESO-MIDAS/EXSAS (ESO-MIDAS 1997, Zimmermann et al. 1997) software package.
2.1 Attitude corrections
Attitude solutions of ROSAT pointings used by the Standard Analysis Software System (SASS, Voges 1992) to produce event files are known to produce residual integral errors of the order of 6′′ (boresight error) for an observation, and – due to short term fluctuations – systematically broaden the PSF. To improve on the solution we adopted two (subsequent) techniques.
Firstly, for the PSPC observations the positions of point sources during the first and second PSPC observation block were compared, and the two blocks – using different guide star patterns for the attitude solution – were aligned. For the HRI, to improve the intrinsically narrower PSF, all observation intervals were aligned with respect to the first one by computing the centroid for 8 bright point-like X-ray sources visible in each OBI. No offset was seen to exceed 4′′.
In a second step, the positions of 13 possible optical counterparts (derived from the ROE finding charts, Irwin et al. 1994), coinciding to within with point source HRI error circles, were used to determine the systematical offset of the preliminary attitude solution. The HRI observations were corrected for this offset (translation of 19 and 11 to the E and N, respectively). The PSPC observations were co-aligned (30 and 36 to the E and N, respectively, counterclockwise rotation of 0.27∘) with the HRI solution. All X-ray source positions given in this paper have already been transformed into the sky coordinate system. The systematical error of the final source positions is determined as the residual error of the transformations (25).
2.2 Image generation
2.2.1 Images of the HRI observations
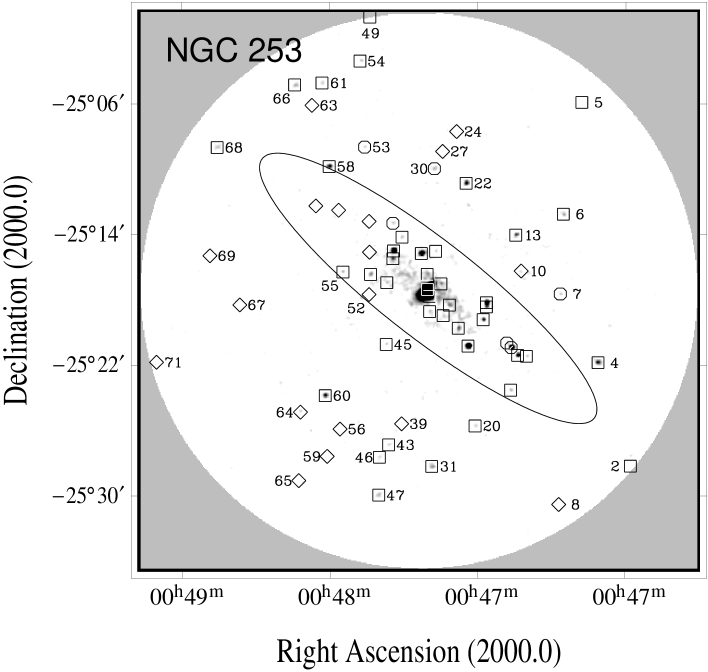
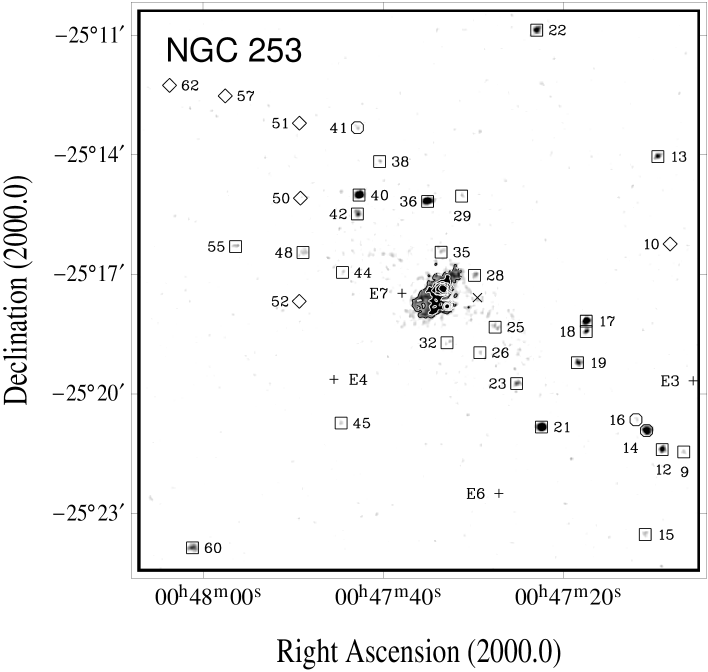
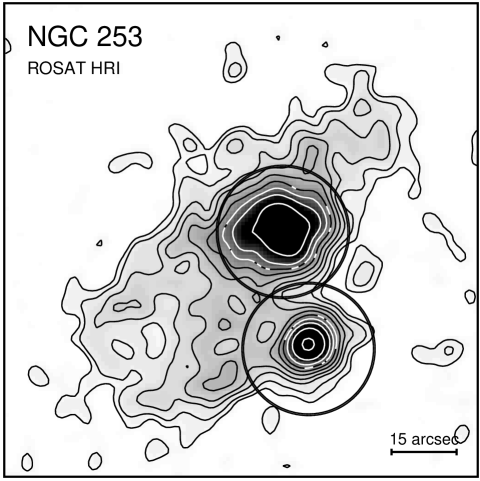
To reduce the background due to UV emission and cosmic rays, HRI images were integrated using raw channels 2–8. An 35′ image (0.1–2.4 keV band) was constructed with a bin size of 25 and smoothed with a Gaussian filter of 12′′ FWHM (Fig. 1). The optical extent of the galaxy is indicated by the ellipse. A close-up view of the inner 14′ field of the HRI (Fig. 2) has been formed with a bin size of 1′′ and smoothed with a filter of 5′′ FWHM, corresponding to the FWHM of the on-axis HRI PSF. Within a radius of from the center of the HRI, the PSF does not deteriorate significantly. To investigate the detailed structure of the central 2′ region of the galaxy (over-exposed in Figs. 1 and 2), we overlaid X-ray contours over a greyscale plot of the central area of the image used for Fig. 2 (Fig. 3).
2.2.2 Image of the PSPC observations
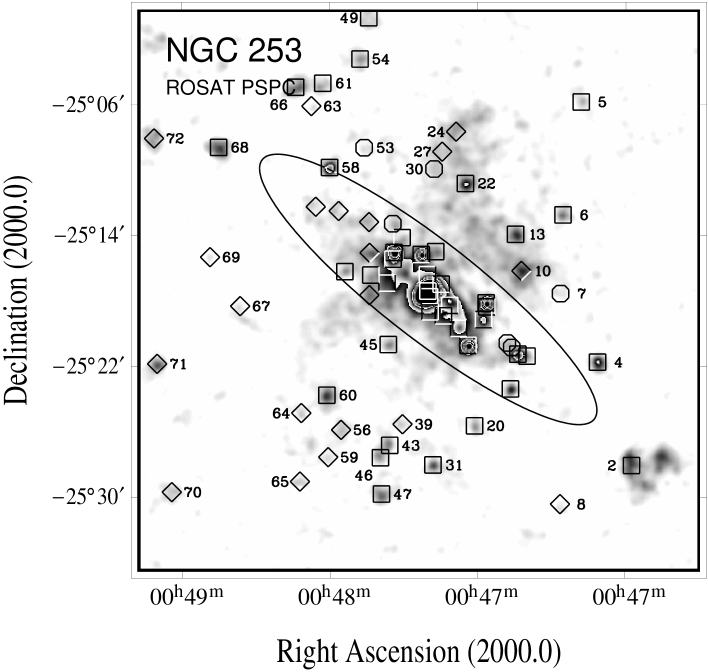
A 0.1–2.4 keV PSPC image (Fig. 4) was constructed by the superposition of sub-images in 8 standard bands (R1 to R8, cf. Snowden et al. 1994). Each sub-image has been corrected for exposure, deadtime, and vignetting, and the sub-images have been smoothed with a Gaussian filter corresponding to the on-axis PSF of the energy band (FWHM ranging from 52′′ to 24′′ for the lowest to the highest energy band). To make the full dynamic range of the PSPC data visible in one image, a greyscale representation is chosen running several times from bright to dark.
2.3 Constructing a combined HRI/PSPC point source catalog
2.3.1 HRI point source detection
Point sources were searched for in the full HRI field of view with the EXSAS local detect, map detect and maximum likelihood algorithms (Zimmermann et al. 1997), using images of pixel size 5′′. To reduce the background due to UV emission and cosmic rays only those events detected in HRI raw channels 2–8 were used. Sources with a detection likelihood were accepted. Maximum likelihood values () can be converted into probabilities () through , thus corresponds to 3.6 Gaussian sigma significance (cf., e.g. Cruddace et. al 1988).
Within a field centered on the nucleus of NGC 253 and extending along the major and along the minor axis, point sources are seen embedded in extended emission structures, not resolved by the HRI. Since the background map in this region does not follow the filamentary diffuse structures, a maximum likelihood algorithm, comparing the local X-ray brightness with the local value of the background map, might pick up extended emission regions as point sources. To avoid this, we only accepted sources detected by the local detect algorithm in regions of enhanced diffuse emission. The local detect algorithm looks for gradients in the image with help of a sliding box method and adapts better to local changes in the background. One exception was within a bright part of the southeastern extension of the central diffuse X-ray emission. Here, we manually excluded a spurious source detected by the local detect algorithm at a position east of the bright source close to the nucleus. Our final HRI source list comprises a total of 49 sources in the HRI field of view.
2.3.2 PSPC point source detection
Source positions and count rates were calculated for the inner PSPC field in the five standard energy bands ‘broad’ (0.11–2.40 keV), ‘soft’ (0.11–0.41 keV), ‘hard’ (0.52–2.01 keV), ‘hard1’ (0.52–0.90 keV), and ‘hard2’ (0.91–2.01 keV). All images used for the source detection have a bin size of 5′′. As with the HRI, the EXSAS local detect, map detect, and maximum likelihood algorithms were applied to each energy band. Sources with a likelihood 9 () were accepted, and the source lists within each of the different energy bands merged, assuming that detected source positions were identical if their separation is less than 3 times the statistical position error. The final source position was taken from the energy band in which the source was found with the highest likelihood. One PSPC source was located in between two HRI sources (X43 and X46), separated by . The fact that this PSPC source was flagged as extended (extent FWHM) by the detection algorithms strongly suggested that it represents the combined unresolved emission from the two HRI sources, and this source therefore, was removed from the PSPC source list. Later, when merging the HRI and PSPC lists, the PSPC count rates for X43 and X46 were calculated with fixed positions suggested by the HRI.
The energy resolution of the PSPC detector allows the calculation of ‘X-ray colors’ for the X-ray sources, the hardness ratios HR1 and HR2. The ratios are defined on the basis of the net counts in the soft, hard, hard1, and hard2 bands. By definition, HR1 = (hard–soft)/(hard+soft), and HR2 = (hard2–hard1)/(hard2+hard1) (soft here means the counts in the soft band etc.).
2.3.3 Combined HRI/PSPC point source catalog
From the HRI and PSPC catalogs, a combined point source catalog (Table 3) was constructed. Column 1 gives the source numbers, that are used to identify sources in Figs. 1 to 4. The R XJ name (following the naming convention for ROSAT sources according to Zimmermann et al. 1997) is contained in col. 2. Columns 3 and 4 give the source positions (right ascension and declination, equinox 2000.). Sources with spatial separations between the HRI and PSPC positions smaller than the sum of the 90% error radii were taken as identical (the ‘detector flag’ in col. 5 has the entry ‘B’ for both). If a source existed only in the PSPC or HRI source list, an entry ‘P’ (PSPC) or ‘H’ (HRI), is given in col. 5. Sources have the entry confused (‘C’) in col. 6 if the PSPC hard band image shows extended emission surrounding the source, or the HRI image resolves two point sources separated by a distance smaller than the PSPC hard band PSF. For confused sources, the position information was always taken from the HRI source list. For other ‘B’ sources, the position information with the smaller statistical position error was selected. The position errors, including a 25 systematical error, are given in col. 7. The likelihood for source detections is displayed in cols. 8 (HRI) and 9 (PSPC).
Columns 10 and 11 give the net counts of the X-ray sources, cols. 12 and 13 the count rates, corrected for exposure, deadtime, and vignetting. In the case of HRI non-detections at PSPC source positions, HRI counts were calculated at the position suggested by the PSPC. To do so, HRI counts were extracted with a cut radius of 1.5 times the local FWHM of the HRI PSF at the PSPC source position, and background counts subtracted determined at that position in the EXSAS background maps. For sources with detection likelihoods , upper limits, at a 2 confidence level, are given. PSPC counts for isolated sources were determined using the source detection results. For confused PSPC sources with nearby point sources (separation below the FWHM of the hard band PSF), a ‘multi source fit’ technique (cf. Zimmermann et al. 1997) was used with source positions fixed according to the HRI detections. For PSPC confused sources without nearby point sources, the counts were extracted within a cut radius of the FWHM of the PSPC PSF around the HRI position, and a local background, determined in a concentric ring from to the FWHM around the source position, was subtracted. For all HRI sources, for which no PSPC source with a likelihood was found, upper limits (2), have been calculated.
2.4 Time variability investigations
To study time variability of point sources, counts and count rates were determined for the individual observation blocks listed in Table 2. The rates were calculated with fixed source positions. The ‘likelihood ratio test’ (cf., e.g. Cash 1979, Hogg & Tanis 1983) was used to test for variability. Since the comparison of HRI and PSPC count rates depends on the assumed spectral model (cf. Table 4), the HRI or PSPC observations were analyzed separately.
| Model | ECFHRI⋆ | ECFPSPC⋆ | |
|---|---|---|---|
| thermal Bremsstrahlung, keV† | 4.17 | 1.29 | 3.23 |
| thermal Bremsstrahlung, keV | 4.55 | 1.10 | 4.14 |
| thin thermal plasma, keV | 3.77 | 1.12 | 3.36 |
The ‘likelihood ratio test’ for the six HRI blocks was performed as follows: one starts with the hypothesis of a time constant source. Count rates during the block i are defined by the ratio of the detected counts and the observation time , and these rates should be equal for each block: , in the case of no variability. The likelihood ratio is defined as . If the hypothesis of no variability is true, then due to the counting statistics has a distribution with 5 degrees of freedom.
3 Results
3.1 HRI and PSPC point sources in the NGC 253 field
In the NGC 253 field (Figs. 1, 2 and 4) 73 X-ray point sources are detected, 23 with both detectors (marked in the figures as squares), and 22 and 28 of which exclusively with the HRI (hexagons) and PSPC (diamonds), respectively.
Assuming a 5 keV thermal Bremsstrahlung spectrum (0.1–2.4 keV band and corrected for Galactic foreground absorption, cf. Table 4), the HRI count rates convert to fluxes between erg s cm-2 (source X29) and erg s cm-2 (X34). Similarly, PSPC derived fluxes span erg s cm-2 (X63) to erg s cm-2 (X34). As one can see, the longer observation time for the HRI – about a factor of three with respect to the PSPC observation time – makes up for the lower HRI sensitivity leading to almost identical detection limits for the PSPC and HRI observations.
To allow a crude estimation of the spectral properties of the point sources, their hardness ratios (columns 14 and 15 of Table 3) were calculated. To first order, HR1 traces the absorption and, to a lesser degree, the hardness of the spectrum, while HR2 mainly traces the hardness of the spectrum (cf. e.g. Vogler & Pietsch 1996). The hardness ratios are useful in estimating the absorption and spectral behavior of point sources, for which the low photon statistics do not allow spectral investigations. For non-confused sources the cut diameters for the sub-bands are chosen according to the PSF FWHM for the corresponding off-axis angle and energy sub-band, and the background is subtracted with the help of the background maps. In cases where the error exceeds the counts in one sub-band, only an upper (lower) limit of the hardness ratio is calculated. For that, the counts of the non detected band are chosen to be equal to the upper limit (). Where the errors exceed the counts in both sub-bands, no hardness ratios are calculated. For confused sources, HR1 is not calculated, since problems might arise on account of the large extraction radius used for the PSPC soft band and, to calculate the HR2, counts and errors in the hard1 and hard2 band were deduced with the help of the multi source fit technique.
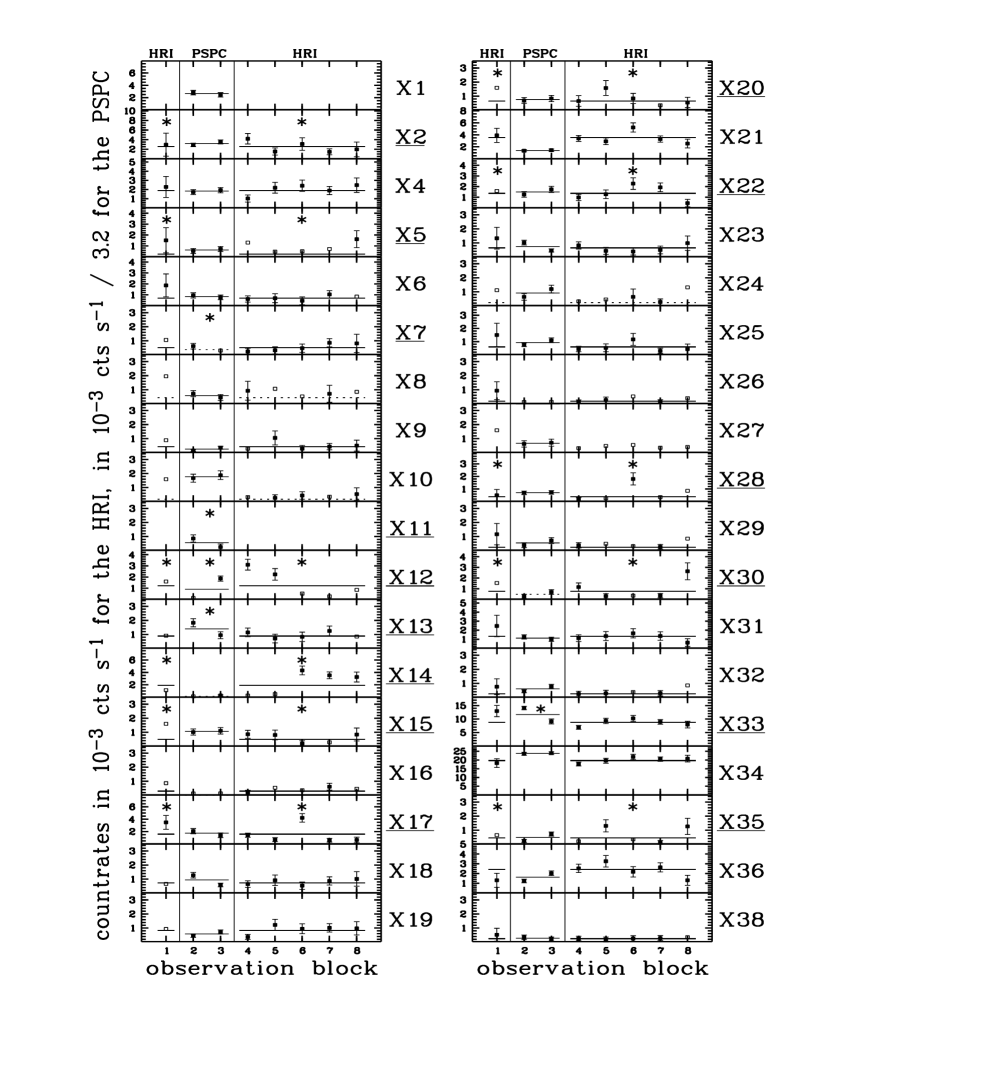
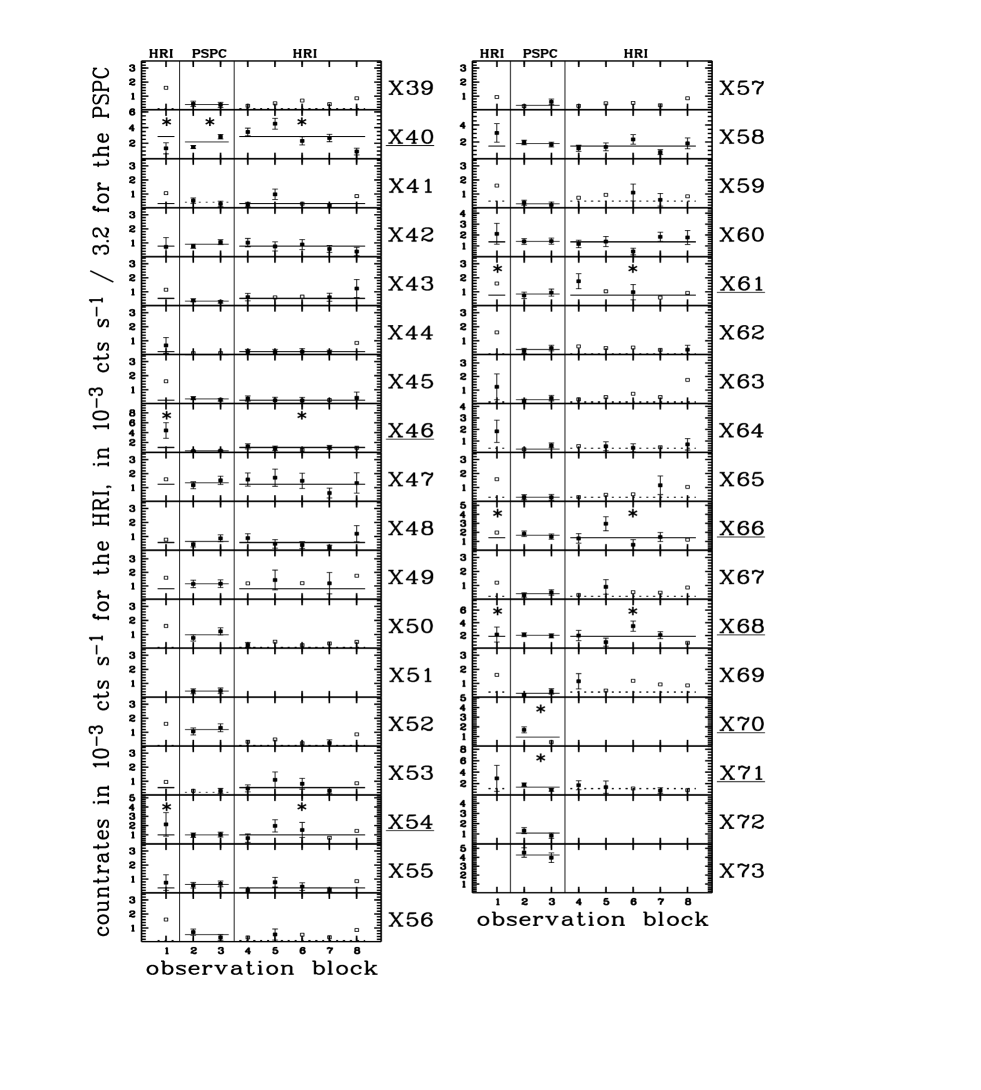
The light curves of all sources of the catalog (excluding X3 and X37 which are located at the edge of the calculated PSPC images) are presented in Fig. 5. If the source was detected during an observation block with a count rate exceeding its error, filled squares are plotted. Vertical bars represent statistical errors. Upper limits () are indicated with open squares in the case of non-detections. Horizontal lines give the mean count rates during the whole HRI (blocks 1, 4-8) or PSPC (blocks 2, 3) observations. Solid lines represent sources that were detected, dashed lines represent sources for which only upper limits could be calculated. In general, the mean count rates are in good agreement with the results presented in Table 3. The PSPC mean count rates are slightly different from Table 3 for some sources located in diffuse emission regions (e.g. X24 or X27).
| No. | H⋆ | P⋆ | Rate | Rate | Flux | Flux |
|---|---|---|---|---|---|---|
| cts s-1 | cts s-1 | erg s-1 cm-2 | erg s-1 cm-2 | |||
| X2 | ||||||
| X5 | ||||||
| X7 | ||||||
| X11 | ||||||
| X12 | ||||||
| X13 | ||||||
| X14 | ||||||
| X15 | ||||||
| X17 | ||||||
| X20 | ||||||
| X22 | ||||||
| X28 | ||||||
| X30 | ||||||
| X33 | ||||||
| X35 | ||||||
| X40 | † | † | ||||
| X46 | ||||||
| X54 | ||||||
| X61 | ||||||
| X64 | ||||||
| X66 | ||||||
| X68 | ||||||
| X70 | ||||||
| X71 |
To further characterize the point sources of the catalog, they were checked for time variability using the likelihood ratio test. The likelihood ratios of the time variability test performed for the HRI and PSPC observations (Sect. 2.4) can be transformed into a probability that the source is time-variable (cf., e.g. Bronstein 1985). In Table 5 we summarize the information on those 24 sources of the total of 73, for which a Gaussian significance for time variability with was found within the HRI or PSPC observation blocks. Besides the significances, maximum count rates and fluxes (cf. Table 4 for the conversion factor and assumed model) are given.
Time variability for a source might also be established via a comparison of the HRI and PSPC derived fluxes. This method, however, might feign time variability if the wrong spectral model is used for count rate to flux conversion. We calculated the ratio of the energy conversion factors for our assumed model (5 keV thermal Bremsstrahlung), a 0.5 keV thermal Bremsstrahlung spectrum and a thin thermal plasma of 0.3 keV (cf. Table 4). The examples indicate that a wrong spectral model might fake time variability to the order of up to 30 or even more for extreme examples, e.g. a plasma with a temperature below 0.2 keV. Keeping this reservation in mind, time variability is suggested with for four additional sources which were not already picked up by investigating HRI or PSPC blocks, individually: X10, X21, X24, X34. In the case of X10 and X24, the HRI did not pick up a point-like source. The sources X21 and X34 are located within the diffuse emission of the NGC 253 bulge and disk and it can not be excluded that the PSPC determined counts are affected by subtracting a wrong background.
3.2 Resolving the complex nuclear emission area
Two bright sources, X33 and X34, are detected in the central region of NGC 253, both embedded in a complicated diffuse X-ray emission structure visible in the PSPC and HRI images (Figs. 1 to 4). We tried to disentangle the emission components with the help of the spatial resolution of the HRI and the spectral resolution of the PSPC.
The luminosities as suggested by the HRI count rates are erg s-1 and erg s-1 for X33 and X34, respectively. The position of the source X34 coincides with the optical center of NGC 253, X33 being located to the south. Together with the sources X33 and X34, the counts within the central emission region encircled by the lowest contour in Fig. 3 amount to HRI counts. We focus in this paper on the point sources and will discuss the diffuse emission components in PEA.
3.2.1 Spatial analysis of the HRI data
The HRI detection algorithm flagged X33 and X34 as extended (FWHM of extent and , respectively). X33 and X34 are, however, embedded in a region of diffuse emission and the detection algorithm may be fooled if this background is not modeled correctly by the background map. To investigate if these sources really are point sources inside diffuse emission, radial surface brightness profiles from 0 to 15′′ radius were calculated. To visualize the investigated region, circles with radii of 15′′ around the sources are sketched in Fig. 3. The surface brightness profile of X34 is centered on the intensity maximum correlated with X34. Due to the extent of the source and the slower decay of the intensity towards the east than to the west (cf. Fig. 3), the source position determined by the maximum likelihood algorithm and given in Table 3 is located southeast from this maximum. The width of the individual rings of the profiles is 3′′. In principal, one could compare the profiles of X33 and X34 to analytical models of the PSF. However, as there was no point source in the HRI field of view, bright enough to allow the correction of the pointing positions on time intervals shorter than the wobble period (400 s), the SASS attitude solution could only be improved on longer time scales (see Sect. 2.1), and one has to expect that the PSF is slightly broadened due to residual artifacts of the satellite wobble movement. We therefore choose to compare the surface brightness profiles of X33 and X34 to the profiles of the bright unconfused point-like sources X21 and X36, which were collected with the same attitude solution as X33 and X34 (Fig. 6). Within the off-axis angles of X21 and X36 (46 and 22, respectively), the HRI PSF is not expected to deteriorate compared to the central sources.
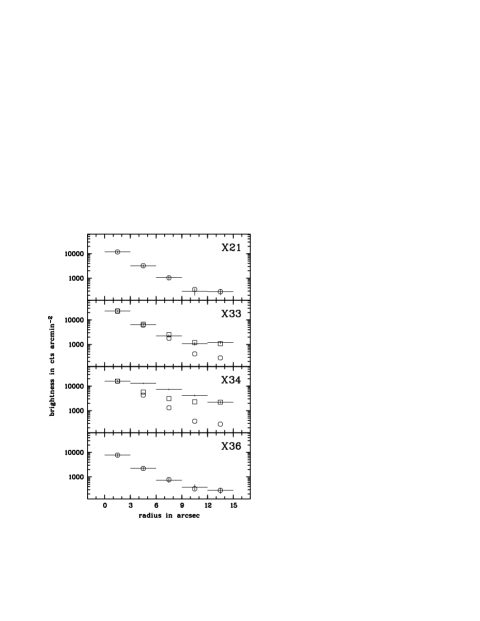
The ‘experimental’ PSF is calculated by averaging the surface brightness profiles of X21 and X36. The maximum of the PSF is normalized to the inner radial bin (). As can be seen in Fig. 6 (circles plotted over the profiles), this PSF model represents a good description of the brightness profiles of X21 and X36. To adapt the model for X33 and X34, the maximum was again normalized to the inner radial bin. The fact that X33 and X34 are sources embedded in a diffuse emission region was taken into account by normalizing the background in the outermost radial bin (). As can be seen in Fig. 6 (squares plotted over the profiles), this model is a good approximation to the profile of X33, though it cannot describe the slow decay of the surface brightness of X34. X33 therefore is likely to be a point source. Integrating the PSF model, 35921 counts ( erg s-1 cm-2, erg s-1) are deduced for X33, a number significantly lower than the number of counts determined by the detection algorithm (52024 counts). That number has been overestimated as X33 was fitted as an extended source and not the whole diffuse background was taken into account in the background map. On the contrary, the X-ray emission of X34 cannot be due to a single point-like source. Within a circle of 9′′ around X34, 70326 counts were measured after subtraction of the background, whereas the PSF model predicts less than 300 counts for a point source.
3.2.2 Spectral analysis of the PSPC data
To further investigate the structure of the point-like source X33, we made use of the spectral capabilities of the PSPC. A source spectrum was extracted with a cut diameter of . The very small extraction diameter and the varying PSF of the individual channels were corrected for using standard EXSAS procedures. Background was subtracted from a source-free region outside the disk and halo of the galaxy, leading to a raw spectrum of X33 containing 35223 counts. This raw spectrum was binned into energy bands to give a signal to noise ratio . Simple spectral models, a power law (POWL), thermal Bremsstrahlung (THBR) and a thin thermal plasma (THPL) model were fitted. With free absorption, free normalization and free index/temperature, our fits had seven degrees of freedom. Formally, all models achieved values between 0.9 and 1.0. However, as can be seen from the suggested temperatures of the thermal models (THBR: keV; THPL: keV), they fall in a range that cannot be properly constrained by ROSAT. The POWL fit (Fig. 7) resulted in an intrinsic absorption (after subtracting the Galactic foreground) of cm-2, a photon index of and flux of erg s-1 cm-2 (0.1–2.4 keV). The errors (1) for the fit parameters were calculated with the help of the error ellipses. The residuals of the fit are very small with the exception of the bin around 0.95 keV. Spectra of X34 (cf. PEA) indicate the presence of a thermal emission component with a temperature around 1 keV. Assuming that this diffuse emission is also contributing at the position of X33, the high residual of the bin around 0.95 keV could be explained. The photon index of X33 suggests a very hard intrinsic spectrum. In comparison, the index of a POWL fit for X34 (same extraction radius chosen as for X33) is and suggests a much softer spectrum. The absorption of X33 ( cm-2) is clearly less than the absorption of X34 ( cm-2). The spectrum of X34 together with the spectrum of the underlying diffuse emission is discussed in detail in PEA.
Combining the PSPC spectrum with the results of the surface brightness profiles obtained from the HRI observations, one derives an improved luminosity for X33 of erg s-1, corrected for the Galactic foreground and absorption within NGC 253. This luminosity is significantly lower than the one deduced from our detection catalog and time variability investigations.
3.3 Point sources within the NGC 253 disk
Of the 73 field sources, 32 are located within the ellipse of NGC 253 and attributed to the NGC 253 disk. Some of these sources may be spurious detections caused by diffuse filamentary X-ray emission features which are most clearly seen in the ROSAT PSPC image (Fig. 4), covering the disk and halo of NGC 253. For the HRI, similar problems exist in the central emission region shown in Fig. 3 and in the inner spiral arms of NGC 253 (indeed, one source has already been removed when creating the HRI source catalog). For the PSPC, we exclude from the further discussion those sources in the NGC 253 disk, which are located in regions of diffuse X-ray emission and which have only been detected with the PSPC, namely X50, X51, X52, X57 and X62. A visual check and a comparison with our list of transients verifies that no PSPC bright sources are rejected by this procedure.
All 27 remaining sources have been detected with the HRI, the count rates lying between cts s-1 (X26) and cts s-1 (X34). At the distance of NGC 253, this converts to luminosities between erg s-1 and erg s-1. 23 of these sources have been also detected with the PSPC, with count rates from cts s-1 (X9) to cts s-1 (X34), converting to luminosities between erg s-1 and erg s-1.
| No. | ||||
|---|---|---|---|---|
| X9 | ||||
| X12 | ||||
| X14 | ||||
| X15 | ||||
| X16 | ||||
| X17 | ||||
| X18 | ||||
| X19 | ||||
| X21 | ||||
| X23 | ||||
| X25 | ||||
| X26 | ||||
| X28 | ||||
| X29 | ||||
| X32 | ||||
| X33 | ||||
| X34 | ||||
| X35 | ||||
| X36 | ||||
| X38 | ||||
| X40 | † | |||
| X41 | ||||
| X42 | ||||
| X44 | ||||
| X48 | ||||
| ♣X50 | ||||
| ♣X51 | ||||
| ♣X52 | ||||
| X55 | ||||
| ♣X57 | ||||
| ♡X58 | (5.1) | (5.9) | ||
| ♣X62 |
The individual source luminosities are listed in Table 6. For 8 of the 27 NGC 253 sources, either the ROSAT HRI or PSPC data alone proof variability. For the brightest source (X33) statistics were sufficient to search for time variability on shorter time scales. Single observation blocks were analyzed, but no short term time variability could be established. Two further time-variable sources (X21 and X34) are suggested by comparing the HRI and PSPC fluxes. The apparent time variability of X34, however, can be explained as a side effect of the limited resolution of the PSPC hampering the flux determination for this extended source. Therefore, excluding X34, the ROSAT results indicate time variability for 9 of the 27 sources in the disk of NGC 253.
Transients form a special subclass of the time variable sources. For the purpose of this paper a source will be called transient if it remains undetected during at least one observation interval (2 detection limits of the individual intervals erg s-1) and shows a monotonic increase/decrease of the peak luminosity, the simplest case being a source only detected during one observation block. This definition of a transient may actually be fulfilled if a source shows an outburst by a factor of a few because of the limited sensitivity of the NGC 253 observations, and in this case the definition is less stringent than for transients in the Galaxy or the Magellanic clouds. From their ROSAT light curves X12, X14 are transients in this restricted sence.
Our investigations establish time variability for all NGC 253 disk sources with luminosity maxima above erg s-1, with the only exception of X36, for which no time variability could be found. For fainter sources with no established variability, it remains unclear whether these sources are time-constant or whether the statistics are too low to establish variability.
| No | Counts in | DOF | ||||
|---|---|---|---|---|---|---|
| raw spectrum | ||||||
| cts | cm-2 | keV | erg s-1 | erg s-1 | ||
| X12 | 8.8 / 10 | 1.2 | 34.5 | |||
| X17 (+ nearby source X18) | 11.0 / 11 | 1.6 | 27.8 | |||
| X21 | 23.5 / 21 | 1.1 | 2.4 | |||
| X36 | 11.0 / 21 | 0.9 | 37.6 | |||
| X40 (+ nearby source X42) | 9.1 / 16 | 1.7 | 27.9 |
To further classify the brighter point sources, we have made use of the spectral capabilities of the PSPC. For seven sources (X12, X17, X21, X33, X34, X36 and X40) PSPC counts are detected. X33 and X34, embedded in the extended nuclear X-ray emission, have already been discussed in Sect. 3.2. Photons for the other sources were extracted with extraction radii of 25′′, and a local background, determined in a concentric ring from to , is subtracted to reduce contributions from surrounding diffuse emission features. Contributions from other point sources in our catalog to this background are avoided as they are screened out with a cut radius of 25′′. The very small extraction diameters and the varying PSF of the individual channels were corrected for using standard EXSAS procedures. The counts contained in the raw spectra are listed in Table 7. Due to the PSPC PSF of , we are not able to separate X17 from X18 and X40 from X42. Simple spectral models, a power law (POWL), a thermal Bremsstrahlung (THBR) and a thin thermal plasma (THPL) model were fitted, and for all sources, the formal value of the THBR, THPL and POWL fits were of the same order of magnitude. In Table 7 the results of the THBR fits are listed. All sources are intrinsically absorbed, and the lowest absorption ( cm-2) is measured for X21, while the fits of all other sources indicate cm-2. While the THBR fit predicts a temperature around keV for X21 the temperatures of the other sources ( keV) seem to be lower. However, the errors of the fits (1 errors given in Table 7, calculated from error ellipses) are high. With the help of the more precise HRI count rates and using the conversion factors relevant to the PSPC suggested models, we derived two types of source luminosities that are given in Table 7: an ”absorbed luminosity” (i.e. calculating the flux for temperature and normalisation as suggested by the fit and using an value that is the fit value minus the Galactic foreground value), is erg s-1 for all the sources; an ”intrinsic luminosity” (i.e. calculating the flux for temperature and normalisation as suggested by the fit and using an value of zero). Technically, these intrinsic luminosities are higher than the absorbed ones by a factor of 2 for X21 and for all other sources. However, especially the big corrections have to be taken with care as they contain big errors introduced by the relatively low temperatures and high absorption values and the associated uncertainties.
3.4 Emission components of the NGC 253 disk
In this section the contribution of the NGC 253 point sources are compared to the total X-ray emission of the NGC 253 disk. One has to be aware that, due to the not completely edge-on orientation of the NGC 253 disk, contributions from hot gas in the lower halo of the galaxy (cf. PEA) will be contained in the integral disk count rate. The measured count rates have been corrected for exposure, deadtime, and vignetting. The background was taken from two source free regions outside the disk and halo of the galaxy, namely a region east of the galaxy encircled by the sources X68, X69 and X72, and a region west of the galaxy encircled by X2, X8 and X20. The PSPC has a very low detector internal background and enables a sensitive calculation of count rates over large areas. The results for the HRI, which has a higher detector internal background, give a higher error and depend more critically on the background regions chosen.
| Region | Detector | Count rate | ⋆ | HR1 | HR2 |
|---|---|---|---|---|---|
| cts s-1 | erg s-1 | ||||
| disk of NGC 253 | PSPC | []† | |||
| integral emission | HRI | []† | |||
| point sources in the disk | PSPC (28 sources detected) | ‡ | ‡ | ||
| excluding the extended | PSPC (excluding X50,51,52,57,62) | ||||
| central source X34 | HRI (25 sources detected) |
The total count rates within the ellipse of NGC 253, together with the integral point source content for the PSPC and HRI observations are given in Table 8. The PSPC and HRI count rates for the disk are in good agreement (i.e. the PSPC count rate is higher by a factor of , as expected from the energy conversion factors for the different spectral models (cf. Table 4). Excluding the central source X34, which is an extended source (cf. Sect 3.2), the integrated emission of the point sources makes up roughly one quarter of the total emission. With both detectors, an integrated point source luminosity of erg s-1 is measured. The PSPC sources X50, X51, X52, X57 and X62, which are probably due to local enhancements of the diffuse emission covering the disk of NGC 253, contribute erg s-1.
The central source X34 and the surrounding diffuse emission (cf. the lowest contour level of Fig. 4) contribute (after subtraction of X33 according to Sect. 3.2) HRI cts s-1, slightly more than the integral point source contribution ( HRI cts s-1).
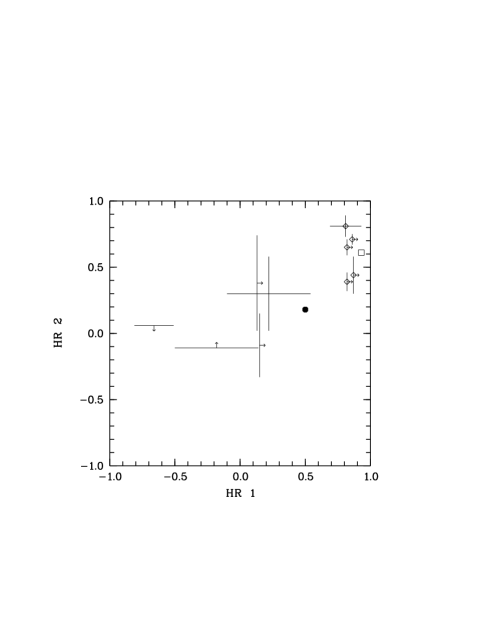
To visualize the spectral behavior of the different NGC 253 emission components, Fig. 8 shows a hardness ratio plot of the total NGC 253 emission (filled hexagon) and the bright point source X33 (square). Five further bright PSPC sources (X12, X17, X21, X36, and X40, all with PSPC counts), that were also detected with the HRI, have been added to the diagram (marked with diamonds). Sect. 2.3.3 described, how HR2 for the sources (all sources were confused) have been derived. Due to the high FWHM of the soft band PSF, the HR1 values are not given in Table 3. To estimate the HR1 for the purpose of this section, the soft and hard band counts were calculated within an extraction diameter of 1.5 times the PSF of the energy bands, and a local background from 1.5 to FWHM diameter was subtracted. Similar to X33, the sources X12, X17, X21, X36 and X40, are located in the upper right corner of the diagram, and their high HR1 and HR2 values suggest harder spectra and higher absorption than for the total NGC 253 disk emission. The positions of the spurious PSPC sources (X50, X51, X52, X57, and X62) in the hardness ratio digram (left of the hexagon representing the entire NGC 253 disk emission) would indicate lower absorption and softer spectral behavior, giving further support to their identification as spurious detections of diffuse emission from the (outer) disk of NGC 253.
Diffuse emission in the disk is investigated further in PEA.
4 Discussion
Extrapolating from our knowledge of X-ray point-like sources in the Galaxy, its neighboring galaxies in the Local Group and further nearby galaxies, the sources detected in NGC 253 should be from the following classes: (1) X-ray binaries. Here, a compact object (a white dwarf (WD), a neutron star (NS), or a black hole (BH)) accretes material from an accompanying object. Depending on the nature of the donor star, X-ray binaries are classified as high mass X-ray binaries (massive O or B stars as companions) or low mass X-ray binaries (late type stars as companions). The maximum X-ray luminosity that can be achieved in such a system, assuming steady spherical accretion, was calculated by Eddington (1928) as erg s, where is the mass of the compact object. Only when the compact object is a NS or BH is most of this luminosity emitted in X-rays. As NSs have typical masses of 1 M⊙, the commonly assumed maximum luminosity for a NS system is erg s-1 . If the luminosity of an X-ray source via the Eddington formula indicates a mass – and the source has to be explained as an X-ray binary – only black holes can act as the accreting objects, as theory does not allow such masses for WDs and NSs. (2) Supernovae. In the ROSAT band, X-ray emission from supernovae (SNe) is expected from the interaction between the SN ejecta and the circumstellar matter, heated by the outgoing wave. To date, eight detections of X-ray emitting SNe are reported, with peak X-ray luminosities in the range – erg s-1, followed by an exponential rate of decline (cf. Schlegel 1995 for a review of X-ray observations of SNe to the year 1995 and Fabian & Terlevich 1996; Lewin et al. 1996; Immler et al. 1998a and Immler et al. 1998b for detections thereafter). Based on the estimated SN rate of per century per () for galaxies of type Sc (van den Bergh 1993) and a total blue luminosity of NGC 253 of (Tully 1988), a SN rate of 1–2 per century is expected within NGC 253, these sources, by now, possibly having evolved into X-ray point sources. It is clear that this simple estimate will only roughly describe the SN rate in the disk of the galaxy and not the one connected to the nuclear starburst activity. Sources close to the nucleus will however be too highly absorbed in any event and – if ever visible at all – unresolvable with the HRI. (3) Supernova remnants. SN remnants in the Milky-Way and our neighboring galaxies attain X-ray luminosities of up to several 1036 erg s-1. A very X-ray bright remnant ( erg s-1) is reported for NGC 4449 (e.g. Blair et al. 1983, Vogler & Pietsch 1997). (4) Super-bubbles. In regions of enhanced star formation, correlated winds of massive stars ( yr) and SN explosions ( yr) can heat a part of the interstellar medium to K. Super-shells surrounding these bubbles might complicate the detection of the hot interior. Additional X-ray emission connected to super-bubbles is expected from X-ray binaries, SNe or SN remnants contained in the star forming regions. The brightest known super-bubbles in the LMC (the NGC 44 super-bubble and shell 5 in 30 Dor) have luminosities of erg s-1, and in M 101, five bright H ii regions have luminosities from erg s-1 to erg s-1 (Chu & Kennicutt 1994, Williams & Chu 1995), while most of the known super-bubbles have lower luminosities.
In the Milky-Way, SN remnants and super-bubbles can be spatially resolved with the ROSAT instruments. At the distance of NGC 253, one expects these source classes to be point-like at the resolution of ROSAT, as long as the spatial extent is pc. This extent can only be exceeded in the case of giant super-bubbles (cf., e.g. the HRI detection of a super-bubble in NGC 3079, Pietsch et al. 1998b).
4.1 Comparison of the ROSAT point source catalog with Einstein
| ROSAT | Einst. | |||
|---|---|---|---|---|
| X9 | — | |||
| X12 | — | |||
| X14 | — | |||
| X15 | — | |||
| X16 | — | |||
| X17 | E2 | |||
| X18 | — | |||
| X19 | — | |||
| X21 | E5 | |||
| X23 | — | |||
| X25 | — | |||
| X26 | — | |||
| X28 | — | |||
| X29 | — | |||
| X32 | — | |||
| X33 | E8 | |||
| X35 | — | |||
| X36 | E1 | |||
| X40 | — | |||
| X41 | — | |||
| X42 | — | |||
| X44 | — | |||
| X48 | — | |||
| X50 | — | |||
| X51 | — | |||
| X52 | — | |||
| X55 | — | |||
| X57 | — | |||
| X62 | — | |||
| — | E3 | |||
| — | E4 | |||
| — | E6 | |||
| — | E7 |
To investigate the long term time variability of the ROSAT detected NGC 253 point sources, the ROSAT results were compared with the Einstein HRI data, collected in July 1979. The Einstein source list contains eight point-like sources (sources E1 – E8, Fabbiano & Trinchieri 1984, cf. our Fig. 2 and the figure caption for the position of the sources). To calculate upper limits (2) to the Einstein luminosity at the positions of (Einstein-undetected) ROSAT sources, Einstein data have been retrieved from the High Energy Astrophysics Science Archive Research Center (HEASARC), operated by the Goddard Space Flight Center (GSFC). Table 9 compares luminosities and upper limits for the Einstein and ROSAT PSPC and HRI detected sources.
27 sources are detected within the ellipse NGC 253 by ROSAT, 9 of which show time variability within the ROSAT observations (cf. the results in Sect. 3.3). For four of the time variable sources (X12, X14, X28 and X40) the Einstein upper limits lie below the ROSAT measurements, and this further strengthens the idea that these sources are time variable. Two additional time-variable ROSAT sources (X17, X21) were also detected with Einstein, and for these sources, the different Einstein and ROSAT luminosities support the picture of time variability. Two ROSAT sources with no known time variability were detected with Einstein, namely the bright point source close to the nucleus (X33) and X36. ROSAT and Einstein luminosities for these sources agree within the errors, and no time variability can be inferred. Due to the reduced sensitivity of the Einstein observation however (detection limit erg s-1, compared to erg s-1 for ROSAT), we cannot make any long term time variability arguments for the remaining fainter ROSAT sources. Conversely, four sources within or close to the ellipse of NGC 253 were seen with Einstein, but not with ROSAT: E3, E4, E6 and E7. These non-detections with ROSAT (the ROSAT upper limits being significantly below the Einstein luminosities) argue for the detection of transients in the case of these sources.
4.2 The nature of the NGC 253 point sources
The nature of the sources associated with the NGC 253 disk is discussed in this section. As will be shown in Sect. 4.4, only a negligible number (of order 1) of foreground or background X-ray sources is expected within the ellipse of NGC 253.
Combining the ROSAT and Einstein observations, a total of 31 point sources in NGC 253 are seen. Two Einstein sources, E3 and E4, located close to the D25 ellipse of NGC 253, are included in this number. This seems justified though, as Hi observations of NGC 253 (Puche et al. 1991) and deep optical observations (Beck et al. 1982) indicate an extent of NGC 253 far beyond the D25 ellipse. Also, their transient nature (see Sect. 4.1) strengthens the idea that E3 and E4 are members of NGC 253, as had already been proposed by Fabbiano & Trinchieri (1984).
Time variability is detected in 13 of the 31 NGC 253 sources, and nearly one half of these (X12, X14, E3, E4, E6 and E7) show transient behavior. X12 and X14 reach their highest luminosities during the ROSAT observation blocks 4 and 6, respectively. Compared to the lowest upper limits in the case of non-detections (block 7 for X12 and block 4 for X14), the peak luminosity is higher by 4.0 and 5.6 ( represents the measurement error of the peak luminosity) for X12 and X14, respectively. While X14 is not detected with the PSPC, X12 is detected during block 3. The luminosity is smaller than the one measured with the HRI however, due to the smaller error of the PSPC measurement, the PSPC peak luminosity is 19.8 above the upper limit for block 7. In the case of the Einstein detected transients E3, E4, E6, and E7, the significances of the luminosity above the ROSAT upper limit are 4.4, 4.3, 3.4, and 3.2, respectively.
The interpretation of the bright time-variable sources is relatively straightforward. Taking into account the fact that – with the exception of SN 1940E – no SNe have been reported in NGC 253, the time-variable sources have to be classified as X-ray binaries. With the exception of X33, the derived maximum luminosity of the variable sources ( erg s-1) and the variability could be well explained if one assumes X-ray binary systems containing accreting objects of mass ( neutron stars) radiating close to the Eddington limit. However, if additional absorption, intrinsic to the sources or from the H i disk of NGC 253 is included, higher intrinsic luminosities of the sources are implied. An additional of cm-2 or cm-2 (cf. the H i map presented in Puche et al. 1991), for example, would imply source luminosities higher by factors of 1.6 and 4, respectively. Under these assumptions, the maximum X-ray luminosities of all the mentioned binary candidates would be close to, or even exceed the Eddington limit for a neutron star binary. If one assumes that X33 is an X-ray binary radiating at the Eddington limit, a mass for the compact object of can be calculated, that clearly puts the object in the mass range expected for a black hole.
It is more difficult to determine the nature of the remaining, less bright X-ray sources in NGC 253. Firstly, the non-detection of time variability with ROSAT might be due to the low photon statistics or the time windows of the observation blocks, and, in general, one cannot rule out the idea that the luminosity of these sources is variable. Secondly, none of the X-ray positions coincide with point sources visible in radio maps that could be due to SNe, SNRs or H ii regions. This may not be too astonishing, bearing in mind that the brightest supernova remnant in the LMC (N158A) has erg s-1 (Chu & Kennicutt 1994), well below the detection limit of the ROSAT observations for NGC 253. Therefore, one might again argue in favor of an X-ray binary identification. Another explanation one could put forward is that unresolved emission from SNe and SN remnant and X-ray binaries, embedded in the hot interstellar medium of star forming regions, would suppress time variability. Such a scenario might also explain the bright source X36 (no time variability established) with a luminosity ( erg s-1) comparable to that of X-ray bright super-bubbles reported in M 101 (Williams & Chu 1995).
In contrast to face-on galaxies like M 101, the edge-on orientation of NGC 253 complicates the detection of H ii regions in H observations, and only for X42 ( erg s-1) could a positional coincidence be established (reported by Waller et al. 1988).
4.3 Non-detection of SN 1940E?
The type I supernova SN 1940E (cf., e.g. Barbon et al. 1989) is the only historical SN reported in NGC 253. The SN is located 71′′ west and 17′′ south of the nucleus, and its position is marked with a cross () in Fig. 2. Our X-ray catalog contains no source close to the position of the SN. We searched for faint emission at the position of SN 1940E, by extracting HRI counts from a ring of radius 10′′. The background was taken from an annulus of 10′′ to 15′′ radius. This procedure resulted in a residual count rate of (2.31.3)10-4 cts s-1 (converting to erg s-1). It is not clear, however, whether this 1.8 excess is really emission from the SN or is just produced by the patchiness of the diffuse X-ray emission in the inner spiral arms of NGC 253.
To date, only one possible X-ray detection of a SN of type I soon after the outburst has been reported (SN 1994I in M 51, erg s-1, Immler et al. 1998b). Comparing with this paper, and taking the luminosity upper limit above and with a cooling function of erg cm3 s-1 (Raymond et al. 1976), one can estimate a mean density of (for a shell expansion velocity in units of 10 000 km s-1) and a total mass of X-ray luminous gas of inside a sphere of radius cm. While this density limit is typical for the interstellar medium in the disk of galaxies, it is four orders of magnitude lower than that expected for the gas deposited by type I SNe due to non-conservative mass transfer to a companion or due to stellar wind prior to the outburst (cf. Immler et al. 1998b). There are several ways to explain this discrepancy: SN 1940E may be embedded deep in the NGC 253 disk, and the count to luminosity conversion may underestimate this effect, the assumptions for the cooling may be wrong, leading to a too high luminosity after 55 years, or the emission from SN 1994I may not be typical for type I SN.
4.4 Possible contributions from foreground or background sources
We have attributed all X-ray sources found within the optical extent of NGC 253 to the disk of NGC 253 (with the exception of X58, a background object, cf. appendix A). We demonstrate that this assumption is justified, in the following, by proving that only a negligible number of foreground and background sources is expected in this area.
Firstly, one can estimate the number of X-ray sources due to foreground objects by extrapolating the local density of X-ray detected stars in the field. To do so, only HRI sources were taken into account. In this way we avoided PSPC sources that might partly represent diffuse emission in the halo of NGC 253. From the 34 HRI sources outside the ellipse of NGC 253, only the sources X31 and X61 are identified with foreground objects (stars, see appendix A). Keeping this in mind and comparing the area covered by the disk of NGC 253 ( arcmin2) to that of the remaining HRI field of view ( arcmin2), one expects 0.25 foreground source within the disk of NGC 253, making the detection of such a source rather unlikely.
Secondly, one can estimate the number of background sources shining through the disk of NGC 253 in a similar way. We can assume conservatively that all objects outside the NGC 253 disk with the exception of X31 and X61 are background objects. In addition, we have to keep in mind that the source flux for objects behind the NGC 253 disk will be reduced due to the additional absorption of X-rays that these objects will suffer from the interstellar medium within the disk of NGC 253. While the detection limit for field sources in the HRI field was erg s-1 cm-2, we only expect to detect sources from behind the NGC 253 disk if they have intrinsic fluxes of at least erg s-1 cm-2 (correcting for a typical column density cm-2 (Puche et al. 1991)). Only 18 background sources were detected above this limit outside the NGC 253 disk. From this and the ratio of the NGC 253 disk/outside areas, one can predict 2.3 background sources within an area covered by the NGC 253 disk. With the help of optical spectroscopy (see appendix), we have already identified one background QSO, X58, on the border of the ellipse of NGC 253.
Another approach to determine the contamination of NGC 253 disk sources with background objects uses the deep field luminosity functions derived in the Lockman hole (Hasinger et al. 1991, Hasinger et al. 1993). If we again correct for an average of cm-2 within the the disk of NGC 253, 1.6 background sources are predicted that should be detectable shining through the NGC 253 disk. This number is – within the statistics – consistent with the one derived from the field objects.
4.5 Comparison to results previously published on ROSAT and ASCA observations
A sample of ROSAT PSPC observed spiral galaxies – including the 22.9 ks PSPC observation of NGC 253 – has been homogeneously analyzed by Read et al. (1997) to search for point source and diffuse emission components. In the NGC 253 field, they detect 15 point sources (R1 – R15), seven of which are located within the disk of NGC 253 (i.e. R4 corresponding to the source cataloged above as X12, R6/X15, R7/X17+nearby source X18, R8/X21, R11/X34+nearby source X33, R12/X36 and R13/X40+nearby source X41). Due to their small separations, the sources X17/18, X33/34 and X40/42 are not resolved as individual sources within the PSPC data. The count rates given by Read et al. (1997) for the sources R4 – R13 are slightly higher () than our rates. This can be understood if one keeps in mind that we used a multi source fit technique to calculate the count rates, and excluded contributions from nearby sources, which otherwise might increase the count rates. In addition, due to a more sensitive source search, our catalog contains more sources.
Ptak et al. (1997) report on ASCA observations of NGC 253. Because of the large PSF of ASCA (FWHM ), point sources can not be spatially separated from diffuse emission components. However, because of the good spectral resolution of the detectors, they were able to fit multi component spectral models to the integral emission of NGC 253. When comparing with ASCA, one has to keep in mind that due to their geometry the ASCA detectors do not cover the entire NGC 253 disk, and therefore ASCA count rates have been only been extracted from a circle of 6′ radius around the center of NGC 253. Also, the ASCA energy coverage (0.5–10 keV) differs from that of ROSAT. In the overlapping 0.5–2.0 keV band, Ptak et al. report a flux of erg s-1 for NGC 253. Extracting from the same area one obtains a count rate of 0.33 cts s-1 in the corresponding ROSAT hard band. To be independent of errors introduced by different spectral models, the same spectral parameters as used for the ASCA data are used to convert the ROSAT count rate to a luminosity. Ptak et al. (1997) fit the entire emission of NGC 253 in the 0.5–10 keV ASCA band as a combination of a thin thermal plasma and a power law component. They obtain cm-2 and keV for the thin thermal plasma component, and cm-2 and a power law index of 2.0 for the higher absorbed power law component with unabsorbed luminosities (0.5–2.0 keV) of erg s-1 for the thin thermal plasma component and erg s-1 for the power law component. From this, the calculated luminosities corrected for Galactic absorption are erg s-1 and erg s-1 for the thermal plasma and power law component, respectively. For the same spectral model, the ROSAT H band count rate translates to erg s-1, a luminosity in very good agreement with the one measured by ASCA. If one still wants to explain the slightly higher ROSAT luminosity (by erg s-1), one can argue in terms of the existence of time-variable sources which might have been picked up with ROSAT during the six observation blocks distributed over several years but not with ASCA (only one observation block). In this way, the transient X12 contributes an average luminosity of to the luminosity determined in the ROSAT PSPC hard band.
4.6 Comparison to other wavelengths
We compared our ROSAT point source catalog to images taken at other wavelengths to identify possible supernova remnants, Hi holes and Hii regions within the NGC 253 disk.
Radio maps from 0.3 GHz – 4.7 GHz (Carilli et al. 1992, Beck et al. 1994) show a bright nuclear source surrounded by diffuse radio emission. The diffuse emission covers the entire NGC 253 disk and protrudes from the disk into the halo of the galaxy. On top of the diffuse radio emission covering the bulge, disk and halo of NGC 253, several enhancements in the radio emission are visible. Within the disk of NGC 253, no X-ray sources are found at the position of this enhanced radio emission, with the exception of the nuclear area. VLA observations of NGC 253 (e.g. Ulvestad & Antonucci 1997) resolve the central nuclear region of NGC 253 at a spatial scale of pc. These radio detected SN remnants and H ii regions can be attributed to the starburst nucleus of NGC 253. However, the resolution of the ROSAT data (pc) is insufficient to identify (a part) of the extended central X-ray emission with individual radio point sources. On the other hand, the enhanced radio emission coincides nicely with the bright near-infrared emission of the starburst nucleus (Sams et al. 1994); also the young, luminous, compact stellar clusters detected with the WFPC2 camera on the Hubble Space Telescope (Watson et al. 1996) are located in the same area. The maximum of the central extended X-ray source (X34, cf. Sect. 3.2.1) is found with an offset of ″ to the southeast from the cluster of these bright nuclear radio sources. The fact that this offset is slightly exceeding the systematic position errors, may indicate that the nuclear extended X-ray emission is caused by the hottest part of the gas outflowing from the nuclear region and not by a collection of individual point sources (see further discussions in PEA).
The X-ray point source catalog can be compared with fainter compact radio sources in the disk by making use of the reanalysed 6 and 20 cm VLA data (Ulvestad & Antonucci, in preparation). From a diameter of 12′ they report 27 compact sources in the NGC 253 disk (outside the nuclear starburst) and 5 sources close-by. While several sources within this new catalog coincide with source positions that we have already derived from the radio images of Carilli et al., no coincidences with the X-ray catalog are seen. This is slightly surprising as one might have expected that some of these SNRs or H ii regions detected in radio would also be bright enough to be detected in X-rays. An explanation for this behavior may be that, due to the edge on view on NGC 253, the X-ray emission of these radio sources (mostly soft for this class of emitters) is heavily absorbed and therefore not detected.
A comparison of the X-ray source catalog to H images (Waller et al. 1988) suggests a coincidence of X42 and a bright H ii region. Therefore X42 may represent emission of hot gas connected with the H ii region. This would be consistent with the non-detection of X-ray variability and also the X-ray luminosity of the source. The hardness ratio HR2 of 0.2, on the other hand, suggests a hard spectrum, that would not be expected for this class of source.
4.7 Comparison to X-ray point sources in other spiral galaxies
After discussing of the nature of the individual point sources in NGC 253, we may compare the point source population of NGC 253 with results from other spiral galaxies.
| Galaxy | Type⋆ | Incl.⋆ | † | Det. | Det. lim. | point sources | ♡ | Ref. | ||
|---|---|---|---|---|---|---|---|---|---|---|
| ∘ | Mpc | |||||||||
| cm-2 | erg s-1 | erg s-1 | ||||||||
| N 253 | Sc | 86 | 2.58 | 1.3 | H‡ | 7 | 25 + nucl. | 1.0 | 2.2 | this work |
| M 31 | Sb | 78 | 0.69 | 3.0 | P‡ | 0.4 | 340 + bulge | 1.8/3.2⋄ | 1.7/2.9⋄ | Supper et al. 1997 |
| M 33 | Scd | 56 | 0.80 | 6.0 | H‡ | 6 | 26 + nucl. | 0.8 | 4.8 | Schulman & |
| Bregman 1995 |
The local group spiral galaxies M 31 (Supper et al. 1997) and M 33 (Schulman & Bregman 1995) have been investigated to luminosities below that reached for NGC 253 (cf. Table 10). We compared the integrated point source content (cf. Table 10) as well as the luminosity distributions of the individual point sources of these galaxies (cf. Fig. 9) to NGC 253. The whole optical extent of M 31 has been observed with a ROSAT PSPC raster scan. In the central area of M 31 ( kpc corresponding to 5′) the PSPC source confusion is very high. While this central region was therefore excluded from the luminosity distribution, the integrated point source content of the region was estimated, assuming that 90 of the bulge luminosity is made up of point sources. This assumption seems to be justified by Einstein HRI and ROSAT HRI data (Trinchieri et al. 1988; Primini et al. 1993), which do not show diffuse or plume like emission as in the case of the NGC 253 nuclear region. The ROSAT HRI observation of M 33 was centered on the nucleus of the galaxy (Schulman & Bregman 1995). Due to the large optical extent of M 33 ( ellipse of , Tully 1988), the HRI observation (field of view ) did not cover the entire outer disk of the galaxy. At the center of M 33 is a bright X-ray source ( erg s-1), its true nature not yet being clear. The source might be, e.g, a mildly active nucleus. To reduce the contributions of active or starburst nuclei to our point source comparison the central sources of M 33 and NGC 253 (the extended source X34) were excluded from the total point source luminosity and the luminosity distribution diagram. However, we are aware that the nuclear area of M 33 could contain a sample of bright X-ray point sources instead of a mildly active nucleus, and that the total point source luminosity as well as the luminosity distribution of M 33 as assumed by us would have to be corrected.
In the case of NGC 253, M 31 and M 33 the ratio between X-ray and optical luminosity, which is independent of distance, has been compared (cf. Table 10), and it differs slightly, being lowest for the nearly edge-on galaxy NGC 253 () and highest for the galaxy with the lowest inclination, M33 (). One can to first order correct for the inclination effect by correcting for an average additional absorption of the NGC 253 sources of cm-2 (cf. the Hi map presented in Puche et al. (1991)), resulting in , lying between the values found for M 31 and M 33. The ratios only differ by a factor of less than 2 in spite of the differences in morphological type and star forming activity of the galaxies. These results fit nicely to the close correlations for X-ray and optical luminosities of spiral galaxies reported by Fabbiano et al. (1992) from an analysis of the Einstein sample of galaxies.
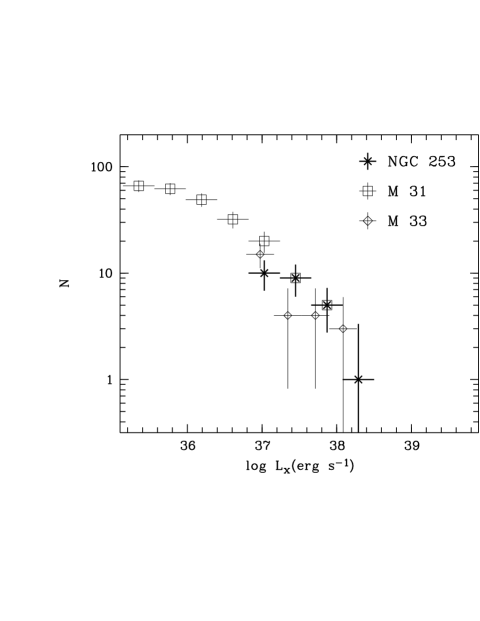
The number of point sources detected in different luminosity ranges for NGC 253, M 31 and M 33 are presented in Fig. 9. The nuclei of NGC 253 and M 31, as well as the inner bulge region of M 33 have been excluded for the reasons mentioned above. As the X-ray sources in M 31 are complete for erg s-1 (cf. Supper et al. 1997), the M 31 curve above this limit defines the luminosity function of point sources. Below this threshold it is unclear whether the slower increase in the number of sources per energy bin is due to a change in the point source population or due to incompleteness. Within the errors, the luminosity distributions of the NGC 253 and M 33 point sources match within the overlapping region, to that of M 31. This suggests that source populations for the disks of these galaxies (excluding the nuclear regions) are similar. This result is somewhat surprising, as one might have expected an enhanced number of point sources connected with the star forming activity of NGC 253 that has not only been reported from the nuclear starburst region but also from the boiling galactic disk (Sofue et al. 1994). The present measurements do however, not totally rule out this possibility, as there could be an additional contribution of lower luminosity point sources that are not detected due to the ROSAT sensitivity cut-off.
In a couple of more distant spiral galaxies very bright ( erg s-1), non-nuclear point-like sources were detected by ROSAT, namely in NGC 891 (Bregman & Pildis 1995), NGC 4559 (Vogler et al. 1997), NGC 4565 (Vogler et al. 1996), NGC 6946 (Schlegel et al. 1994) and M 100 (Immler et al. 1998a). In the case of NGC 891 and NGC 6946, the X-ray emission is due to SNe. In the case of the other galaxies, the nature of the bright sources is still unclear. The sources are point-like at the resolution of the ROSAT HRI (NGC 4559, M 100) and PSPC (NGC 4565, no HRI observation available). The non-detection of recent SN outbursts in these galaxies favors the explanation of X-ray binary systems or SN remnants expanding into high density ( cm-3) media. In the case of X-ray binaries, these objects would most likely have to be black hole binary candidates, the masses of the central objects exceeding . However, the sources could also be due to a superposition of X-ray binaries and SN remnants, as expected in super-bubbles. Assuming these bright sources are really point-like, one would expect, contrary to the observations, that such sources should also exist in NGC 253, M 31, and M 33. Their absence can either be explained in terms of time variability, where no such source was active during the ROSAT observations, or by a differing source population.
4.8 Point sources outside the disk of NGC 253 possibly correlated to the galaxy
While point sources located inside the ellipse of NGC 253 can fully be attributed to the galaxy (with the exception of one or two background sources, cf. Sect. 4.4), it is more difficult to decide whether point sources located (projected) in the halo of NGC 253 are associated with the galaxy. Such a correlation could be expected for globular clusters, which might contain low mass X-ray binaries, or for sources due to emission from hot gas in the halo.
The X-ray point source list is compared to globular cluster candidate lists based on optical observations (Liller & Alcaino 1983, 63 candidates; Blecha 1986, 32 candidates). No positional coincidence can be established, and this seems to contradict expectations deduced from ROSAT observations of M 31. Of the ROSAT sources in M 31, 43 have luminosities above the detection limit of NGC 253, and more than half (26) of these bright sources have been identified as globular clusters. Assuming a similar ratio for NGC 253, 16 sources would be expected to be globular cluster sources. However, a direct comparison between the two galaxies is rather difficult. of the globular clusters detected in X-rays in M 31 are located within an ‘inner disk’ described by an ellipse half the size of M 31. A list of optical candidates for M 31 globular clusters in this region could be obtained because of the lower inclination (78∘ versus 86∘ for NGC 253) and the smaller distance (0.69 Mpc versus 2.58 Mpc). Such a list is not available for the inner disk of NGC 253. In addition, X-rays from only one globular cluster candidate outside the area covered by the M 31 disk has been detected at a distance of kpc from the galactic plane. For NGC 253, however, most of the globular cluster candidates contained in the lists of Liller & Alcaino (1983) and Blecha (1986) are located at large distances from the plane of the galaxy ( kpc for nearly all candidates in the list of Liller & Alcaino 1983).
An example of a source in the NGC 253 halo, caused by diffuse emission, and having a point-like appearance at the resolution of the PSPC (and possibly also at the resolution of the HRI) could be, e.g., a region of (older) dense interstellar medium in the halo that is shock-heated by a superwind (cf. e.g. Suchkov et al. 1994). Seven sources in the halo of NGC 253 are surrounded by diffuse X-ray emission attributed to hot gas, namely the sources X10, X13, X22, X24, X27, X30 and X45. Faint optical objects close to the HRI and PSPC detected sources X13 and X22 (separation ) suggest background AGNs as sources of the X-rays. The faint object at the position of X22 could be spectroscopically identified as QSO (see appendix A). In the case of X27, only detected with the PSPC, a faint object is found at a distance 12′′ (less than the position error) on the ROE finding charts. This might suggest an identification with a background AGN. The non-detection of this source with the HRI might indicate time variability. The optical object, however, has not yet been spectroscopically identified. Taking into account the larger separation between the optical and X-ray position of X27, compared to X13 and X22, and that, in addition, only X27 was not detected with the HRI, one alternatively might argue that X27 is a diffuse emission feature.
No optical candidates were found in the cases of X10, X24 (both only detected with the PSPC), X30 (only detected with the HRI) and X45 (detected with the HRI and PSPC). In the case of X30, time variability was established with the help of the HRI observation blocks, indicating that X33 is not a diffuse X-ray emission feature. In the case of X10 and X24, time variability is only suggested via a comparison of the PSPC measured fluxes with the HRI upper limits. While a PSPC true color picture (calculated from the images in the soft, hard1 and hard2 band, Vogler 1997) indicates harder spectral behavior at the position of X10 than for the surrounding diffuse emission, such a signature is not visible for X24. This might suggest that the X-ray emission of X10 is due to a background object, whereas that of X24 might reflect structure in the diffuse halo emission. No time variability could be found for X45, and therefore this source is most likely of a similar origin to X24.
5 Summary
The properties of point-like X-ray sources, detected in deep ROSAT HRI and PSPC observations of the NGC 253 field, are presented and discussed. Long term time-variability is established within the ROSAT data and with the help of the Einstein HRI data. Optical follow-up observations of some of the X-ray sources located (projected) within the halo of NGC 253 have been carried out at the European Southern Observatory, La Silla, Chile.
The disk of NGC 253 is visible with a count rate of 0.15 cts s-1 in the ROSAT 0.1–2.4 keV HRI band. The X-ray emission is a superposition of (1) individual point sources with luminosities ranging from erg s-1 to erg s-1 (integral count rate of 0.03 HRI cts s-1 corresponding to erg s-1), (2) an extended source covering the bulge and connected to the nuclear star forming activity (0.04 HRI cts s-1), (3) patchy X-ray emission covering the inner spiral arms of NGC 253, (4) diffuse X-ray emission from the disk of NGC 253 and (5) contributions from the X-ray halo around NGC 253 projected into the ellipse of NGC 253. These results are in good agreement with the Einstein and ASCA data.
Time variability investigations of the ROSAT data suggest that 9 of the 27 NGC 253 disk sources are variable, 2 showing transient behavior. The Einstein data establish four additional time-variable sources, not seen with ROSAT. Excluding the bright point-like source X33, located south of the nucleus, the time-variable sources have maximum luminosities ranging from erg s-1 to erg s-1. We suggest that these sources are X-ray binaries radiating close to, or at, the Eddington limit of an accreting neutron star X-ray binary. If X33 were a binary, this source (intrinsic erg s-1) would be a good candidate for a black hole binary.
A slight X-ray excess ( erg s-1) at the position of the type I supernova SN 1940 E is detected. However, this X-ray emission might be caused by the patchiness of the diffuse X-ray emission covering the inner spiral arms of NGC 253.
The luminosity distribution of the NGC 253 point sources matches those of M 31 and M 33. The ratio between the integrated X-ray point-source luminosity and the optical luminosity () is of the order after correcting for the different viewing geometries. In contrast to some more distant spiral galaxies, no very bright ( erg s-1) point-like sources are detected in NGC 253.
None of the globular cluster candidates reported from optical observations of the outer disk and halo of NGC 253 are visible in our X-ray observations, though X-ray observations of M 31 suggest that one half of the NGC 253 sources should be due to globular cluster X-ray binaries. This non-detection might be a problem caused by the very small number of optical candidates located close ( kpc) to the plane of the galaxy.
The NGC 253 halo shows filamentary diffuse X-ray emission. 7 point like sources are detected in the region of diffuse X-ray emission. For 4 point sources time variability or proposed optical identifications rule out the idea that these sources are connected to the diffuse halo emission.
Acknowledgements.
We thank our colleagues from the MPE ROSAT group for their support. The ROSAT project is supported by the German Bundesministerium für Bildung, Wissenschaft, Forschung und Technologie (BMBF/ DLR) and by the Max-Planck-Gesellschaft. We thank Andrew Read and Stefan Immler for carefully reading and discussing the manuscript. To look for possible counterparts of our point source list we made use of the NASA/IPAC extragalactic database (NED). The usage of the likelihood ratio test for time variability studies of sources with low photon statistics (cf. Sect. 2.4) was proposed by M.G. Akritas on the WWW homepage of the Statistical Consulting Center for Astronomy (http://www.stat.psu.edu/scca/homepage.html).References
- (1) Barbon R., Capellaro E., Turatto M., 1989, A&AS 81, 421
- (2) Beck R., Hutschenreiter G., Wielebinski R., 1982, A&A 106, 112
- (3) Beck R., Carilli C.L., Holdaway M.A., et al., 1994, A&A 292, 409
- (4) Blair W.P., Kirshner R.P., Winkler P.F., 1983, ApJ 272, 84
- (5) Blecha A., 1986, A&A 154, 321
- (6) Bregman J.N., Pildis R.A., 1994, ApJ 420, 570
- (7) Cash W., 1979, ApJ 228, 939
- (8) Carilli C.L., Holdaway M.A., Ho P.T.P., et al., 1992, ApJ 399, L59
- (9) Carral P., Hollenbach D.J., Lord S.D., et al., 1994, ApJ 423, 223
- (10) Chu Y.H., Kennicutt R.C., 1994, ApJ 425, 720
- (11) Condon J.J., Cotton W.D., Greisen E.W., et al., 1998, AJ 115,1693
- (12) Crampton D., Gussie G., Cowley A.P., Schmidtke P.C., 1997, AJ 114, 2353
- (13) Eddington A.S., 1928, “The Internal Constitution of Stars” (1928), Dover (New York 1959)
- (14) ESO MIDAS 1997, http://www.eso.org/research/data-man/data-proc/systems/esomidas/
- (15) Gehrels N., 1986, ApJ 303, 336
- (16) Fabbiano G., 1988, ApJ 330, 672
- (17) Fabbiano G., Trinchieri G., 1984, ApJ 286, 491
- (18) Fabbiano G., Kim D.-W., Trinchieri G., 1992, ApJS 80, 531
- (19) Fabian A.C., Terlevich R., 1996, MNRAS 280, L5
- (20) Forbes D.A., Ward M.J., Depoy D. L., 1991, ApJ 380, 63
- (21) Hasinger G., Schmidt M., Trümper J., 1991, A&A 246, L2
- (22) Hasinger G., Burg R., Giacconi R., et al., 1993, A&A 275, 1
- (23) Hogg R.V., Tanis E.A., 1983, Probability and statistical inference, Macmillan
- (24) Hummel E., Smith P., van der Hulst J.M., 1984, A&A 137, 138
- (25) Immler S., Pietsch W., Aschenbach B., 1998a, A&A 331, 601
- (26) Immler S., Pietsch W., Aschenbach B., 1998b, A&A 336, L1
- (27) Irwin M., Maddox S., McMahon R., 1994, Spectrum 2, 14
- (28) Jacoby G.H., Hunter D.E., Christian C.A., 1984, ApJS 56, 257
- (29) Liller W., Alcaino G., 1983, ApJ 265, 166
- (30) Pfeffermann E., Briel U.G., Hippmann H., et al., 1987, presented at SPIE, Berlin, West Germany 1986, cf. Proc. SPIE 733, 519
- (31) Pietsch W., et al., 1998a, in prep.
- (32) Pietsch W., Trinchieri, G., Vogler, A., 1998b, A&A, submitted
- (33) Pietsch W., Bischoff, K., Boller Th., et al., 1998c, A&A 333, 48
- (34) Primini F.A., Forman W., Jones C., 1993, ApJ 410, 615
- (35) Ptak A., Serlemitsos P., Yaquoob T., Mushotzky R., Tsuru T., 1997, AJ 113, 1286
- (36) Puche D., Carignan C., van Gorkom J.H., 1991, AJ 101, 2
- (37) Raymond J.C., Cox D.P., Smith B.W., 1976, ApJ 204, 290
- (38) Read A.M., Ponman T.J., Strickland D.K., 1997, MNRAS 286, 626
- (39) Sams III B.J., Genzel R., Eckhart A., et al., Tacconi-Garman L., Hofmann R., 1994, ApJ 430, L33
- (40) Schlegel E.M., 1994, ApJ 434, 523
- (41) Schlegel E.M., 1995, Rep. Prog. Phys. 58, 1375
- (42) Schulman E., Bregman J.N., 1995, ApJ 441, 568
- (43) Snowden S., McCammon D., Burrows D., et al., 1994, ApJ 424, 714
- (44) Sofue Y., Wakamatsu K.-I., Malin D.F., 1994, AJ 108, 2102
- (45) Suchkov A.A., Dinshaw S.B., Heckman T.M., Leitherer C., 1994, ApJ 430, 511
- (46) Supper, R., Hasinger, G., Pietsch, W., et al., 1997, A&A 317, 328
- (47) Trinchieri G., Fabbiano G., Peres G., 1988, ApJ 325, 531
- (48) Trümper J., 1983, Adv. Space Res. 2, 241
- (49) Ulvestad J.S., Antonucci R.R.J., 1997, ApJ 488, 621
- (50) van den Bergh S., 1993, Comments on Astrophys. 17, 125
- (51) Voges W., Gruber R., Paul J., et al., 1992, “The ROSAT Standard Analysis Software System”. In: Proc. European ISY meeting, Symposium “Space Sciences with Particular Emphasis on High Energy Astrophysics”, p. 223
- (52) Vogler A., 1997, PhD thesis
- (53) Vogler A., Pietsch W., 1997, A&A 319, 459
- (54) Vogler A., Pietsch W., Kahabka P., 1996, A&A 305, 74
- (55) Vogler A., Pietsch W., Bertoldi F., 1997, A&A 318, 768
- (56) Waller W.H., Kleinmann S.G., Ricker G.R., 1988, AJ 95, 1057
- (57) Watson A.M., Gallagher III J.S., Holtzman J.A., et al., 1996, AJ 112, 534
- (58) Williams R.M., Chu Y.H., 1995, ApJ 439, 132
- (59) Zimmermann H.U., Lewin W., Predehl P., et al., 1994, Nat 367, 621
- (60) Zimmermann H.U., Becker W., Belloni T., et al., 1997, “EXSAS users guide”, July 1997 edition
Appendix A Sources located outside the area covered by the ellipse of NGC 253
| dist. | ‡ | blue | comments, results of ESO | |||||
|---|---|---|---|---|---|---|---|---|
| ′′ | mag | ⋆ | ⋆ | follow-up observations | ||||
| X1 | 00 46 12.41 | 25 16 59.5 | s | 3.8e1 | ||||
| 00 46 12.29 | 25 16 49.1 | 9.6 | f | 22.67 | 4.5e0 | |||
| X3 | 00 46 42.94 | 25 38 17.9 | s | 1.3e2 | ||||
| X4 | 00 46 47.28 | 25 21 50.8 | s | 3.4e1 | 3.1e1 | QSO, | ||
| X13 | 00 47 09.47 | 25 14 04.4 | f | 3.9e | 4.7e | |||
| X22 | 00 47 22.98 | 25 10 54.9 | s | 1.8e1 | 1.7e1 | QSO, | ||
| X27 | 00 47 30.12 | 25 08 59.5 | f | 1.1e | ||||
| X31 | 00 47 32.18 | 25 28 12.0 | s | 5.3e5 | 5.4e5 | |||
| X37 | 00 47 38.29 | 25 38 34.9 | s | 2.5e1 | ||||
| X39 | 00 47 39.37 | 25 25 33.9 | 14.3 | f | 23.01 | 7.3e1 | ||
| X43 | 00 47 44.23 | 25 26 51.5 | s | 1.7e1 | 1.1e1 | |||
| X46 | 00 47 46.55 | 25 27 36.0 | f | 4.1e1 | 2.1e1 | |||
| X47 | 00 47 46.55 | 25 29 55.7 | s | 1.1e1 | 1.5e1 | |||
| X49 | 00 47 50.04 | 25 00 34.6 | f | 22.84 | 4.7e0 | 2.3e0 | ||
| X53 | 00 47 50.33 | 25 08 42.1 | f | 3.8e1 | ||||
| X54 | 00 47 51.27 | 25 03 24.5 | f | 4.8e1 | 5.6e1 | |||
| X58 | 00 48 00.04 | 25 09 53.8 | s | 5.8e2 | 6.7e2 | QSO, | ||
| X59 | 00 48 01.18 | 25 27 38.4 | g | 9.1e3 | ||||
| 00 48 01.26 | 25 27 31.4 | 10.0 | s | 20.11 | 5.8e1 | |||
| X60 | 00 48 00.93 | 25 23 51.9 | f | 2.4e | 2.3e | |||
| X61 | 00 48 02.83 | 25 04 44.1 | s | 4.0e6 | 3.9e6 | |||
| X63 | 00 48 04.40 | 25 06 04.7 | s | 1.8e2 | ||||
| X64 | 00 48 08.46 | 25 25 07.2 | f | 1.6e | ||||
| X66 | 00 48 09.05 | 25 04 53.6 | f | 1.0e | 1.4e | |||
| X68 | 00 48 29.87 | 25 08 25.9 | f | 1.5e | 2.3e | |||
| X69 | 00 48 31.90 | 25 15 19.9 | f | 5.6e1 | ||||
| X70 | 00 48 43.91 | 25 29 40.5 | s | 7.7e2 | ||||
| X71 | 00 48 47.47 | 25 21 58.3 | s | 3.9e1 | X71 and X72 are located at the | |||
| X72 | 00 48 47.92 | 25 07 53.2 | s | 1.8e1 | position of the PSPC support ring | |||
| X73 | 00 48 58.78 | 25 00 17.4 | s | 1.1e3 |
The X-ray properties and light curves of sources located outside the ellipse of NGC 253 have already been presented in Table 3 and Fig. 5. In this appendix proposed optical identifications of the sources obtained from the ROE finding charts (Irwin et al. 1994) are listed (Table 11). For all sources, the ratio of the X-ray luminosity to the optical luminosity () is given. From observations of stars in our Galaxy (Neuhäuser 1998, priv. comm.) one expects ratios of . For that reason, only the X-ray emission of the sources X31, X61 and possibly X73 can be explained by the detection of stars, while the other sources are most likely extragalactic objects.
None of the X-ray field sources correlated with entries in the NASA IPAC extragalactic database (NED). However, X4 and X70 coincide with members of a list of quasar candidates (Crampton et al. 1997) and X59 with a radio point source (see radio images of Hummel et al. (1984) and NVSS catalog by Condon et al. (1998)), giving further support to their identification as background objects.
From November 5th to 7th, 1996, during an observation campaign at the 2.2 m ESO/MPG telescope at La Silla observatory, spectra of some of the optical candidates were obtained using the EFOSC2 spectrograph with grism #6 and a 15 wide long slit and the 20482048 15 m LORAL CCD, which gives a dispersion of 2Å per pixel, a spectral coverage of 3800 Å – 8000 Å, and a spectral resolution of 10 Å. The seeing typically was between 08 and 15. The data were reduced according to Pietsch et al. 1998c. Spectra of the optical candidates for X4, X22 and X58 (Fig. A1) clearly identified them as Quasars with redshifts of 0.6 to 1.3 (see Table 11) using Ciii , Mg ii , [O ii] [Ne iii] lines. As regards X13, we only took a spectrum of a stellar ROE object with B mag 18.5 close (7′′) to X13, though clearly outside the error circle, the stellar object close by being to faint for spectroscopic follow-up with this instrumentation. By comparing with the library of stellar spectra of Jacoby et al. (1984), the object can be classified as a M0 V star. The large offset and the ratio of 0.04 however – extremely high for a star of this type – strongly argue against this identification with X13.