X/-ray spectra of Seyferts and BeppoSAX observations
Abstract
BeppoSAX results on Seyfert galaxies are reviewed and discussed.
keywords:
X–ray astronomy, Seyfert galaxies1 Introduction
After more than 2 years of operation, it is time to review the contribution that BeppoSAX is providing to our knowledge of Seyfert galaxies. As the best characteristic of BeppoSAX is the wide energy band (0.1–200 keV), the results will mainly concern broad band spectra. Moreover, as shown in the last section, the MECS instrument, which has the best spatial resolution in the 2–10 keV band so far, is also giving valuable information on faint AGN and on the X–ray Background (XRB).
BeppoSAX (see Boella et al. 1997 for a comprehensive description of the mission) is composed by several instruments: 4 co–aligned Narrow Field Instruments (NFI); two Wide Field Cameras pointing opposite each other and perpendicularly to the NFI; an all sky -ray burst monitor. We are interested here in three of the NFI: LECS, MECS and PDS. The MECS is presently composed of two units (after the failure of a third one in March 1997); the working band is 1.5–10.5 keV, the energy resolution is 8% and the angular resolution is 0.7 arcmin (FWHM) at 6 keV. The characteristics of the LECS are similar to those of the MECS in the overlapping band, but its energy band extends down to 0.1 keV. The PDS is a passively collimated detector (about 1.51.5 degrees f.o.v.) working in the 13–200 keV energy range. A significant fraction of the BeppoSAX observing time (80% the first year, 60% the second year, 50% afterwards) is devoted to a “Core Program” (reserved to collaborations led by Italian or Dutch PIs, with a fraction also to MPE and ESA/SSD) which consists of major programs aiming to observe classes of sources in a sistematic way.
In this paper I will assume that the unification model for Seyfert galaxies (Antonucci 1993) is valid, i.e. Seyfert 1 and 2 galaxies are intrinsically identical (at least as far as the nuclear properties are concerned), and surrounded by a pc-scale molecular torus. If the line–of–sight does not intercept the torus, the nucleus can be directly observed and the source is classified as type 1; if the line–of–sight is blocked by the torus, the source is classified as type 2. I will come back to unification models in Sec. 2.
This review is necessarily incomplete and inevitably biased towards my own interests. I will discuss selected results on: bright, classical Seyfert 1 galaxies (see Brandt, this volume, for results on Narrow Line Seyfert 1 galaxies); Seyfert 2 galaxies (expecially Compton–thick ones, and a sample of optically selected sources); the Seyfert 1 galaxy NGC 4051, which switched off in May 1998 and on again a month later; and the HELLAS program, i.e. a sample of hard X–ray selected sources, whose identification program is in progress but which is already giving valuable results on the X–ray background.
2 Seyfert 1 galaxies
Before describing BeppoSAX results on Seyfert 1 galaxies, let me briefly recall the picture which has emerged after Ginga, ROSAT, CGRO and ASCA observations (see e.g. Mushotzky, Done & Pounds 1993; Fabian 1996).
The main component is a power law, cut–offing at high energies, and very likely originating from Inverse Compton emission from relativistic electrons to UV/soft X–ray photons, the latter possibly emitted by the accretion disc (see e.g. Svensson 1996 for a review).
A significant fraction of the primary radiation is intercepted and reprocessed by optically thick matter, either the accretion disc or the torus, or both. If the matter is neutral, the shape of the reflected component is determined basically by the competition between photoelectric absorption (whose cross section depends on the energy, after each photoabsorption edge, as ) and Compton scattering (whose cross section is constant, at least up to a few tens of keV). For cosmic abundances, the two cross sections are equal at about 10 keV. This so–called Compton reflection component has been studied in detail in several papers (see e.g. Lightman & White 1988; George & Fabian 1991; Matt, Perola & Piro 1991; Magdziarz & Zdziarski 1995); its spectrum is a broad hump, peaking around 30 keV. When added to the primary component, it hardens the total spectrum above a few keV and steepens it above a few tens of keV. Besides this Compton reflection continuum, the illumination of neutral matter by the primary radiation results also in a strong iron 6.4 keV fluorescent line, emitted by iron atoms after removal of a K electron by a X–ray photon. Kinematic and gravitational effects in the inner accretion disc modify the line profile (see e.g. Reynolds, this volume, and references therein), as firstly observed by ASCA in MCG–6-30-15 (Tanaka et al. 1995) and later on realized to be common in Seyfert 1s (Nandra et al. 1997).
At low energies (below 1 keV) a further component (“soft excess”), of rather unclear nature, may arise. Among the possible explanations, the tail of thermal emission from the accretion disc, and reflection from ionized matter (Ross & Fabian 1993) are the most popular. It is worth noticing that most of the observations on soft excesses are based on relatively narrow band instruments (like ROSAT) or on non–simultaneous broad band observations.
All these components, which most likely originate close to the black hole, (with the possible exception of the reflection from the torus) may pass throughout ionized matter (the “warm absorber”). The main signatures of this matter are absorption edges of high ionization ions, mainly oxygen (Halpern 1984; Nandra & Pounds 1992; Fabian et al. 1994), which has been unambiguosly observed by ASCA in a large fraction of Seyfert 1s (Reynolds 1997; George et al. 1997). Resonant absorption lines may also be important (Matt 1994; Krolik & Kriss 1995; Nicastro, Fiore & Matt 1998) and detectable by future missions featuring high resolution spectrometers.
2.1 A sample of bright Seyfert 1s
Two major BeppoSAX Core programs are devoted to classical Seyfert 1s: one (PI: G.C. Perola), aiming to study broad band spectra of bright sources; the second (PI: L. Piro), looking for spectral variability. About a dozen sources have been observed on aggregate so far (see Table 1). I am not going to discuss in detail any of these sources, but I will rather try to outline the main results of Seyfert 1s as a class that are emerging by these observations. Let me discuss separately the iron line, the Compton reflection continuum, the high energy cut–off and the soft excess.
| \tableline\tableline | ||||
| Source | S.E. | R | Ec (keV) | |
| \tableline | ||||
| NGC 41511 | ? | 1.2–1.5 | 0.1–0.5 | 7015 |
| NGC 55482 | NO | 1.55–1.65 | 0.7 | 200140 |
| NGC 55063 | ? | 2.05 | 1.1 | 400 (200) |
| NGC 74692 | Yes? | 2.00 | 1.0 | 200 |
| IC 4329A3 | NO | 1.86 | 0.6 | 350 |
| MCG-6-30-154 | NO | 2.05 | 1.3 | 170 |
| NGC 45935 | NO | 1.87 | 1.1 | 150 |
| Fairall 93 | ? | 2.01 | 0.9 | 260 |
| NGC 3516 | NO | 1.77 | 1.3 | 100 |
| Mrk 509 | NO | 1.94 | 1.7 | 105 |
| Mrk 766 | NO | 2.15 | ? | ? |
| \tableline\tableline |
1 Piro et al. 1998
2 preliminary results: Piro, private communication
3 Perola et al. 1998; Matt et al. 1998a
4 Guainazzi et al. 1998a
5 Guainazzi et al. 1998b
2.1.1 Iron line.
Due to the poorer energy resolution of BeppoSAX with respect to ASCA, no major advances about the iron line, especially when narrow, are to be expected, even if the broad band may help better estimating the underlying continuum. When the line is very broad, and the S/N good enough, like in the case of MCG–6-30-15, the MECS energy resolution is however sufficient to study the profile; this is demonstrated in Fig. 1, where the best fit model and residuals (with the line normalization set to zero for the sake of illustration) are shown. The best fit parameters for the line are consistent with those of Tanaka et al. (1995). In less favourable cases the line is usually still significantly broad, but the fit cannot discriminate between gaussian and relativistic disc profiles; the relativistic line hypotesis is nevertheless to be preferred on plausibility arguments (Fabian et al. 1995).

2.1.2 Compton reflection continuum.
Where BeppoSAX is expected to improve previous observations is in the higher energy part of the spectrum, and in particular in the measurement of the reflection component. The importance of the broad band in this respect is best illustrated by Fig. 2 (left panel) where a model with a reflection component included is fitted to the MECS data alone of NGC 5506 (first observation), and then extrapolated to higher energies: the upper panel shows still an excess of counts above 15 keV (due to the fact that the reflection component is actually not required by the MECS data), which is well cured when the MECS and PDS data are fitted together (lower panel). The right panel of Fig. 2 gives the probability contours for the power law index, , and the relative normalization of the reflection component, R = , where is the solid angle subtended by the reflecting matter at the illuminating source. The two parameters are very strongly correlated, and only the very broad energy band permits a good estimate of .
From Table 1, it is clear that the reflection component is ubiquitous in Seyfert 1s, so confirming the Ginga results (Nandra & Pounds 1994). The values of in the Table have been estimated assuming a face–on slab, and therefore the actual values of may be somwaht higher. Assuming a typical error of 30–50 percent, the measuread values are consistent with accretion disc reprocessing.


2.1.3 High energy cut–off.
High energy cut–offs, expected in presently popular Thermal Comptonization models and required to explain the hard X–ray background in terms of AGN (e.g. Comastri et al. 1995), can also be searched for by BeppoSAX if they are at low enough energies. For some of the sources in Table 1 the results are rather inconclusive, due to the limited S/N. For other sources more stringent lower limits are obtained to the –folding energy of an exponential cut–off.111Actual cut–offs in Thermal Comptonization models may be sharper than an exponential law, as remarked to me by A. Zdziarski. A conservative statement is that no deviations from a power law up to 200 keV are required by the data. For a few sources, finally, a positive detection is obtained. What it is clear from the table is that there is no a “universal” cut–off energy (i.e. temperature in thermal models), but that the spread in this quantity is significant.
2.1.4 Soft excesses.
The low energy sensitivity of BeppoSAX down to 0.1 keV, coupled with the wide band which permits a reliable estimate of the intrinsic power law, allows to search for soft excesses.222I mean “true” soft excesses, to be distinguished from “artificial” ones resulting from misfitting warm absorbers. Surprisingly enough, no soft excesses have been detected so far in classical Seyfert 1s (apart maybe from NGC 7469, this result being however preliminary: Piro, private communication). This sharply constrasts with BeppoSAX results on Narrow Line Seyfert 1s, where soft excesses are clearly observed, fully in agreement with both ROSAT and ASCA findings (Comastri et al. 1998a,b; Brandt, this volume). Also in low redshift quasars soft excesses are usually observed by BeppoSAX (Fiore et al. 1998a).
While a quantitative comparison with previous results is still in progress, this promises to be one of the most intriguing BeppoSAX result on Seyfert galaxies.
3 Seyfert 2 galaxies
According to unification models, Seyfert 2 galaxies are intrinsically identical to Seyfert 1s, but are observed through absorbing matter. Indeed, all Seyfert 2s detected so far in X–rays show evidence for absorption in excess of the Galactic one. The appearance of a Seyfert 2 in X–rays depends strongly on the column density of the absorbing matter. Two regimes may be identified: Compton–thin and Compton–thick. In the former case the absorbing matter has a column density lower than 1024 cm-2, and is therefore optically thin to Compton scattering; the nuclear radiation is then directly visible above a few keV. In the latter case, i.e. when cm-2, the absorber is thick to Compton scattering: radiation is intercepted and, when cm-2, the nucleus is virtually unobservable at all energies (up to the Klein–Nishina decline, at least), because photons are downscattered to energies where photoelectric absorption dominates, and eventually get absorbed. (For intermediate column densities, a fraction of the nuclear radiation can still escape above 10 keV; the Circinus galaxy, described below, in one example). The obscuration of the nucleus, which in Compton–thick sources is complete below 10 keV, permits to study in detail components which would have otherwise been diluted by the nuclear emission. In particular, reflection from both cold (the torus?) and ionized (the optical reflector?) matter may become visible. Details of the continuum and line emission expected in Compton–thick Seyfert 2s may be found in e.g. Ghisellini, Haardt & Matt (1994), Krolik, Madau & Zicky (1994), Matt, Brandt & Fabian (1996), Netzer (1996).
Apart from a few scattered observations in the Guest Observer program, three major Core Programs on Seyfert 2s are ongoing. The first one, led by L. Bassani, is a survey of bright Compton–thin Seyfert 2s. A summary of the first results can be found in Bassani et al. (1998a). Among the five sources observed, two of them (NGC 7674, Malaguti et al. 1998; Mrk 3, Cappi et al. 1998) turned out to be Compton–thick. For the other, genuinely Compton–thin sources, broad band BeppoSAX observations confirm the lack of any significant difference in X–ray properties (apart of course from absorption) with Seyfert 1s, in agreement with unification models.
The second and third programs, which I will discuss in more detail, are a survey of bright Compton–thick Seyfert 2s, and of an optically selected sample of faint Seyfert 2s.
3.1 Bright Compton–thick Seyfert 2s
Two objects have been observed so far in this program: Circinus Galaxy and NGC 1068.
3.1.1 Circinus Galaxy.
The Circinus galaxy is probably the nearest Active Nucleus, its distance being only 4 Mpc. It was observed by BeppoSAX on March 1998 (Matt et al. 1998b). The spectrum below 10 keV is consistent with the ASCA one (Matt et al. 1996), i.e. a reflection component from cold matter (including a huge iron K line) and a soft excess of unclear origin. Other lines are also clearly present in the spectrum (Guainazzi et al., in preparation), as evident from Fig. 3, again confirming ASCA findings.

The surprise comes when the best fit LECS+MECS model is extrapolated to the PDS band: it dramatically falls short of the data (Fig. 4, left panel). No known bright sources are present in the PDS field of view, so the best interpretation of the spectrum in Fig. 4 is that the nuclear emission is piercing through the absorber. This implies that the column density of the absorber is greater than 1024 cm-2 (to completely block the radiation below 10 keV) but lower than 1025 cm-2 (to still permit significant transmission; see Ghisellini, Haardt & Matt 1994). A similar situation has already been observed in a couple of other sources, namely NGC 4945 (Iwasawa et al. 1993; Done, Madejski & Smith 1996) and, with BeppoSAX, Mrk 3 (Cappi et al. 1998). In this situation, pure absorber models, like those usually available in xspec, are no longer applicable, unless the covering factor of the absorbing matter is very small. A model which includes Compton scattering is necessary; we have then constructed one using MonteCarlo simulations and fitted the data with it. The resulting column density is about 41024 cm-2 and the 2–10 keV unabsorbed nuclear luminosity is erg s-1.


3.1.2 NGC 1068.
It was observed around New Year 1997 for about 100 ksec (effective MECS observing time), and then again one year later for about 37 ksec. Results from the first observation on the high energy part of the spectrum can be found in Matt et al. (1997). The full band analysis of both observations is reported in Guainazzi et al., in preparation.
The broad band spectrum is rather complex: above about 4 keV the spectrum is dominated by reflection of the nuclear radiation from both cold matter, which dominates above 10 keV, and from warm matter. The presence of two reflection components was already noted by Marshall et al. (1993) in the BBXRT data, which in fact revealed a complex iron line with both neutral and highly ionized lines, a results later confirmed and improved by ASCA observations (Ueno et al. 1994). Matt, Brandt & Fabian (1996) and Iwasawa, Fabian & Matt (1997) attributed the cold reflection to the inner surface of the torus, and the highly ionized (He–like and H–like) lines to fluorescence and resonant scattering from optically thin (but possibly thick to resonant absorption), photoionized material. BeppoSAX, thanks to the hard X–ray sensitivity provided by the PDS, has permitted to confirm this scenario and estimate the relative contributions of the two components (Matt et al. 1997; see Fig. 5).


Below 4 keV, the spectrum is well described by a thermal–like component, probably related with the starburst regions (Wilson et al. 1992), plus the warm reflection component. As already known from ASCA (Ueno et al. 1994; Turner & Netzer 1997), the spectrum is very rich in emission lines (Fig. 6). A detailed discussion on the line spectrum can be found in Guainazzi et al., in preparation.

Long term variability has also been searched for. The 0.1-1 keV LECS light curves are shown in Fig. 7, together with the background. The left panel refers to the first observation, the right panel to the second one. A variation between the two observations is apparent, which clearly cannot be ascribed to variations in the background. The gain is also very stable. Unfortunately, however, it is possible that such variations arise from a larger shadowing, in the second observation, from the grid on top of the detector: even if the nominal position of the source in the two observations does not allow for such a change, uncertanties in the aspect reconstruction cannot permit to rule out definitely this hypothesis. The variation, if true, would be very important, as it would permit to estimate the size of the emitting region to be at most 1 light year. The starburst component is very extended (Wilson et al. 1992), and therefore the variation should be ascribed to the warm reflection component. Further long term monitoring of the source will hopefully settle this issue.

3.2 An optically selected sample of Seyfert 2s, and the unification model
The results described above can be easily understood in the framework of unification models. However, in recent years many works showed that some intrinsic differences bewteen the average properties of Seyfert 1s and 2s do exist: enhanced star formation in Seyfert 2 galaxies (Maiolino et al. 1997); different morphologies between galaxies hosting type 1 and 2 nuclei, those hosting type 2 being on average more irregular (Maiolino et al. 1997, Malkan et al. 1998); a greater dust content in Seyfert 2s (Malkan et al. 1998). The aspect angle is clearly not the only relevant parameter. The next question is, of course, whether the differences involve the nuclear properties or only the environment. In this respect, it is important to observe in hard X–rays (where nuclear activity dominates the emission) a sample of optically selected sources. Salvati et al. (1997) and Maiolino et al. (1998) studied with BeppoSAX an OIII flux–limited sample of Seyfert 2s, in the assumption that the OIII flux is a good isotropic indicator of Seyfert activity (this is probably not completely true, but it is in any case the best one). The first result of this program is that all sources observed so far have been detected (9 out of 9, Risaliti et al. 1998), with typical X–ray luminosities exceeding those of normal galaxies. This is a rather strong indication that all Seyfert 2 have a type 1 nucleus, and then that any difference between the two classes should be searched for in the nuclear environment. Let me suggest a modification to the zero–order unification model (see Fig. 8): all Seyferts have a type 1 nucleus plus circumnuclear, 100 pc–scale dust lanes (Malkan et al. 1998), which I presume to be optically thin to Compton scattering (otherwise, too much circumnuclear matter would probably be present). Only a fraction of Seyferts, however, have also the (Compton–thick) molecular torus, which possibly forms preferentially in irregular, disturbed galaxies (which have also, probably for the same reason, an enhanced star formation activity as well as an overall greater dust content). As illustrated in Fig. 8, if the nucleus is directly observed, the source is a Seyfert 1. If the line–of–sight intercepts matter other than the torus (i.e. a dust lane, or even the galactic disc for highly inclined galaxies) the source falls in the mixed bag including Compton–thin Seyfert 2’s, intermediate Seyfert and NELGs. If, finally, the line–of–sight intercepts the torus, the source is a Compton–thick Seyfert 2 galaxy. In this scenario, Seyfert 1s would be preferentially, but not exclusively (see next section for a Seyfert 1 with the torus) observed among torus–free sources. It is worth noticing that another results of the program under discussion is that Compton–thick sources contributes to a large fraction of the total (see Fig. 9). Moreover, other Compton–thick sources have been discovered by BeppoSAX (Malaguti et al., 1998; Ueno et al. 1998; Cappi et al. 1998). Therefore, even if in the proposed scenario the presence of a molecular torus is no longer ubiquitous, it should nevertheless still be rather common (see also below).

.
One of the aim of the program is to determine the distribution of column densities. As shown in Fig. 9, a large fraction of sources turned out to be Compton–thick. However, the sample is biased in favour of high column densities. In fact, sources have been selected on the basis of the OIII flux, but excluding sources for which good spectra (from Ginga and/or ASCA) were already available. The Ginga and ASCA samples were largely X–ray selected, and therefore biased towards low column density (and therefore large flux). The real NH distribution should then be a mixture of that from BeppoSAX and the ones from Ginga and ASCA. Collecting all data available in the literature, Bassani et al. (1998b) have derived the “true” column density distribution: the average value of the column is 3 cm-2, and the fraction of Compton-thick sources is as large as 30%.

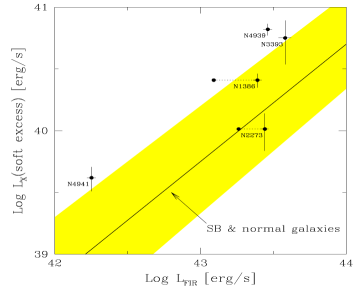
Most of the sources in the Maiolino et al. (1998) sample show evidence for soft X–ray emission in excess of the (absorbed) hard X–ray emission. The question is whether this emission is related to nuclear activity (i.e. scattering of the nuclear radiation from ionized material) or is rather related to starburst regions. In Fig. 10 the soft X–ray luminosities vs. the IR luminosities of the sources in the sample, for which a good estimate of the soft excess is possible, are shown. The thick solid line indicates the relationship for starburst and normal galaxies (David et al. 1992); the shaded area is the 90% confidence limit on this relation. Clearly, more data are needed, but at a first glance one would say that in general some nuclear–related emission contributes, but not necessarily dominates, the soft X–rays.
4 The strange case of NGC 4051


The spectrum in the left panel of Fig. 11 (from Guainazzi et al. 1998c) closely resembles those of Compton–thick Seyfert 2 galaxies (see previous section), i.e. a very flat continuum and a prominent iron line. And, actually, the interpretation is the same: a reflection–dominated spectrum. The surprising fact is that this is the spectrum of a well known Seyfert 1 galaxy, NGC 4051. The source was observed by BeppoSAX on 9-11 May 1998, and was caught in an unprecedented low state (see right panel of Fig. 11), which show the BeppoSAX best fit model together with the 1994 ASCA one), 20 times fainter than the average flux. The source is usually very variable on fairly short time scales, and in the past it has probably been observed at such a low flux level, but usually only for a few thousands seconds, never for a so long time. The upper limit on the nuclear component implies a dimming of at least a factor 35 with respect to the average value. We have therefore observed, for the first time, what can be practically considered a switching–off of an active nucleus, which has left the reflection component as the only echo of the past activity. This may also be considered one of the strongest evidence for the presence of substantial circumnuclear matter in Seyfert 1s.
Comparing the BeppoSAX and ASCA best fit models in the right panel of Fig. 11, it seems that also the reflection component was lower during the BeppoSAX observation, even if this evidence must be taken with great caution. This could imply that part of the reflection, when the nucleus is active, originates in the accretion disc, which would respond almost simultaneously (say, within 1 day) to any variation of the nuclear radiation. Alternatively, if all the reflection comes from a pc–scale torus (or sub–pc; remember that NGC 4051 is one of the less luminous AGN, and it is well possible that all distances are scaled down there), a fading of the reflection component on time scales of months is expected. This would have provided a tool to “measure” the size of the torus. We therefore observed the source again about one and half month later. Unfortunately, this time the source did not collaborate: it resumed the normal level of activity, and the spectrum was no longer reflection–dominated (Orr et al. 1998).
5 The HELLAS sample and the XRB
The good spatial resolution of the MECS instrument onboard BeppoSAX has been exploited to search for serendipitous, hard X–ray sources in the field of view of pointed targets (Giommi et al. 1998). One of the aims of this program, called HELLAS (High Energy Llarge Area Survey), is to assess, in a band where its energy density is much greater than in the so far most studied band below 2 keV, the nature of the sources making the X–ray Background (XRB; see Barcons 1996 and Matt 1995 for recent reviews). The survey presently consists of about 150 sources in the 5–10 keV energy band (a fraction of them being detected only in this band) over an area of about 50 degrees. Taking properly into account the sky coverage, these numbers translate to a density of 20 sources per square degree down to a 5–10 keV flux of 5 erg cm-2 s-1, which in turn corresponds to a 35-40 percent of the cosmic X-ray background in this band being resolved (Fiore et al. 1998b).
The next question, of course, is the nature of these sources. An extensive identification program is in progress, with several night allocated to both northern and southern telescopes. First runs have already been highly rewarding, as reported in Fiore et al. (1998b). Out of ten sources observed (for all of them specta were taken of all source, within the MECS error box, down to a R magnitude of 20), 9 of them have been identified. Note that the sources were selected as being the only ones visible from the telescope at that time of the year, and therefore there is no astrophysical bias whatsoever. 8 sources were identified with AGNs. (The eight source is identified with a LINER, therefore a borderline object). The corresponding chance probability is only 0.15%. It is worth noticing that the averege spectrum of these sources is consistent with that of the XRB. Therefore, from all the pieces of evidence just summarized, one is authorize to infer that at least a large fraction of the XRB in this band is made by AGN.
Of the 8 AGN identified, 3 are normal, “blue” QSO, 2 are “red” QSO, and 3 are intermediate (1.8–1.9) Seyferts, with redshifts ranging from 0.17 to 1.3. Four sources (the three intermediate Seyferts and one of the red quasars) show evidence for X–ray absorption with column densities in excess of 1022 cm-2. These findings therefore support models in which the hard XRB is made by a mixture of obscured and unobscured AGN (Comastri et al. 1995, and references therein).
Acknowledgements.
I thank all my collaborators in the various BeppoSAX observing programs described in this paper. In particular, I thank F. Fiore, M. Guainazzi, R. Maiolino, F. Nicastro, and G.C. Perola for many helpful discussions, and L. Piro for allowing me to quote results before publication. I am indebted to the BeppoSAX Science Data Center for frequent help in the data reduction. I acknowledge financial support from ASI and MURST.References
- [1] ntonucci R., 1993, ARA&A 31, 473
- [2] arcons X., 1996, Memorie della S.A.It., vol. 67, N. 1/2, 481
- [3] assani L., et al., 1998a, in “From nano– to tera–eV. All the colours of AGN”, in press
- [4] assani L., et al., 1998b, ApJ, submitted
- [5] oella G., et al., 1997a, A&ASS, 122, 299
- [6] appi M., et al., 1998, A&A, submitted
- [7] omastri A., Setti G., Zamorani G., Hasinger G., 1995, A&A, 296, 1
- [8] omastri A., et al., 1998a, A&A 333, 31
- [9] omastri A., et al., 1998b, in “The Active X–ray sky”, p. 523
- [10] avid L.P., Jones C., Forman W., 1992, ApJ, 388, 82
- [11] one C., Madejski G.M., Smith D.A., 1996, ApJ, 463, 63
- [12] abian A.C., et al., 1994, PASJ, 46, 137
- [13] abian A.C., et al., 1995, MNRAS, 277, L11
- [14] abian A.C., 1996, in Röntgenstrahlung in the Universe”, MPE Report 263, p. 403
- [15] iore F., et al., 1998a, in “The Active X–ray sky”, p. 529
- [16] iore F., et al., 1998b, in “The Extreme Universe”, in press
- [17] eorge I.M., Fabian A.C. 1991, MNRAS, 249, 352
- [18] eorge I.M., et al., 1998, ApJS, 114, 73
- [19] hisellini G., Haardt F., Matt G., 1994, MNRAS, 267, 743
- [20] iommi et al., 1998, in “The Active X–ray sky”, p. 591
- [21] uainazzi M. et al., 1998a, A&A, submitted
- [22] uainazzi M. et al., 1998b, A&A, submitted
- [23] uainazzi M. et al., 1998c, MNRAS, in press
- [24] alpern J.P., 1984, ApJ, 281, 90
- [25] wasawa K., et al., 1993, ApJ, 409, 155
- [26] wasawa K., Fabian A.C., Matt G., 1997, MNRAS, 289, 443
- [27] rolik J.H., Madau P., Życki P.T., 1994, ApJ, 420, L57
- [28] rolik J.H, Kriss G.A. 1995, ApJ, 447, 512
- [29] ightman A.P., White T.R., 1988, ApJ, 335, 57
- [30] agdziarz P., Zdziarski A.A., 1995, MNRAS, 273, 837
- [31] aiolino R., Ruiz M., Rieke G.H., Papadopoulos P., 1997, ApJ, 485, 552
- [32] aiolino R., et al., 1998, A&A, 338, 781
- [33] alaguti G., et al., 1998, A&A, 1998, 331, 519
- [34] alkan M.A., Gorjian V., Tam R., 1998, ApJS, 117, 25
- [35] arshall F.E., et al., 1993, ApJ, 405, 168
- [36] att G., Perola G.C., Piro L., 1991, A&A, 247, 25
- [37] att G., 1994, MNRAS, 267, L17
- [38] att G., 1995, in Proc. of the Vulcano Workshop 1994, F. Giovannelli and G. Mannocchi eds., Bologna: Editrice Compositori, 163
- [39] att G., Brandt W.N., Fabian A.C., 1996, MNRAS 280, 823
- [40] att G., et al., 1996, MNRAS, 208, 253
- [41] att G., et al., 1997, A&A, 325, L13
- [42] att G., et al., 1998a, in “The Extreme Universe”, in press
- [43] att G., et al., 1998b, A&A, submitted
- [44] ushotzky R.F., Done C., Pounds K. A., 1993, ARA&A, 31, 717
- [45] andra K., Pounds K.A., 1992, Nat, 359, 215
- [46] andra K., Pounds K.A., 1994, MNRAS 268, 405
- [47] andra K., George I. M., Mushotzky R. F., Turner T. J., Yaqoob T., 1997, ApJ, 477, 602
- [48] etzer H., 1996, ApJ, 781, 796
- [49] icastro F., Fiore F., Matt G., 1998, ApJ, submitted
- [50] rr A., et al, in Proc. of the 32nd COSPAR Scientific Assembly, in press
- [51] erola G.C., et al., 1998, in “From nano– to tera–eV. All the colours of AGN”, in press
- [52] iro L., et al., 1998, in “The Active X–ray sky”, p. 481
- [53] eynolds C.S., 1997, MNRAS, 287, 513
- [54] isaliti G., et al., 1998, in “From nano– to tera–eV. All the colours of AGN”, in press
- [55] oss R.R., Fabian A.C., 1993, MNRAS, 261, 74
- [56] alvati M., et al., 1997, A&A, 323, L1
- [57] vensson R., 1996, A&AS, 120, 475
- [58] anaka Y., et al., 1995, Nat, 375, 659
- [59] urner T.J., Netzer H., 1997, ApJ, 488, 694
- [60] eno S., et al., 1994, PASJ 46, L71
- [61] eno S., et al., 1998, in “The Active X–ray sky”, p. 554
- [62] ilson A.S., Elvis M., Lawrence A., Bland–Hawthorn J., 1992, ApJ, 391, L75