A Reanalysis of the Ultraviolet Extinction from Interstellar Dust in the Large Magellanic Cloud
Abstract
We have reanalyzed the Large Magellanic Cloud’s (LMC) ultraviolet (UV) extinction using data from the IUE final archive. Our new analysis takes advantage of the improved signal–to–noise of the IUE NEWSIPS reduction, the exclusion of stars with very low reddening, the careful selection of well matched comparison stars, and an analysis of the effects of Galactic foreground dust. Differences between the average extinction curves of the 30 Dor region and the rest of the LMC are reduced compared to previous studies. We find that there is a group of stars with very weak 2175 Å bumps that lie in or near the region occupied by the supergiant shell, LMC 2, on the southeast side of 30 Dor. The average extinction curves inside and outside LMC 2 show a very significant difference in 2175 Å bump strength, but their far–UV extinctions are similar. While it is unclear whether or not the extinction outside the LMC 2 region can be fit with the relation of Cardelli, Clayton & Mathis (CCM), sightlines near LMC 2 cannot be fit with CCM due to their weak 2175 Å bumps. While the extinction properties seen in the LMC lie within the range of properties seen in the Galaxy, the correlations of UV extinction properties with environment seen in the Galaxy do not appear to hold in the LMC.
1 Introduction
As our nearest galactic neighbors, the Magellanic Clouds offer a unique opportunity to study the effects of different galactic environments on dust properties. Their importance has increased with the recent discovery that the dust in starburst galaxies appears to be similar to that in the star forming bar of the Small Magellanic Cloud (SMC) (Calzetti et. al. 1994; Gordon, Calzetti & Witt 1997, Gordon & Clayton 1998 [GC]). Understanding dust extinction properties in nearby galaxies is a useful tool in interpreting and modeling observations in a wide range of extragalactic systems.
Previous studies of the LMC extinction have all arrived at similar conclusions, e.g. the average LMC extinction curve is characterized by a weaker 2175 Å bump and a stronger far–UV rise than the average Galactic extinction curve. Two early studies (Nandy et. al. 1981; Koornneef & Code 1981) found little spatial variation in the LMC extinction and computed an average LMC extinction curve. However, both samples were dominated by stars near the 30 Doradus star forming region and it was thus unclear whether their average curves applied to the LMC as a whole. A study by Clayton & Martin (1985) expanded the sample to include a larger number of non–30 Dor stars and reported tentative evidence for differences between the extinction curves observed in the 30 Dor region and the rest of the LMC. Fitzpatrick (1985, hereafter F85) expanded the number of available reddened stars to 19 including 7 outside of the 30 Dor region, allowing a more detailed analysis of regional variations. F85 found a significant difference between the UV extinction characteristic of the 30 Dor region and that outside the 30 Dor region. The average 30 Dor UV extinction curve was found to have a lower bump strength and stronger far–UV rise (2 units at m-1) than the non–30 Dor stars. Fitzpatrick (1986, hereafter F86) expanded the sample by 8 lightly reddened stars located outside the 30 Dor region and confirmed the results of F85. Clayton et al. (1996) measured the extinction of two LMC stars, one in 30 Dor and one outside 30 Dor down to 1000 Å. Both extensions seem to be consistent with extrapolations of the IUE extinction curves to shorter wavelengths.
As part of a program to quantify the range of extinction behavior in the Local Group, we have reanalyzed the extinction in the Magellanic Clouds. In particular, no analysis has been done since the discovery that the UV extinction along most Galactic sightlines could be described by one parameter, the ratio of total–to–selective extinction, (Cardelli, Clayton, & Mathis 1989, hereafter CCM). It is of great interest whether such a relation exists for the Magellanic clouds. In this paper, we discuss the results for the LMC. An analysis of the SMC extinction appears in GC.
2 The Data and the Computation of Extinction Curves
2.1 The Sample
Our initial sample of reddened stars consisted of that defined by F85. In an effort to expand the sample we searched the updated electronic catalog of Rousseau et. al. (1978), available via the SIMBAD database, which consists of LMC stars. Two initial cuts of the catalog were made: (1) stars with spectral types later than B4 were discarded and (2) we required . The first criterion limits the effects of spectral type mismatches in the resulting extinction curves, which can be quite large for spectral types later than about B3 (e.g. F85). The second criterion removes unreddened or lightly reddened stars from consideration. We note that all the F85 stars were included in the resulting sample of stars while none of the F86 stars were included as they all had . We then eliminated emission line stars and composite–spectrum objects from our list. The remaining stars were checked against the IUE database and all of those for which both long and short wavelength low-dispersion spectra existed (54) were examined in more detail. Only five stars from this sample were found to be both significantly reddened and have high S/N IUE spectra. These stars were added to our sample and their IUE spectra are listed in Table 1. We selected 67 unreddened comparison stars from the sample of LMC supergiants in Fitzpatrick (1988) for use in constructing extinction curves using the pair method (Massa, Savage & Fitzpatrick 1983). Approximate UV spectral types for all of our reddened stars and their respective comparison stars (see below for a discussion of the selection of extinction pairs) were estimated from a visual comparison of the IUE spectra to the grid of LMC stars with UV spectral types given in Neubig & Bruhweiler (1998). The estimated UV spectral types are reported in Table 2.
| SWP | LWP/LWR | |
|---|---|---|
| SK | Images | Images |
| 66 88 | 39129,45383,45384 | LWP18165,23730 |
| 68 23 | 39155 | LWP18198 |
| 69 206 | 36552,39832 | LWP15751 |
| 69 210 | 23270 | LWR17442 |
| 69 279 | 08924 | LWR07672 |
| PhotometryaaOptical photometry from Rousseau et. al. (1978), F85 and Fitzpatrick (1988). IR photometry from Morgan & Nandy (1982) and Clayton & Martin (1985). | Spectral TypebbOptical spectral types from Rousseau et. al. (1978), F85 and Fitzpatrick (1988). UV spectral types estimated by comparison with LMC UV spectral types of Neubig & Bruhweiler (1998). | |||||||||
|---|---|---|---|---|---|---|---|---|---|---|
| SK | E(BV)GalccGalactic foreground reddening from Oestreicher et. al. (1995); Colon designates uncertain value. | V | BV | UV | JV | HV | KV | Optical | UV | KeyddKey to position in Figure 1. |
| 66 19 | 0.09: | 12.79 | 0.12 | 0.66 | 0.35 | 0.45 | – | B4 I | B0 Ia | 1 |
| 66 169 | 0.03 | 11.56 | 0.13 | 1.13 | – | – | – | O9.7 Ia | O9 Ia | |
| 66 88 | 0.06 | 12.70 | 0.20 | 0.45 | – | – | – | B2: | B3 Ia | 2 |
| 66 106 | 0.07 | 11.72 | 0.08 | 0.99 | – | – | – | B2 Ia | B3 Ia | |
| 67 2 | 0.06 | 11.26 | 0.08 | 0.69 | 0.18 | 0.21 | 0.28 | B1.5 Ia | B2 Ia | 3 |
| 66 35 | 0.07: | 11.55 | 0.07 | 0.95 | – | – | – | B1 Ia | B2 Ia | |
| 68 23 | 0.06 | 12.81 | 0.22 | 0.39 | – | – | – | OB | B4 Ia | 4 |
| 67 36 | 0.07 | 12.01 | 0.08 | 0.89 | – | – | – | B2.5 Ia | B3 Ia | |
| 68 26 | 0.04 | 11.67 | 0.13 | 0.62 | – | – | – | B8: I | B3 Ia | 5 |
| 66 35 | 0.07: | 11.55 | 0.07 | 0.95 | – | – | – | B1 Ia | B2 Ia | |
| 69 108 | 0.08 | 12.10 | 0.27 | 0.22 | 0.57 | 0.67 | 0.75 | B3 I | B3 Ia | 6 |
| 67 78 | 0.05 | 11.26 | 0.04 | 0.77 | – | – | – | B3 Ia | B3 Ia | |
| 70 116 | 0.05 | 12.05 | 0.11 | 0.61 | 0.37 | 0.43 | 0.57 | B2 Ia | B3 Ia | 7 |
| 67 256 | 0.07 | 11.90 | 0.08 | 0.97 | – | – | – | B1 Ia | B3 Ia | |
| 68 129 | 0.07 | 12.77 | 0.03 | 0.81 | – | – | – | B0.5 | O9 Ia | 8 |
| 68 41 | 0.05 | 12.0 | 0.14 | 1.10 | – | – | – | B0.5 Ia | B0 Ia | |
| 68 140 | 0.04 | 12.72 | 0.06 | 0.77 | 0.26 | 0.31 | 0.37 | B0: | B0 Ia | 9 |
| 68 41 | 0.05 | 12.0 | 0.14 | 1.10 | – | – | – | B0.5 Ia | B0 Ia | |
| 68 155 | 0.02 | 12.72 | 0.03 | 0.79 | – | – | – | B0.5 | O8 Ia | 10 |
| 67 168 | 0.03 | 12.08 | 0.17 | 1.17 | – | – | – | O8 Iaf | O8 Ia | |
| 69 206 | 0.08 | 12.84 | 0.14 | 0.62 | – | – | – | B2: | O9 Ia | 11 |
| 67 5 | 0.06 | 11.34 | 0.12 | 1.07 | – | – | – | O9.7 Ib | B0 Ia | |
| 69 210 | 0.07 | 12.59 | 0.36 | 0.23 | – | – | – | B1.5: | B1 Ia | 12 |
| 66 118 | 0.08 | 11.81 | 0.05 | 0.91 | – | – | – | B2 Ia | B3 Ia | |
| 69 213 | 0.08 | 11.97 | 0.10 | 0.65 | 0.26 | 0.29 | 0.33 | B1 | B1 Ia | 13 |
| 70 120 | 0.06 | 11.59 | 0.06 | 0.94 | 0.21 | 0.25 | 0.14 | B1 Ia | B1.5 Ia | |
| 69 228 | 0.06 | 12.12 | 0.07 | 0.69 | 0.10 | 0.14 | 0.14 | OB | B2 Ia | 14 |
| 65 15 | 0.12 | 12.14 | 0.10 | 1.02 | – | – | – | B1 Ia | B1 Ia | |
| 69 256 | 0.07 | 12.61 | 0.03 | 0.80 | 0.03 | 0.04 | 0.02 | B0.5 | B1 Ia | 15 |
| 68 41 | 0.05 | 12.0 | 0.14 | 1.00 | – | – | – | B0.5 Ia | B0 Ia | |
| 69 265 | 0.06 | 11.88 | 0.12 | 0.51 | – | – | – | B3 I | B3 Ia | 16 |
| 68 40 | 0.05 | 11.71 | 0.07 | 0.86 | – | – | – | B2.5 Ia | B3 Ia | |
| 69 270 | 0.05 | 11.27 | 0.14 | 0.52 | 0.32 | 0.40 | 0.46 | B3 Ia | B2 Ia | 17 |
| 67 228 | 0.03 | 11.49 | 0.05 | 0.87 | – | – | – | B2 Ia | B2 Ia | |
| 69 279 | 0.02 | 12.79 | 0.05 | 0.79 | 0.19 | 0.28 | 0.34 | OB0 | O9 Ia | 18 |
| 65 63 | 0.03 | 12.56 | 0.16 | 1.18 | – | – | – | O9.7 I: | O9 Ia | |
| 69 280 | 0.05 | 12.66 | 0.09 | 0.65 | 0.22 | 0.22 | 0.33 | B1 | B1.5 Ia | 19 |
| 67 100 | 0.05 | 11.95 | 0.09 | 0.95 | – | – | – | B1 Ia | B1 Ia | |
An implicit assumption of the pair method is that the Galactic foreground reddening is the same for both the program and comparison stars and, hence, cancels out of the resulting LMC extinction curve. As pointed out by several authors (e.g. Schwering & Israel 1991; Oestreicher, Gochermann, & Schmidt–Kaler 1995), the Galactic foreground towards the LMC is quite variable ranging from to 0.17. Schwering & Israel (1991) constructed a foreground reddening map towards the LMC using HI data and a relationship between and the HI column density. They examined the F85 and F86 stars at a spatial resolution of 48′ (the resolution of the HI data) and found systematically higher Galactic foreground reddening associated with the comparison stars than the reddened stars. Accounting for this systematic affect reduced the difference between the 30 Dor and non–30 Dor extinction curves. Oestreicher et. al. (1995) used reddenings to LMC foreground stars to construct a Galactic foreground reddening map with a resolution of 10′. We have quantified the differences in Galactic foreground reddening for our sample using the higher resolution map of Oestreicher et. al. (1995). For all but one of our pairs in the 30 Dor sample, the difference in the Galactic foreground reddening between the reddened and comparison stars, E(BV) while for the non–30 Dor sample, E(BV) for all but one pair as well. There is no systematic difference in the foreground reddening between program and comparison stars in either sub–sample with the average E(BV)Gal being near 0 for both samples. The values for the Galactic foreground component of the reddening for each star used in the analysis is given in Table 2. For the two pairs with large foreground differences (SK 66 19/SK 66 169, SK 69 228/SK 65 15) we have estimated the maximum effect on the extinction curve to be less than the photometric uncertainties. Therefore, we have not corrected the individual curves for the differences in the Galactic foreground.
2.2 The Extinction Curves
Extinction curves were constructed using the standard pair method (e.g. Massa, Savage & Fitzpatrick 1983). Short and long wavelength spectra were extracted using the NEWSIPS reduction, co–added, binned to the instrumental resolution of 5 Å and merged at the maximum wavelength in the short wavelength spectrum. Uncertainties in the extinction curve contain terms that depend both on the broadband photometric uncertainties as well as uncertainties in the fluxes. The flux uncertainties are now calculated directly in the NEWSIPS reduction. For details of our error analysis, the reader is referred to GC.
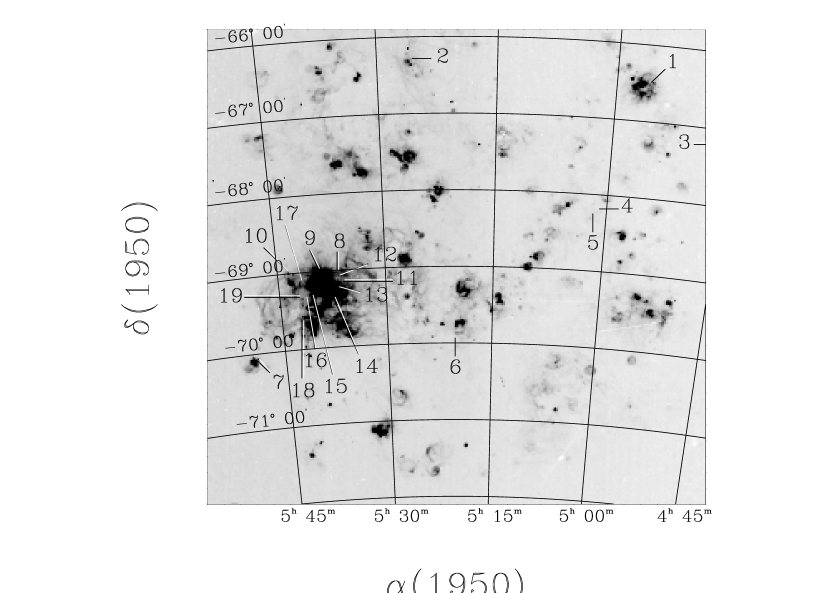
Previous studies suffered from systematic temperature and luminosity mismatches between the unreddened/reddened star pairs. These mismatches were evident in the imperfect line cancellations seen in the extinction curves, especially the Fe III blend near 5.1 . This study minimizes mismatches by using a larger sample of comparison stars than was available to previous studies. Comparison stars for each reddened star were selected to satisfy the three Fitzpatrick criteria (F85); in addition, we required between the reddened and comparison stars to minimize the uncertainties in the extinction curve. The first criterion requires that be appropriate to dust reddening. The average value of for the LMC is (F85). Stars with were selected. The second criterion requires that the difference in intrinsic magnitudes between the comparison and reddened stars be “small” (). The magnitudes of our program stars were dereddened assuming . As all LMC stars are at roughly the same distance, this criterion amounts to assuring comparable absolute magnitudes between the comparison and reddened stars thus minimizing luminosity mismatches. The third criterion requires that the comparison and reddened star UV spectra be well–matched. This minimizes residual features in the extinction curve not due to extinction. This procedure resulted in 3–10 potential comparison stars for each reddened star. Each potential comparison star was used to compute an extinction curve. The reddened/comparison star pair which resulted in a curve with the smallest line residuals was adopted. Five stars from the F85 sample had and were discarded, leaving a total of 19 reddened stars in our study. These included three 30 Dor stars (SK 68 126, 69 199 and 69 282) and two non–30 Dor stars (SK 68 107 and 71 52). In addition, five stars have been added, three to the 30 Dor sample (SK 69 206, 69 210 and 69 279) and two to the non–30 Dor sample (SK 66 88 and 68 23). We have indicated the positions of all of our stars on an H map of the LMC in Figure 1. A key to the numbering of the stellar positions in Figure 1 is given in Table 2.
The final extinction curves computed for each pair are shown in Figure 2 and the star pairs are listed in Table 2. The extinction curves have been fit using the Fitzpatrick & Massa (1990, hereafter FM) parameterization. The FM fit is a six parameter fit including a linear background, a Drude profile representing the 2175 Å bump, and a far–UV curvature term. We emphasize that this parameterization is empirical and the individual functions describing the extinction curve probably have limited physical significance (Mathis & Cardelli 1992). The FM fits to individual extinction curves are plotted in Figure 2 and the best fit parameters for each curve are given in Table 3; the functional form of the parameterization is given as a footnote to Table 3. In determining the uncertainties on the individual fit parameters we have considered the effects of two sources of uncertainty, photometric and spectral mismatch. The photometric uncertainties include those in the broad band optical photometry as well as those in the IUE fluxes (for a detailed discussion of these uncertainties, see GC). We estimate their effect on the FM parameters by shifting the extinction curves upward by and downward by point–by–point. FM fits were made to both of the shifted extinction curves and the error in each individual parameter is taken as one–half the absolute value of the difference in the fit parameters between the two curves. The photometric uncertainties contribute most significantly to errors in the FM parameters , and ; they have little effect on the bump parameters and . The effects of mismatch errors on the FM parameters were taken from Cardelli et. al. (1992). By varying the spectral type of the comparison star and fitting the resulting extinction curve, they were able to estimate the uncertainties introduced in the FM fit parameters (Table 6 of Cardelli et. al. 1992). We adopt the quadrature sum of the these two sources of uncertainty as our estimate of the uncertainties in the individual FM fit parameters (Table 3). For weak features (ie. the weak bump lines of sight in our sample), the uncertainties introduced by spectral mismatches may be underestimated by the adopted uncertainties.
|
FM Fit ParametersaaAnalytic fit to extinction curve following FM:
where , and and otherwise. |
||||||||
|---|---|---|---|---|---|---|---|---|
| SK | (BV) | |||||||
| LMC–Average Sample | ||||||||
| 66 19 | 0.25 | 4.6530.010 | 0.970.07 | 0.090.44 | 0.750.11 | 2.340.42 | 0.910.12 | 2.490.57 |
| 66 88 | 0.28 | 4.5790.019 | 1.030.06 | 0.880.38 | 1.000.13 | 2.770.46 | 0.480.10 | 2.610.53 |
| 67 2 | 0.15 | 4.6250.010 | 1.080.07 | 3.590.40 | 1.670.26 | 3.710.46 | 0.910.20 | 3.180.57 |
| 68 23 | 0.30 | 4.5130.037 | 1.050.06 | 0.110.42 | 0.650.10 | 4.280.84 | 0.710.14 | 3.880.88 |
| 68 26 | 0.20 | 4.6710.012 | 1.100.06 | 0.640.43 | 0.900.13 | 3.760.44 | 0.430.11 | 3.110.50 |
| 68 129 | 0.17 | 4.5870.011 | 0.730.06 | 1.480.39 | 1.260.19 | 1.500.42 | 0.720.16 | 2.810.91 |
| 69 108 | 0.31 | 4.5740.011 | 1.040.06 | 1.250.39 | 0.980.11 | 4.310.44 | 0.540.10 | 3.980.61 |
| 69 206 | 0.26 | 4.5190.034 | 0.650.05 | 1.400.38 | 1.230.14 | 1.080.43 | 0.380.11 | 2.561.09 |
| 69 210 | 0.41 | 4.6690.011 | 0.670.06 | 1.150.37 | 1.120.11 | 1.420.41 | 0.520.11 | 3.161.07 |
| 69 213 | 0.16 | 4.5700.017 | 0.770.05 | 2.620.37 | 1.560.24 | 2.080.46 | 0.830.21 | 3.510.90 |
| AveragebbUncertainties in the averages quoted as the standard deviation of the sample mean for the respective samples, eg. . | 0.25 | 4.5960.017 | 0.910.05 | 1.280.34 | 1.110.10 | 2.730.37 | 0.640.06 | 3.130.16 |
| LMC 2 Sample | ||||||||
| 68 140 | 0.20 | 4.5590.022 | 1.070.09 | 1.020.40 | 1.130.17 | 1.620.41 | 0.770.14 | 1.410.43 |
| 68 155 | 0.20 | 4.6630.011 | 0.910.07 | 4.380.42 | 1.820.23 | 2.060.41 | 0.300.11 | 2.490.62 |
| 69 228 | 0.17 | 4.6580.016 | 1.260.13 | 2.330.38 | 1.200.18 | 2.300.42 | 0.170.09 | 1.450.40 |
| 69 256 | 0.17 | 4.6220.038 | 1.210.05 | 2.500.37 | 1.300.19 | 2.150.51 | 0.300.11 | 1.470.37 |
| 69 265 | 0.19 | 4.6270.018 | 0.920.10 | 2.470.39 | 1.370.18 | 0.880.41 | 0.180.11 | 1.040.54 |
| 69 270 | 0.19 | 4.6510.011 | 1.120.09 | 2.260.37 | 1.530.21 | 2.660.45 | 0.740.15 | 2.120.49 |
| 69 279 | 0.21 | 4.6030.016 | 0.840.06 | 2.730.37 | 1.360.16 | 1.330.42 | 0.170.10 | 1.880.65 |
| 69 280 | 0.18 | 4.6180.016 | 0.740.06 | 0.510.49 | 0.960.14 | 1.150.41 | 0.640.15 | 2.100.82 |
| 70 116 | 0.19 | 4.6370.024 | 1.420.10 | 1.220.45 | 1.090.15 | 3.130.41 | 0.540.13 | 1.550.30 |
| AveragebbUncertainties in the averages quoted as the standard deviation of the sample mean for the respective samples, eg. . | 0.19 | 4.6260.010 | 1.050.07 | 2.160.36 | 1.310.08 | 1.920.23 | 0.420.08 | 1.720.14 |
| Milky Way averageccFrom the Galactic data of FM. Errors are the standard deviation of the sample mean. | ||||||||
| – | 4.5960.002 | 0.960.01 | 0.120.11 | 0.630.04 | 3.260.11 | 0.410.02 | 3.490.07 | |
![[Uncaptioned image]](/html/astro-ph/9811036/assets/x2.png)
![[Uncaptioned image]](/html/astro-ph/9811036/assets/x3.png)
![[Uncaptioned image]](/html/astro-ph/9811036/assets/x4.png)
![[Uncaptioned image]](/html/astro-ph/9811036/assets/x5.png)
![[Uncaptioned image]](/html/astro-ph/9811036/assets/x6.png)
![[Uncaptioned image]](/html/astro-ph/9811036/assets/x7.png)
![[Uncaptioned image]](/html/astro-ph/9811036/assets/x8.png)
![[Uncaptioned image]](/html/astro-ph/9811036/assets/x9.png)
![[Uncaptioned image]](/html/astro-ph/9811036/assets/x10.png)
![[Uncaptioned image]](/html/astro-ph/9811036/assets/x11.png)
![[Uncaptioned image]](/html/astro-ph/9811036/assets/x12.png)
![[Uncaptioned image]](/html/astro-ph/9811036/assets/x13.png)
![[Uncaptioned image]](/html/astro-ph/9811036/assets/x14.png)
![[Uncaptioned image]](/html/astro-ph/9811036/assets/x15.png)
![[Uncaptioned image]](/html/astro-ph/9811036/assets/x16.png)
![[Uncaptioned image]](/html/astro-ph/9811036/assets/x17.png)


We determined values for all of the reddened stars in our sample which had R, I, J, H, and/or K observations. Eleven reddened stars had measurements in at least three of these bands (Morgan & Nandy 1982; Clayton & Martin 1985). Intrinsic colors were taken from Johnson (1966) and Winkler (1997) assuming the reddened stars’ UV spectral types. The values were determined by assuming all extinction laws take the form of Rieke & Lebofsky (1985) (CCM). The uncertainties were calculated from the range of values which were 67% probable using the reduced statistic (Taylor 1982). The values and uncertainties are give in Table 4. We do not include 69 256 in Table 4 or any of the subsequent analysis using measured values as it value of is very uncertain (1.551.18).
| SK | RV | |
|---|---|---|
| 66 19 | 2.46 | 0.25 |
| 67 2 | 2.31 | 0.44 |
| 69 108 | 2.61 | 0.15 |
| 70 116 | 3.31 | 0.20 |
| 68 140 | 2.76 | 0.35 |
| 69 213 | 2.16 | 0.30 |
| 69 228 | 2.23 | 0.74 |
| 69 270 | 2.71 | 0.11 |
| 69 279 | 2.43 | 0.31 |
| 69 280 | 2.56 | 0.39 |
3 Discussion
3.1 Average Curves
3.1.1 30 Dor/Non–30 Dor
A very important result from previous work on the LMC was the apparent difference between UV extinction properties in the 30 Dor region and other sightlines in the LMC (Clayton & Martin 1985; F85, F86). Reddened stars were assigned to the non–30 Dor (, 7 objects) and 30 Dor (, 12 objects) samples based on their projected distance from R 136 as in previous studies. We have calculated average extinction curves for our new 30 Dor and non–30 Dor samples, weighting the individual curves by their uncertainties. The FM parameters of the average curves were calculated as the sample mean and the uncertainties for the average FM parameters are the standard deviation of the mean for the respective samples, eg. . Formal FM fits to the average curves yielded identical parameters within the uncertainties. In Figure 3, the new average extinction curves for 30 Dor and non–30 Dor are shown with the results of F86 plotted for comparison. The extinction curves of F85 and F86 are virtually the same but their uncertainty estimates are quite different. At 7.0 , the difference between the Fitzpatrick 30 Dor and non–30 Dor curves is 1.86 0.41 (F85). In F86, the uncertainties are estimated to be about twice as large making the difference about 2. Our results are similar to F86 but the 30 Dor curve is slightly lower and the non–30 Dor curve slightly higher in our averages. We find the difference between the average curves at 7.0 to be 0.89 0.53. So the significance of differences in far–UV extinction between the 30 Dor and non–30 Dor samples is less, being only slightly greater than 1.5. The difference in bump strength between our 30 Dor and non–30 Dor samples is slightly more significant. Our average non–30 Dor bump strength ( = 2.970.30) is slightly larger than that of F86 (). This is not unexpected as we have included two new lines of sight with strong bumps in our non–30 Dor average. In addition, the improvements realized by using IUE spectra reduced with NEWSIPS are most apparent near the bump. Our average 30 Dor bump strength () is only slightly larger than that found by F86 (). The difference in bump strength between our 30 Dor and non–30 Dor samples is , slightly greater than .

3.1.2 LMC 2/LMC–general
However, the conclusion drawn by F86 that there are significant intrinsic variations between extinction curves within each of the 30 Dor and non–30 Dor samples is strengthened by the additional lines of sight included in this study. In the non–30 Dor sample, for instance, SK 68 23 has a strong bump and SK 70 116 has almost no bump. Similar differences are seen in the 30 Dor sample. To try and isolate a sample of sightlines with weak bumps, we have plotted bump strength versus (BV) in Figure 4. We discovered that there is a group of stars with similar reddenings (0.17 0.21) and bump strengths that also lie close together in the LMC. These stars lie in or near the region occupied by the supergiant shell LMC 2 on the southeast side of 30 Dor (Meaburn 1980; see Figure 1). This structure, which is 475 pc in radius, was formed by the combined stellar winds and supernovae explosions from the stellar association within (Caulet & Newell 1996). There are nine stars in the LMC 2 group, eight of which are from the 30 Dor sample and one (SK 70 116) from the non–30 Dor sample. Four 30 Dor stars (SK 68 129, 69 206, 69 210 and 69 213) are removed from our new LMC 2 sample. These four stars lie in or near a prominent dust lane separating the 30 Dor star formation region from the LH 89 and NGC 2042 stellar associations; SK 69 206 is on the south–eastern edge of the dust lane near the stellar association LH 90 while SK 69 210 is in the middle of the dust lane, coincident with CO clouds 7 & 8 of Johansson et. al. (1998). While located in the traditional 30 Dor region, these sightlines have strong bumps, typical of the non–30 Dor dust.

An average extinction curve has been calculated for the LMC 2 stars and also for the remaining ten stars which we will call LMC–general. FM parameters and their respective uncertainties were calculated as above and are reported in Table 3. The parameters for the average Galactic curve as derived from FM are also shown for comparison. The average curves for LMC 2 and LMC–general samples are plotted in Figure 5. These two curves show a very significant difference in bump strength ( = 1.41 0.21) but the far–UV curves lie within one sigma of each other. It is worth noting that the average Galactic bump strength is very similar to that of the LMC–general sample. In Figure 6 we have over–plotted individual curves within each sample. The dispersion about the mean bump strength is significantly less for both the LMC–general sample compared to the non–30 Dor sample (0.50 and 0.78, respectively; Figure 6a) and for the LMC 2 sample compared to the 30 Dor sample (0.43 and 0.72 respectively; Figure 6b).


3.2 Variations Within the Samples
The form of the UV extinction, as parameterized by FM, along a given line of sight is potentially a powerful diagnostic of the dust grains responsible for the extinction but the physical interpretation of variations and correlations among the FM parameters is unclear. However, to the degree that they represent underlying physical processes it is useful to examine them within our two LMC samples. The coefficients of the linear component of the UV extinction () are not independent in the Galaxy (Fitzpatrick & Massa 1988) but are in fact themselves linearly related. Fitzpatrick & Massa (1988) interpret the relationship as either a single grain population modified by evolutionary processes or a varying mixture of several grain populations with different UV extinction slopes or a combination of both factors. While and have similar values between the two LMC samples, both LMC samples exhibit systematically smaller values of and systematically larger values of relative to the Galaxy. In the SMC, the values of and are even more extreme than in the LMC (GC). However, the values of and for all these galaxies follow the same linear relationship (see Figure 7a). Hence, whatever underlying physical processes or dust components are responsible for the variations in the linear part of the UV extinction must operate similarly in the Galaxy, the LMC and the SMC. Fitzpatrick & Massa (1988) suggested a possible correlation between the FM parameters , which measures the far UV curvature, and , the bump width. In Figure 7b we plot against for the Galaxy, the LMC, and the SMC. Only one SMC sightline (AzV 456) is included since the remaining three sightlines have no bump and is undefined (GC). There is no correlation between these parameters in the LMC extinction data. The physical significance of is unclear; the far UV extinction is a combination of the linear term and the polynomial term and the separation is mathematical rather than physical (CCM). However, such a correlation may arise if and are due to different grain populations provided that the different populations respond to environmental factors in a similar way (Fitzpatrick & Massa 1988). This is consistent with the conclusion of CCM that the processes producing changes in extinction must be efficient over a range of particle sizes and compositions. In this case, the absence of correlation in the LMC would suggest that environmental processes are affecting the different grain populations differently.


The FM parameters , , , and depend on and so interpreting relations among them in the absence of information is difficult. CCM found that the general shapes of the UV extinction curves in the Galaxy, expressed as , are well represented by a one parameter family of curves characterized by the value of . It is of interest to determine whether the UV extinction in the LMC follows the relation of CCM and whether the deviations from CCM in the LMC can be related to deviations seen in the Galaxy We will discuss the FM bump parameters ( and ) separately in §3.2.2.
3.2.1 CCM and the LMC
There is an average Galactic extinction relation, , over the wavelength range 0.125 to 3.5 , which is applicable to a wide range of interstellar dust environments, including lines of sight through diffuse dust, dark cloud dust, as well as that associated with star formation (CCM; Cardelli & Clayton 1991; Mathis & Cardelli 1992). The existence of this relation, valid over a large wavelength interval, suggests that the environmental processes which modify the grains are efficient and affect all grains. The CCM relation depends on only one parameter , which is a crude measure of the size distribution of interstellar dust. Only eleven LMC sightlines in our sample have measured values of . Seven of these are in the LMC 2 sample. The CCM curves for these eleven stars are plotted in Figure 2. The LMC 2 curves cannot be fit by a CCM curve with any value of because of their weak bumps. The average LMC–general curve is very similar to a Galactic CCM extinction curve with . However, only four stars in this sample have measured values so it is not clear how well their extinction curves follow CCM. SK 67 2 and 69 213 have stronger FUV extinctions than their respective CCM curves while SK 66 19 appears too weak in the bump. Only SK 69 108 clearly follows the CCM relationship. In Figures 8 and 9 we plot bump strength and versus for ten stars with measured ’s; SK 69 256 is excluded due to its very uncertain value. Figure 8 shows that bump strength is consistent with CCM for the LMC–general sample while the LMC 2 sample has bumps which fall below the typical CCM values. Very little can be said about the relationship with in the far UV as seen in Figure 9. The uncertainties are quite large and though both the LMC 2 and LMC–general sample appear to be consistent with CCM in the UV, they are also consistent with no dependence. More accurate values of along more sightlines must be obtained before it can be determined whether a CCM–like relationship may hold in the LMC. According to CCM, and therefore are proportional to (Mathis & Cardelli 1992). However, since (LMC–general)/(LMC 2) = 2.25, that would imply that the average value of should be more than twice as large in the LMC–general sample if a CCM–like relationship exists. There is no indication from the available data that this is true. In fact, the sightlines in both samples appear to have low values of relative to the Galaxy (Table 4). This may indicate that dust grains in the LMC may be systematically smaller than in the Galaxy.


Although the general shape of the UV extinction in the Galaxy is well represented by the parameterization of CCM, significant deviations are seen, both in the far UV and the bump (Cardelli & Clayton 1991; Mathis & Cardelli 1992; Fitzpatrick 1998). There are well known Galactic sightlines which deviate from CCM in much the same way that the LMC 2 sample does. Three deviant Galactic stars are plotted in Figures 8 and 9 for comparison. HD 29647, 62542, and 210121 all show weak bumps and strong far–UV extinction for their measured values of RV (3.62, 3.24 & 2.1, respectively; Messinger et. al 1997; Whittet et. al. 1993; Larson et. al. 1996). The bumps seen for HD 29647 and 62542 are not just weak but they are very broad and shifted to the blue (Cardelli & Savage 1988). The unusual extinction curve characteristics along these lines of sight have been attributed to their dust environments which are quite diverse. The dust toward HD 62542 has been swept up by bubbles blown by two nearby O stars and has been subject to shocks while the HD 29647 sightline passes through a very dense, quiescent environment (Cardelli & Savage 1988). HD 210121 lies behind a single cloud in the halo. There is no present activity near this cloud although it was ejected into the halo at some time in the past (Welty & Fowler 1992; Larson et. al. 1996). These deviations from CCM in the Galaxy indicate that something other than the size distribution of dust grains as measured by must be important in determining extinction properties along a given line of sight. Evidently, the same is true in the LMC. Even though all the LMC sightlines have similar, low values of , they exhibit a variety of extinction curves.
3.2.2 The Bump
While the physical significance of the linear and far UV functions in the FM parameterization is unclear, the Drude profile fitting function for the 2175 Å absorption bump which is part of the FM parameterization does have some physical significance as the expression of the absorption cross section of a damped harmonic oscillator (CCM; FM; Mathis & Cardelli 1992). Further, neither or depend on and so variations in these parameters are directly tied to variations in the grains responsible for the bump feature.
There is no evidence for a systematic shift in the central position of the bump in either LMC sample. The weakness of the bump in the LMC 2 sample means that and are not strongly constrained in that sample. In the LMC–general sample, there are no systematic redward shifts of the bump but three sightlines are significantly shifted to the blue. The range of variation in the LMC is consistent with that seen in the Galactic sample. Several Galactic lines of sight, eg. HD 62542 and HD 29647 have bumps that are significantly shifted to shorter wavelengths ( and 4.70, respectively; Cardelli & Savage 1992). Several possibilities have been suggested to account for this including mantling of the grains and hydrogenation (Cardelli & Savage 1992; Mathis 1994).
As in the Galaxy, there is real variation in the width of the bump between various lines of sight in the LMC (Table 3). Five lines of sight in our sample have bump widths which nominally fall below the narrowest Galactic bump (, FM). Of these five sightlines two (SK 69 213 and SK 69 280) are affected by spectral mismatches in the bump region. The true bump widths for these two sightlines are not well constrained by the FM fitting procedure. The remaining three narrow bump sightlines (SK 68 129, SK 69 206, SK 69 210), all in the LMC–general sample, interestingly all fall in or near the dust lane on the northwest edge of 30 Dor. The bumps are well defined and the narrowness of the bump is real. An expanded view of the SK 69 210 profile can be seen Figure 10. There is a strong relationship between environment and in the Galaxy. The narrowest bumps are associated with bright nebulosity while wide bumps are associated with dark, dense clouds (Cardelli & Clayton 1991, Mathis 1994). Therefore, it has been suggested that mantles form on the bump grains in dark clouds resulting in broad bumps. In bright nebulae, there are no mantles and narrower bumps result from the bare grains. In this scenario, mantles are able to form in dense clouds shielded from the interstellar radiation field while the mantles on grains near H II regions are removed by the stronger radiation field. However, the three small lines of sight in the LMC appear to be associated with a dense environment even though they are near the 30 Dor star forming region. Several stars in the LMC–general sample (eg. SK 66 19 and SK 66 88) are associated with bright H II regions and yet have normal Galactic bump widths. Accepting the explanation for the narrow bumps based on the Galactic data, we would expect to find narrow bumps in the LMC 2 sample. In contrast with this expectation, the data presented in Table 3 indicates that the LMC 2 bump widths are comfortably within the average Galactic range. It doesn’t appear that the trend in with environment seen the Galaxy holds in the LMC. There are no exceptionally wide bumps in our sample save SK 70 116 with ; however, the bump is extremely weak and is not strongly constrained.

The weak bumps in the LMC 2 region are not unique. As discussed above, several Galactic lines of sight also have extinction curves with very weak bumps (HD 29647, HD 62542, HD 210121). However, the LMC 2 environment seems to have little in common with these Galactic lines of sight which in turn seem to have little in common with each other. Though the swept up, shocked environment near HD 62542 may be similar to the LMC 2 environment (but on a vastly reduced scale), the other two Galactic sightlines sample relatively quiescent environments. HD 210121 lies behind a single diffuse, translucent cloud about 150 pc from the Galactic plane. The interstellar radiation field is weaker than in the general interstellar medium and shocks do not appear to be important (Welty & Fowler 1992). Larson et. al. (1996) suggest that the apparent preponderance of small grains along the HD 210121 line of sight is due to lack of grain growth through coagulation as a result of lack of time spent in a dense environment. It appears that very diverse environmental conditions result in rather similar bump profiles. It is not known whether the bump grains are being modified in a similar fashion in different environments or substantially different modifications of the bump grains can result in a similar UV extinction in the bump.
4 Conclusions
Evidently the relationship between the UV extinction, dust grain properties, and environment is a complicated one. Similar variations in the form of the UV extinction can arise in a variety of environments. The environmental dependences seen in the Galaxy do not seem to hold in the LMC. Since large variations in UV extinction are seen within both the LMC and the Galaxy, global parameters such as metallicity cannot be directly responsible for the observed variations from galaxy to galaxy as has been suggested (e.g., Clayton & Martin 1985). However, one effect of decreased metallicity in the LMC is that the typical molecular cloud is bigger but more diffuse than those in the Galaxy (Pak et. al. 1998). Hence, dust grains in the LMC may not spend as much time in dense, shielded environments as grains in the Galaxy. The lack of time in dense environments may contribute to the apparent small size of the LMC grains as indicated by the low values of measured in this study. In addition, the weak and narrow bump lines of sight in the LMC all lie near the 30 Dor star forming region which has no analog in the Galaxy. The dust along these sightlines has probably been affected by the proximity to the harsh environment of the copious star formation associated with 30 Dor. However, it must be pointed out that the most extreme UV extinction curves, having virtually no bumps and a very steep far UV are found in the SMC. The SMC dust lies near regions of star formation but they are very modest compared to 30 Dor. These SMC sightlines have optical depths similar to those in LMC 2 (GC). Due to very low metallicity of of the SMC, its molecular clouds are very diffuse (Pak et. al. 1998). One might expect that values of in the SMC be even smaller than in the LMC; the current observations, however, show no evidence for this (GC).
Even with the improved and expanded samples of extinction in the LMC and SMC, the link between particular environments and dust characteristics is still unclear. The combination of the Galactic and Magellanic cloud data show that the extinction curve/environment links are not as simple as previously proposed. But the different times spent by grains in dense molecular environments may be a significant factor as suggested for the Galactic star HD 210121 (Larson et. al. 1996). The processing history of dust grains (ie. coagulation and mantling in dense clouds environments and exposure to strong shocks and radiation field outside of clouds) is probably quite different in these three galaxies owing to the different molecular cloud environments and the varying intensity of star formation. The interplay between at least these two factors likely plays an important role in determining the form the UV extinction. The fact that starburst galaxies appear to have SMC–type dust regardless of metallicity (Calzetti et. al. 1994; Gordon et. al. 1997) implies that the star formation history of a galaxy plays an important role in determining the extinction properties. However, the complicated relationship between extinction properties in the UV and environment implied by the Galactic and Magellanic Cloud data suggests that great care must be taken in assuming the form of the UV extinction in external galaxies.
References
- (1) Calzetti, D., Kinney, A. L. & Storchi–Bergmann, T. 1994, ApJ, 429, 582.
- (2) Cardelli, J. A. & Savage, B. D. 1988, ApJ, 325, 864.
- (3) Cardelli, J. A., Clayton, G. C. & Mathis, J. S. 1989, ApJ, 345, 245 (CCM).
- (4) Cardelli, J. A. & Clayton, G. C. 1991, AJ, 101, 1021.
- (5) Caulet, A. & Newell, R. 1996, ApJ, 465, 205.
- (6) Clayton, G. C. & Martin, P. G. 1985, ApJ, 288, 558.
- (7) Clayton, G. C. et. al. 1996, ApJ, 460, 313.
- (8) Fitzpatrick, E. L. 1985, ApJ, 299, 219 (F85).
- (9) Fitzpatrick, E. L. 1986, AJ, 92, 1068 (F86).
- (10) Fitzpatrick, E. L. 1988, ApJ, 335, 703.
- (11) Fitzpatrick, E. L. 1998, in ‘UV Astrophysics Beyond the IUE Final Archive’, eds, W. Wamsteker & R. Gonzalez Riestra. (Noordwijk: ESA Publications Division), p.461.
- (12) Fitzpatrick, E. L. & Massa, D. 1988, ApJ328, 734.
- (13) Fitzpatrick, E. L. & Massa, D. 1990, ApJS, 72, 163 (FM).
- (14) Gordon, K. D., Calzetti, D. & Witt, A. N. 1997, ApJ, 487, 652.
- (15) Gordon, K. D. & Clayton, G. C. 1998, ApJ, 500, 816 (GC).
- (16) Johansson, L. E. B. et. al. 1998, A&A, 331, 857.
- (17) Johnson, H. L. 1966 ARA&A, 4, 193.
- (18) Koornneef, J. & Code, A. D. 1981, ApJ, 247, 860.
- (19) Larson, K. A., Whittet, D. C. B. & Hough, J. H. 1996, ApJ, 472, 755.
- (20) Massa, D., Savage, B. D. & Fitzpatrick, E. L. 1983, ApJ, 266, 662.
- (21) Mathis, J. S. 1994, ApJ, 422, 176.
- (22) Mathis, J. S. & Cardelli, J. A. 1992, ApJ, 398, 610.
- (23) Meaburn, J. 1980, MNRAS, 192, 365.
- (24) Messinger, D. W., Whittet, D. C. B. & Roberge, W. G. 1997, ApJ, 487, 314.
- (25) Morgan, D. H. & Nandy, K. 1982, MNRAS, 199, 979.
- (26) Nandy, K., Morgan, D. H., Willis, A. J., Wilson, R. & Gondhalekar, P. M.1981, MNRAS, 1 96, 955.
- (27) Neubig, M. M. S. & Bruhweiler, F. C. 1998, AJ, submitted.
- (28) Pak, S., Jaffe, D. T., van Dishoeck, E. F., Johansson, L. E. B. & Booth, R. S. 1998, ApJ, 498, 735.
- (29) Oestreicher, M. O., Gochermann, J. & Schmidt–Kaler, T. 1995, A&AS, 112, 495.
- (30) Rieke, G. H. & Lebofsky, M. J. 1985, ApJ, 288, 618.
- (31) Rousseau J.M., Martin N., Prevot L., Rebeirot E., Robin A. & Brunet J.P. 1978, A&AS, 31, 243.
- (32) Schwering, P. B. W. & Israel, F. P. 1991, A&A, 246, 231.
- (33) Welty, D. E. & Fowler, J. R. 1992, ApJ, 393, 193.
- (34) Whittet, D. C. B., Martin, P. G., Fitzpatrick, E. L. & Massa, D. 1993, ApJ, 408, 573.