ASCA Observations of Radio-Loud AGNs
Abstract
We summarize the results of an X-ray spectroscopic survey of radio-loud AGNs observed with ASCA, using proprietary and archival data (public up to 1998 September). We briefly compare our results with those obtained for radio-quiet AGNs studied by other authors, and with the predictions of unified models.
1 Introduction
One of the fundamental open problems of AGN research is the dichotomy between radio-loud and radio-quiet (RL/RQ) AGNs. While in both cases the ultimate source of power is thought to be accretion onto a massive black hole (Antonucci 1993; Urry & Padovani 1995), the two classes exhibit subtle but systematic differences at all observed wavelengths, the most conspicuous being the ability of RL AGNs to form collimated, relativistic jets, in contrast to their RQ counterparts.
The X-ray spectra of AGNs may hold the key to understanding the RL/RQ dichotomy. Since X-rays are produced in the innermost regions of the accretion flow, they allow us a direct view of the central engine where the jets form. Indeed, different models for the formation of jets require different structures for the central engines and thus make different predictions for the production of X-rays, e.g., the spinning black hole model of Blandford & Znajek (1977) combined with the hydromagnetic wind model of Blandford & Payne (1982), or the ion torus or advection-dominated disk of Rees et al. (1982) and Narayan & Yi (1994,1995). It is thus encouraging that previous studies of RL AGNs with the Einstein IPC and EXOSAT found systematic differences, with RL sources being more X-ray-luminous and having flatter X-ray spectra () than RQ ones (Wilkes & Elvis 1987; Lawson et al. 1992; Shastri et al. 1993; Lawson & Turner 1997). However, these studies were plagued by the low sensitivity of the instruments, especially at soft energies where the contribution of diffuse thermal components can be present (Worrall et al. 1994).
We started a systematic study of RL AGNs in the X-ray band using ASCA archival data and new observations. The improved sensitivity and resolution of ASCA allows us to study in great detail the 0.6–10 keV spectra, especially in the region of the Fe K line, disentangling the AGN emission from any thermal contribution. While our principal goal is to compare the X-ray properties of RL and RQ AGNs, we will also test the idea that different RL subclasses differ by orientation only, as postulated by current RL unification scenarios. We report here our preliminary results, referring the reader to Sambruna, Eracleous, & Mushotzky (1999, in prep.) for a complete description of our work and our conclusions.
Our sample contains 37 RL AGNs, including 10 Broad Line Radio Galaxies (BLRGs), 6 RL Quasars (QSRs), 12 Narrow-Line Radio Galaxies (NLRGs), and 10 Radio Galaxies (RGs). The classification was based on the luminosity of the [O iii] emission line, with type-1 BLRGs and QSRs having and erg s-1, respectively, and type-2 NLRGs and RGs having and erg s-1, respectively. The sample is by no means statistically complete, and it probably reflects a bias toward the brightest sources of each type. The detection rate with ASCA is high: 100% BLRGs, 83% NLRGs, 83% QSRs, and 90% RGs were detected by both the SIS and GIS, but the signal-to-noise ratio in the SIS has a wide range of 3–300.
2 Summary of ASCA Results
-
1.
At soft energies, thermal emission is present in 40% of type-2 sources with temperatures and luminosities typical of poor groups or clusters. In two cases the 0.5–4.5 keV intrinsic luminosity of the thermal component is consistent with the predicted luminosity of a starburst.
-
2.
A thermal soft excess is detected in one BLRG below 2 keV, best modelled with a keV bremmsstrahlung component.
-
3.
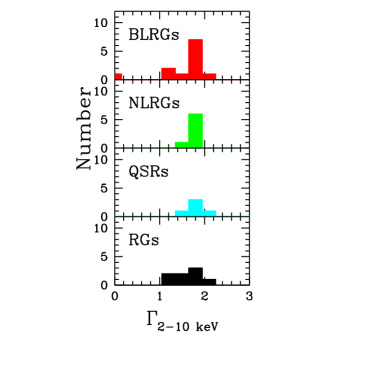
A power law component is detected in 92% of the sources (34/37) at energies above 2 keV, with a narrow distribution of photon indices for the various subclasses (Figure 1). The average photon index is similar, .
-
4.
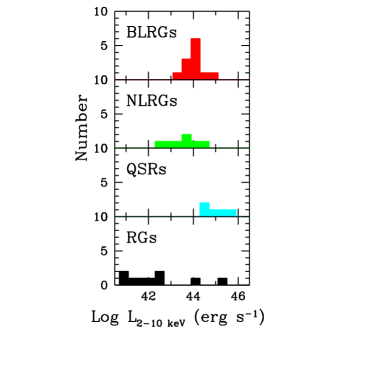
NLRGs and RGs have wide distributions of intrinsic (absorption-corrected) 2–10 keV luminosities, extending more than one order of magnitude below those of BLRGs and QSRs (Figure 1).
-
5.
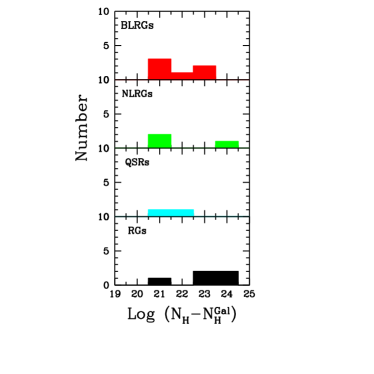
Excess cold absorption over Galactic of the hard power law component is detected in 64% NLRGs and 100% RGs (Figure 1), with cm-2. Interestingly, a few BLRGs and QSRs exhibit similar excess columns as well.
-
6.
Absorption edges between 0.7–1 keV (the trademark of a warm absorber) are detected in only one BLRG, with optical depth .
-
7.
The Fe K line is detected in 50% BLRGs, 33% NLRGs, 20% QSRs, and 22% RGs. In most cases the line is unresolved; in a few BLRGs the line is broad (Gaussian keV).
-
8.
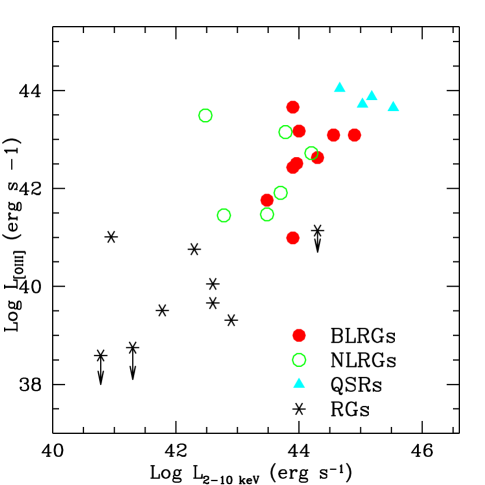
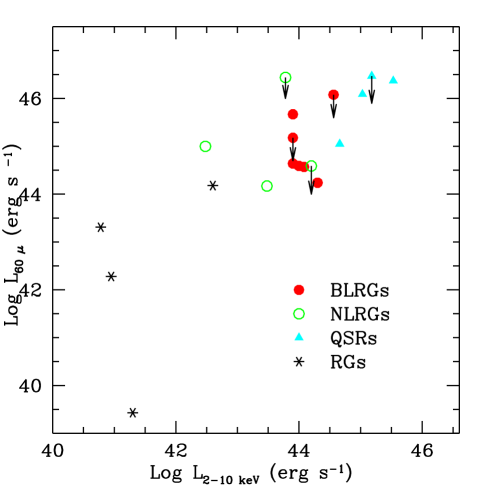
The intrinsic 2–10 keV power law luminosity is strongly correlated with the luminosity of the [O iii] emission line (Figure 2); a partial correlation test (taking into account the non-detections) gives a Kendall correlation probability 99.3% after the redshift dependence is removed. The X-ray luminosity is also weakly correlated with the far-infrared (FIR) luminosity at 60 (Figure 2), 91%. No significant correlation is found from the partial analysis between the 2–10 keV luminosity and the extended radio luminosity at 5 GHz or the ratio of the radio core-to-lobe power.
3 Weak-Line Radio Galaxies
Our sample of RGs includes 5 Weak Line Radio Galaxies (WLRGs), powerful FR II sources which are underluminous in [O iii] emission (by a factor 10) with respect to other radio galaxies with similar radio power. WLRGs are also characterized by a low ionization parameter in their narrow-line regions, as indicated by the [O ii]/[O iii] ratio (Tadhunter et al. 1998). One central question is the cause of such low [O iii] luminosities, which could be a weak, hidden AGN or intrinsically different properties of the line-emitting gas (Tadhunter et al. 1998).
The ASCA spectra of WLRGs can be modeled with a Raymond-Smith plasma ( keV) at soft energies, plus (in 4/5 cases) a power law component above 2 keV with average photon index (dispersion ) and heavy ( cm-2) absorption. The intrinsic (absorption-corrected) 2–10 keV luminosities are in the range erg s-1. Moreover, a narrow unresolved Fe K line is marginally detected ( 95% confidence) in 2 bright WLRGs, with eV. WLRGs fall at the faint end of the diagram of Figure 2. While a non-AGN origin of the ASCA power law component can not be ruled out a priori, the correlation of with is suggestive of a hidden weak AGN in WLRGs (Tadhunter et al. 1998). On the other hand, it is interesting that the [O ii]/[O iii] line ratios of WLRGs are reminiscent of LINERs (e.g., Filippenko 1996), raising the possibility that they could represent the radio-loud counterparts of these objects. Viewed from this perspective, the true nature of WLRGs may not be easy to ascertain; they may constitute a heterogeneous population with starburst activity being responsible for the observed characteristics of some of them. Future X-ray and multiwavelength observations of WLRGs will help clarifying their true nature.
4 Discussion
1. Constraints for unification models. Current unification scenarios for RL AGNs postulate that orientation effects are responsible for their optical classification (e.g., Urry & Padovani 1995). In particular, NLRGs are thought to be observed at large inclination angles relative to their jet axis. Hence their central engines, intrinsically similar to BLRGs/QSRs, would be completely obscured by an opaque torus. Our ASCA results are qualitatively in agreement with the unified models. The continuum slope distributions of the three classes are similar (Figure 1), and the hard power law in NLRGs is absorbed by column densities spanning the large range 1021-23 cm-2. However, it is interesting that the intrinsic 2–10 keV luminosities of RGs are significantly lower (by about an order of magnitude) than those of other types of RL AGNs (Figure 1). This suggests that not all “type-2” AGNs contain luminous quasars in their cores. It is also puzzling that we detect significant cold absorption, in excess of the Galactic value, in a few BLRGs and QSRs, with column densities similar to those found NLRGs, while the line of sight to “type-1” objects should be unobstructed. Interestingly, the BLRGs and QSRs with excess cold absorption are also powerful FIR emitters, suggesting that the high columns detected with ASCA could be associated to dust responsible for re-radiating the power at lower frequencies.
2. Radio-loud vs. radio-quiet AGNs. We compared the distribution of the 2–10 keV photon indices of BLRGs with the distribution of indices for radio-quiet Seyfert 1s studied by Nandra et al. (1997), in a matched range of intrinsic X-ray luminosities (6 objects). A Kolmogorov-Smirnov test shows the two distributions are not demonstrably different, with a probability that they are different of 85%. However, the mean values, () and (), are different at 92% confidence from a Student t-test. Thus, there is only marginal evidence that RL AGNs have flatter hard X-ray slopes than RQ AGNs in the ASCA energy band. Differences in the accretion flows of the two AGN types are also present at higher energies ( 9 keV): our RXTE observations of BLRGs show them to lack the spectroscopic signature of Compton reflection (Eracleous & Sambruna 1999, in prep.; see also Woźniak et al. 1998), that is a hallmark of Seyfert 1s (Nandra et al. 1997), suggesting that the structure of the accretion flow in the two AGN types is different.
The ASCA data provide evidence for different conditions of the gas in the immediate vicinity of the central engine in RL AGNs: while ionized absorption is common in Seyfert 1s (Reynolds 1997), only 1 BLRG in our sample shows evidence for a warm absorber. The observed optical depth implies a column density for the ionized gas cm-2, at the lower end of the distribution for Seyfert 1s of similar X-ray luminosity (George et al. 1998). This implies either that the density of warm gas along the line of sight to the black hole in RL AGNs is lower than in Seyferts, or that the gas distribution is different, e.g., it may be arranged in a flat disk perpendicular to the radio axis, as suggested by Wills & Browne (1986), and many other authors thereafter.
3. Potential contributions of XMM to the study of RL AGNs. Because RL AGNs are fainter in X-rays and intrinsically rarer than their RQ counterparts, they are underepresented so far in existing data archives. The situation is bound to change with XMM. Thanks to the large effective area of EPIC at 6 keV, the Fe K line will be detected and studied in the fainter objects, including WLRGs, allowing us to explore trends with intrinsic luminosity. Moreover, the line profiles of the brighter objects can be studied in detail using modest exposure times, in order to separate broad and narrow components and pin down the line production site. At lower energies, the RGS will be able to detect narrow absorption features, easily missed by ASCA. In addition, the soft excess observed by ASCA and earlier instruments can be resolved into individual lines to limits 10 times lower than those attainable with the AXAF gratings. These spectra will allow us to perform accurate plasma diagnostics as well as study the dynamics of the circumnuclear medium. XMM observations of RL AGNs will mark fundamental progress in our understanding of the structure of their central engines and thus, ultimately, on the nature of the RL/RQ AGN dichotomy.
References
- (1)
- (2) Antonucci, R. 1993, ARAA, 31, 473
- (3)
- (4) Blandford, R. D. & Payne, D. 1982, MNRAS, 199, 883
- (5)
- (6) Blandford, R. D., & Znajek, R. L. 1977, MNRAS, 179, 433
- (7)
- (8) Filippenko, A. V. 1996, in “The Physics of LINERs in View of Recent Observations”, eds. M. Eracleous et al., ASP Conf. Series 103, (San Francisco: ASP), 17
- (9)
- (10) George, I.M. et al. 1998, ApJS, 114, 73
- (11)
- (12) Lawson, A. et al. 1992, MNRAS, 259, 743
- (13)
- (14) Lawson, A., & Turner, M. J. L. 1997, MNRAS, 288, 920
- (15)
- (16) Nandra, K. et al. 1997, ApJ, 477, 602
- (17)
- (18) Narayan, R. & Yi, I. 1994, ApJ, 428, L13
- (19)
- (20) Narayan, R. & Yi, I. 1995, ApJ, 444, 231
- (21)
- (22) Rees, M. J. et al. 1982, Nature, 295, 17
- (23)
- (24) Reynolds, C. S. 1997, MNRAS, 286, 513
- (25)
- (26) Shastri, P., Wilkes, B. J., Elvis, M., & McDowell, J. 1993, ApJ, 410, 29
- (27)
- (28) Tadhunter, C. N. et al. 1998, MNRAS, 298, 1035
- (29)
- (30) Urry, C. M. & Padovani, P. 1995, PASP, 107, 803
- (31)
- (32) Wilkes, B. J. & Elvis, M. 1987, ApJ, 323, 293
- (33)
- (34) Wills, B. J. & Browne, I. W. A. 1986, ApJ, 302, 56
- (35)
- (36) Worrall, D. M. et al. 1994, ApJ, 420, 17
- (37)
- (38) Woźniak, P. et al. 1998, MNRAS, 299, 449
- (39)