The ESO Nearby Abell Cluster Survey:
Kinematics of Galaxies in Clusters
Abstract
We summarize several results based on the velocity data-set for cluster galaxies provided by ENACS (the ESO Nearby Abell Cluster Survey). A more general description of ENACS is given in the companion review by Katgert et al., in this volume.
We describe the distribution of velocity dispersions of a complete sample of rich galaxy clusters, and compare it to the distribution of cluster X-ray temperatures, and with predictions of theoretical models.
We then address the issue of the existence of a Fundamental Plane (FP) for rich clusters, first suggested by Schaeffer et al. We confirm the existence of this FP with the ENACS data-set. The cluster FP is different from the FP of elliptical galaxies, and from the virial prediction. Some implications of the cluster FP are discussed.
Finally, we describe the phase-space distributions of different populations of cluster galaxies. Different galaxy classes are defined according to their morphological or spectral type, and the presence of emission-lines. Star-forming (late-type) galaxies have a velocity dispersion profile that (in combination with their wider spatial distribution) is suggestive of first infall into the cluster. On the contrary, quiescent (early-type) galaxies show evidence of a dynamically relaxed distribution.
keywords:
galaxy clusters, cosmology1 Introduction
The ESO Nearby Abell Cluster Survey (ENACS, see Katgert et al. 1996, 1998) is currently the largest homogeneous dataset of redshifts for galaxies in clusters. At its completion, in 1994, it almost doubled the number of available redshifts for cluster galaxies. The survey was designed in such a way as to provide (in combination with the literature) a complete, volume-limited sample of rich Abell clusters, with robust estimates of their kinematical parameters, such as, in particular, the velocity dispersion. Previous to ENACS, most results on the cluster properties, in particular on those concerning the kinematics, were based either on a few clusters only (e.g. Colless & Hewett 1987, Dressler & Shectman 1988), or on heterogeneous collections of cluster data from many sources (e.g. Girardi et al. 1993). ENACS has allowed for the first time to analyse the kinematics of a large homogeneous cluster data-set, where possible biases and selection effects were well under control.
In this review, we summarize the main results obtained so far with the ENACS data-set, on the kinematical properties of clusters. In § 2 we present the distribution of velocity dispersions of a complete volume-limited cluster sample (Mazure et al. 1996). In § 3 we describe the existence and characteristics of the Fundamental Plane of galaxy clusters in the luminosity, radius, velocity dispersion space (Adami et al. 1998a). Finally, in § 4 we deal with the phase-space distributions of different populations of cluster galaxies (Biviano et al. 1997, Adami et al. 1998b, de Theije & Katgert 1998).
We refer the reader to the companion review of Katgert et al. (these proceedings) for a thorough description of the ENACS data-set, and for a review of those results which are not based on the velocity data-set.
2 The Distribution of Cluster Velocity Dispersions
The distribution of cluster masses can be used to constrain theories of cluster formation and evolution (see, e.g., Bahcall & Cen 1992). Since mass estimates for clusters are difficult to obtain, and often require a-priori assumptions on the dynamical state of the clusters (see, e.g., Biviano et al. 1993), mass gauges, such as the velocity dispersion and the intra-cluster gas temperature, have often been used instead. Before ENACS, there have been several attempts to derive the distribution of cluster velocity dispersions (’s), but these were based either on heterogeneous data-sets (Frenk et al. 1990, Girardi et al. 1993), or on homogeneous but small data-sets (Zabludoff et al. 1993).
2.1 Completeness of The Sample, and The Density of Rich Clusters
By combining the ENACS data-set with 1000 redshifts for 37 clusters drawn from the literature, we built a volume-limited sample of 128 Abell clusters with richness , in a 2.55 sr cone, within a redshift limit . The data-set is overall very homogeneous, since most of the data come from ENACS. For 80 of the 128 clusters in the complete sample, we obtained a reliable estimate of the , based on at least 10 (but very often between 30 and 150) redshifts for cluster members.
A critical point we addressed in our analysis is that of completeness. Since our sample is selected from the catalogues of Abell (1958) and Abell et al. (1989), we had to apply a correction for the incompleteness of these catalogues. For this purpose, we used the Edinburgh-Durham Cluster Catalogue (Lumsden et al. 1992) as a comparison sample. The resulting corrected space density of richness clusters is:
slightly higher than most previous estimates, but significantly lower than that obtained by Scaramella et al. (1991). This density estimate has recently been used by Carlberg et al. (1997) to constrain the redshift evolution of galaxy cluster densities.
2.2 The -distribution
Completeness to a given overdensity implies completeness to a given , through the relation between ’s and richness counts. However, the large spread in this relation implies that a sample complete to a given richness is biased against low- clusters. As a consequence, our sample, complete for richness , is only complete for km/s.
As an alternative of using 2D richness counts, we also estimated 3D richnesses, which we obtained from the total galaxy counts, corrected for the fraction of background and foreground galaxies, as estimated from ENACS. The final distributions we obtained for the 2D-richness complete sample and the 3D one, were consistent. This can be seen in Figure 1, where the two distributions are plotted. Note that the 3D-richness sample is only complete down to km/s, slightly higher than the completeness limit of the 2D-richness complete sample.
Velocity dispersions were computed by applying the interloper removal procedure of den Hartog & Katgert (1996). In Figure 1 we show for comparison the distribution one would obtain by estimating without interloper removal (dotted line). The removal of interlopers is clearly essential in properly estimating the -distribution.

Our distribution is in good agreement with the distribution obtained by Zabludoff et al. (1993) only for km/s, but for larger values of they obtained a significantly flatter slope, possibly due to an incorrect removal of interlopers (see Figure 2). The distribution of Girardi et al. (1993), on the other hand, is systematically higher all along the range.

Using the relation , we found an excellent agreement between our distribution and the distribution of cluster X-ray temperatures () of Henry & Arnaud (1991). Note that the other distribution, that of Edge et al. (1990), had a wrong normalisation, according to Ebeling et al. (1997). The good agreement found for a value , suggests that and are both valid measures of the cluster gravitational potential.
Finally we used our distribution of ’s to constrain the standard Cold Dark Matter models of Frenk et al. (1990) and of van Kampen (1994). Even if there is not a perfect agreement between these models , in general the comparison of both models with the observed distribution indicates that a large bias parameter, , is required. For the commonly accepted low values of the bias parameter, the standard CDM model clearly overpredicts the number of high- clusters. The observed relative proportions of high- and low- clusters is also poorly reproduced in the models.
3 The Fundamental Plane of clusters of galaxies
It is well known that elliptical galaxies populate a fundamental plane (FP, hereafter) in the (radius, internal velocity dispersion, luminosity)-space (e.g. Dressler et al. 1987). Here we are interested in the existence of a FP for clusters of galaxies. The existence of a galaxy cluster FP was claimed by Schaeffer et al. (1993). Their claim was based on a heterogeneous data-set of 16 galaxy clusters, so we deemed it interesting to re-address this issue by using a larger and more homogenous data-set.
3.1 The Sample; Luminosities, Radii and Velocity Dispersions
We selected 29 ENACS clusters, each with at least 10 galaxy redshifts, for which magnitudes and positions from the Cosmos catalogue (Heydon-Dumbleton et al. 1989, and MacGillivray, private communication) were available to us. The Cosmos data were used to determine the characteristic scales, , and luminosities, , of the clusters, while the ENACS data provided the -estimates.
Four different kinds of number density profiles were fitted to the Cosmos data in order to derive , i.e.: King, Hubble, de Vaucouleurs, and a 2D analogue of the profile of Navarro et al. (see Adami et al. 1998a and references therein). Best fits were obtained for the King and Hubble profiles (Adami et al. 1998c; Katgert et al., these proceedings).
Luminosities were determined from the Cosmos galaxy magnitudes, which were K-corrected, corrected for the galactic absorption, and transformed to absolute magnitudes. The total luminosity of all Cosmos galaxies in a given cluster field was then corrected for the contribution of non-members, as estimated on the basis of the available (ENACS) redshifts. Extrapolation beyond the completeness magnitude of the Cosmos catalogue, was done using a Schechter (1976) luminosity function. In a few cases, bright ENACS galaxies were found with no Cosmos counterpart; we added the luminosities of these bright galaxies to the total cluster luminosity.
The cluster ’s were computed from the ENACS data, using the biweight estimator (Beers et al. 1990), and the interloper removal procedure of den Hartog & Katgert (1996).
Finally, we defined and evaluated the ’contrast’ parameter, defined as the overdensity of the galaxy number counts in the cluster region, relative to the local background.
3.2 The FP
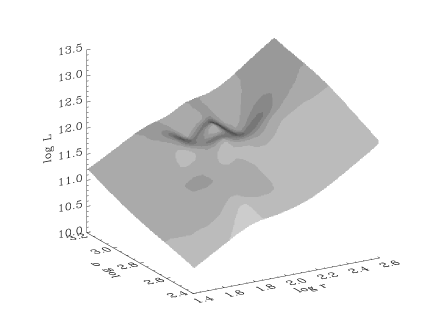
We looked whether the , and parameters are related in our cluster sample. No relation was found between and . On the other hand, and are correlated, as well as and . The three quantities (, , ) are linked together in the relation
which is the FP of galaxy clusters. An edge-on view of this FP is shown in Figure 3; a 3D representation of the same FP is given in Figure 4. It is remarkable that the galaxy density profile is best represented by a King model, and also the relation among , and has the lowest scatter when is taken to be the King core-radius. In this case, and .
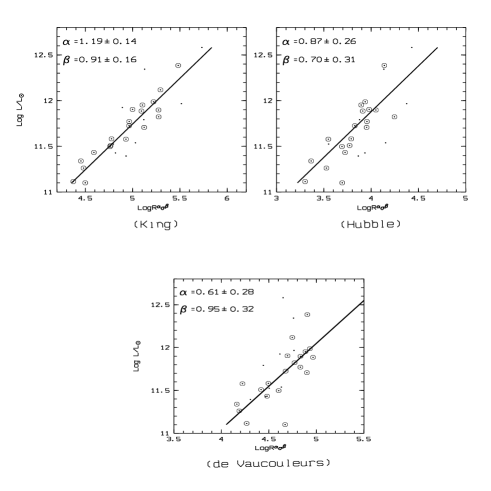
The comparison of our FP with that derived by Schaeffer et al. is not straightforward. Our best-fit FP was obtained using the King core-radius, while they had to rely on the de Vaucouleurs effective radii which were obtained by West, Oemler & Dekel (1989). Had we adopted the de Vaucouleurs effective radii as they did, the difference between our FP and theirs, would decrease. Given the uncertainties, Schaeffer et al.’s FP and ours, are consistent.
The FP of our sample of clusters, is significantly different from the FP of elliptical galaxies, mainly because of the flatter relation between and ( for clusters, and for ellipticals, see, e.g., Pahre et al. 1995). This is not surprising, given the different physical nature of clusters and ellipticals. Therefore, we do not agree with Schaeffer et al.’s claim of a unique FP for globular clusters, galaxies and rich clusters.
Our FP also differs from the virial expectation for a constant mass-to-light ratio. It does not allow a simple power-law relation between cluster mass and cluster light, either. The deviation from the virial relation could either indicate a (roughly) linear increase of with , or that clusters are not in virial equilibrium. However, if clusters are not dynamically relaxed systems, it is far from clear why they define a FP at all. An increase of with , and therefore with the cluster mass, has profound implications on the determination of the cluster mass function, and on the generalisation of results obtained from gravitational lensing, which generally concern the most massive clusters only.
A significant part of the scatter around the FP is intrinsic. Part of it may be due to the incomplete virialization of some of our clusters, as evidenced by the fact that the lower-contrast and less regular clusters are poor tracers of the FP. Part of the scatter may come from distance errors induced by peculiar velocities. Assuming that all the intrinsic scatter in the FP is due to deviations from the pure Hubble flow, we found an upper limit of km/s to the peculiar velocities of our clusters (in agreement with independent estimates by, e.g., Bahcall & Oh 1996).
4 The phase-space distributions of cluster galaxies
Cluster galaxies occupy different positions in the phase-space according to their morphologies and luminosities. Early-type galaxies are located in denser environments and have smaller velocity dispersion than late-types (Dressler 1980a, Whitmore & Gilmore 1991, Stein 1997, and references therein). The most luminous cluster galaxies are found in the cluster cores, and have a lower (Biviano et al. 1992, and references therein).
Here we summarize recent results we have obtained on these topics, using the ENACS data-base in combination with data from the literature. Different cluster galaxy populations have been chosen according to their spectral types, their morphologies, and their luminosities. The results on phase-space segregation have been interpreted on the basis of simple kinematical models.
4.1 The Different Populations of Cluster Galaxies
We defined the following cluster galaxy populations:
-
1.
galaxies with (or without) emission-lines in their spectra (Biviano et al. 1997);
-
2.
galaxies with spectra classified ’early’ or ’late’, according to a Principal Component/Artificial Neural Network analysis (de Theije & Katgert 1998);
-
3.
galaxies of different morphological types taken from the literature (mostly from Dressler 1980b; see Adami et al. 1998b).
The first sample contains 3729 ENACS galaxies in 75 clusters, 559 of which are emission-line galaxies (ELG). Since the sample is not complete in terms of equivalent width, there may be undetected ELG among the 3170 non-ELG. As a matter of fact, using the ENACS data with morphological types from Dressler (1980b), we found that almost all cluster ELG are Spirals (S) or Irregulars (I), yet only one third of all S and I are ELG. It is important to understand whether the non-ELG late-types share the same phase-space distribution as the ELG or not. Sample n.2 was built with this purpose; ENACS spectra were classified into 1571 early-types and 1023 late-types.
Finally, sample n.3 was built with the purpose of a finer morphological sampling. Most of the 1998 cluster galaxy data in this sample are taken from the literature (all morphological types and 80 % of velocities).
4.2 ELG (Emission-Line Galaxies) vs. non-ELG
The density profile of ELG is clearly flatter than that of non-ELG, as can be seen in Figure 5 (left panel). Fitting a beta-model to the two profiles, we estimated the ELG core radius to be three times larger than the non-ELG core radius. Not only were the ELG found to have a wider spatial distribution than non-ELG; they also have a wider velocity distribution. This is illustrated in Figure 5 (right panel), where the 75 cluster samples have been combined by using normalised galaxy line-of-sight velocities, . The ELG is % larger than the non-ELG .
bivianoa5a.epsbivianoa5b.eps
The wider spatial and velocity distributions of ELG, combine to give an ELG-based virial mass estimate 50 % higher than the one obtained using the non-ELG sample. If non-ELG trace the cluster potential, ELG are not in virial equilibrium within the same potential. Since ELG are nonetheless cluster members111Interlopers were eliminated from the sample using the procedure of den Hartog & Katgert (1996). Of course, no interloper removal procedure is perfect. However, the procedure is blind with respect to the galaxy type, so there is no reason why the fraction of wrongly assigned cluster members should be different for the ELG and the non-ELG population. Therefore interlopers cannot explain the different virial mass estimates that result from using one or another population., they must be an unrelaxed bound cluster population. ELG have probably never crossed the cluster core, or their emission-line properties would have been affected by environmental related processes, while they are undistinguishable from those of field ELG (Biviano et al. 1997).
The velocity dispersion profile (vdp, hereafter) is a useful (contracted) representation of the phase-space distribution. The non-ELG vdp is well fitted by a kinematical model with zero anisotropy and a decreasing radial velocity dispersion profile, that extrapolates to zero at a clustercentric distance of 8 h-1 Mpc (close to a typical cluster turn-around radius). The ELG vdp, on the other hand, is too steep to be fitted with a zero-anisotropy model. A good fit is obtained with a model with constant anisotropy:
where and are the tangential and, respectively, the radial component of the velocity dispersion. Based on the ELG vdp and on their gas content, we are led to the conclusion that ELG are on their first infall onto the cluster.
4.3 Early- vs. Late-Spectral Type Galaxies
The PCA/ANN method was applied to the ENACS spectra to discriminate among early- and late-types (de Theije & Katgert 1998). Moreover, the late-type galaxy sample contained enough ELG that it was possible to investigate separately the phase-space distributions of the late-type ELG and the late-type non-ELG.
The results are:
-
•
the density profile of the late-type galaxies is flatter than that of the early-type galaxies, but the density profile of the late-type ELG is even flatter (see Figure 4 in Katgert et al., these proceedings);
-
•
the late-type galaxy is 12 % larger than the early-type galaxy . However, the of the non-ELG late-type galaxies is almost identical to that of the early-types, while the late-type ELG is 25 % higher than that of the early-types.
Therefore, the phase-space distribution of the non-ELG late-type galaxies, is closer to that of the early-type galaxies, than to that of the ELG late-type galaxies. It seems that only the actively star forming galaxies do have a quite different phase-space distribution from other cluster galaxies. Once a late-type galaxy is stripped off its gas, it also reduces its velocity, or its orbital radial anisotropy (or both). We must then look for an environment-related physical process which can, at the same time, affect the galaxy gas content, and its orbit.
4.4 The Hubble Sequence
Since the PCA/ANN method only allowed us to distinguish two morphological classes, we complemented the ENACS data-set with data from the literature, in order to build a sample of galaxies with velocities, and morphological types. We analysed the phase-space distribution of four different morphological classes: ellipticals (E), S0’s, early spirals (Se Sa–Sbc), and late spirals (Sl Sc–Sm irregulars).
Fitting the density profiles of the four classes with a King function, we found a monotonic increase of the core-radius along the Hubble sequence. The of E is 13 % lower than that of S0, which is similar to that of Se. The Sl is 20 % higher than that of Se. The vdp’s of the four classes are also different (see Figure 6). First, Se and Sl have a decreasing vdp in the centre, while E and S0 have an increasing vdp out to 0.2 h-1 Mpc. Second, the vdp’s of E, S0 and Se are similar for clustercentric distances larger than 0.2 h-1 Mpc, while the Sl vdp is steeper and (almost) always above all the others.

The E and S0 vdp’s can be fitted using simple kinematical models with significant tangential anisotropy in the core, and isotropy outside. The Se and Sl vdp’s, instead, require radial anisotropy, higher for the Sl (). The low of E (and, to a less extent, S0) in the core, is an evidence for luminosity segregation, since it concerns the brightest cluster galaxies only. Luminosity segregation is indeed visible in our data (see Figure 1a in Adami et al. 1998b), and probaly results from merging and/or dynamical friction, as predicted by theoretical models (Menci & Fusco-Femiano 1996). On the other hand, the large of Sl suggests that these galaxies form a bound yet unvirialized population, possibly on a first infall onto the cluster. The same conclusion was reached by Biviano et al. (1997) about the ELG. Our results are instead in total disagreement with Ramírez & de Souza (1998).
Unfortunately, since a large part of this sample is drawn from the literature, spectra are unavailable for most of these galaxies, and we do not have any information on their emission-line properties. The similarity we see between the phase-space distribution of Sl and ELG could well be a tautology (SlELG), but the present sample cannot tell us whether the fraction of ELG among Sl is significantly larger than the fraction of ELG among other classes, Se included.
5 Conclusions
We have reviewed the main results obtained by using the ENACS data-set of cluster galaxy velocities. The main conclusions we have reached are the followings:
-
1.
The distribution
-
•
the intra-cluster gas and the cluster galaxies are in equilibrium in the same gravitational potential;
-
•
in standard CDM models, a bias is required.
-
•
-
2.
The FP of galaxy clusters
-
•
it exists, and it is different from the FP of ellipticals, and also from virial predictions with constant ;
-
•
if the tilt of the FP is due to different for different clusters, ;
-
•
less regular clusters are also less dynamically relaxed;
-
•
peculiar velocities of clusters must be km/s.
-
•
-
3.
The phase-space distributions of cluster galaxies
-
•
ELG and late-type spirals are bound but probably non-fully virialized cluster populations, maybe on first infall onto the cluster;
-
•
there is evidence for luminosity segregation of the brightest ellipticals and S0’s, which suggest that these galaxies have undergone significant dynamical evolution (via the dynamical friction and merging processes).
-
•
Acknowledgements.
We thank ESO for the allocation of the observing time. We acknowledge contributions of other members of the ESO Cluster Key Programme. We would like to thank the workshop organizers for a very enjoyable meeting.References
- [1] bell, G.O. 1958, ApJS, 3, 211
- [2] bell, G.O., Corwin, H.G., Olowin, R.P. 1989, ApJS, 70, 1
- [3] dami, C., Biviano, A., Mazure, A. 1998b, A&A, 331, 439
- [4] dami, C., Mazure, A., Biviano, A., Katgert, P., Rhee, G. 1998a, A&A, 331, 493
- [5] dami, C., Mazure, A., Katgert, P., Biviano, A. 1998c, A&A, 336, 63
- [6] ahcall, N.A., & Cen, R. 1992, ApJ, 398, L81
- [7] ahcall, N.A., & Oh, S.P. 1996, ApJ, 462, L49
- [8] eers, T.C., Flynn, K., Gebhardt, K. 1990, AJ, 100, 32
- [9] iviano, A., Girardi, M., Giuricin, G., Mardirossian, F., Mezzetti, M. 1992, ApJ, 396, 35
- [10] iviano, A., Girardi, M., Giuricin, G., Mardirossian, F., Mezzetti, M. 1993, ApJ, 411, L13
- [11] iviano, A., Katgert, P., Mazure, A., et al. 1997, A&A, 321, 84
- [12] olless, M., & Hewett, P. 1987, MNRAS, 237, 799
- [13] en Hartog, R., & Katgert, P. 1996, MNRAS, 279, 349
- [14] e Theije, P.A.M., & Katgert, P., 1998, A&A, in press
- [15] ressler, A. 1980a, ApJ, 236, 351
- [16] ressler, A. 1980b, ApJS, 42, 565
- [17] ressler, A., Faber, S.M., Burstein, D. et al. 1987, ApJ, 313, L37
- [18] ressler, A., & Shectman, S.A. 1988, AJ, 95, 284
- [19] beling, H.E., Edge, A.C., Fabian, A.C., Allen, S.W., Crawford, C.S. 1997, ApJ, 479, L101
- [20] dge, A.C., Stewart, G.C., Fabian, A., Arnaud, K.A. 1990, MNRAS, 245, 559
- [21] renk, C.S., White, S.D.M., Efstathiou, G., Davis, M. 1990, ApJ, 351, 10
- [22] irardi, M., Biviano, A., Giuricin, G., Mardirossian, F., Mezzetti, M. 1993, ApJ, 404, 38
- [23] enry, J.P., Arnaud, K.A. 1991, ApJ, 372, 410
- [24] eydon-Dumbleton, N.H., Collins, C.A., MacGillivray, H.T. 1989, MNRAS, 238, 379
- [25] atgert, P., Mazure, A., Perea, J., et al. 1996, A&A, 310, 8
- [26] atgert, P., Mazure, A., den Hartog, R., et al. 1998, A&AS, 129, 399
- [27] umsden, S.L., Nichol, R.C., Collins, C.A., Guzzo, L. 1992, MNRAS, 258, 1
- [28] azure, A., Katgert, P., den Hartog, R., et al. 1996, A&A, 310, 31
- [29] enci, N., Fusco-Femiano, R. 1996, ApJ, 472, 46
- [30] ahre, M.A., Djorgovski, S.G., de Carvalho, R.R. 1995, ApJ, 453, L17
- [31] amírez, A.C., & de Souza, R. 1998, ApJ, 496, 693
- [32] caramella, R., Zamorani, G., Vettolani, G., Chincarini, G. 1991, AJ, 101, 342
- [33] chaeffer, R., Maurogordato, S., Cappi, A., Bernardeau, F. 1993, MNRAS, 263, L21
- [34] chechter, P. 1976, ApJ, 203, 297
- [35] tein, P. 1997, A&A, 317, 670
- [36] an Kampen, E. 1994, PhD thesis, Leiden Observatory
- [37] est, M.J., Oemler, A., Dekel, A. 1989, ApJ, 346, 539
- [38] hitmore, B.C., & Gilmore, D.M. 1991, ApJ, 367, 94
- [39] abludoff, A.I., Geller, M.J., Huchra, J.P., Ramella, M. 1993, AJ, 106, 1301