An ultra-deep ISOCAM observation through a cluster-lens ††thanks: Based on observations with ISO, an ESA project with instruments funded by ESA Member States (especially the PI countries: France, Germany, the Netherlands and the United Kingdom) with the participation of ISAS and NASA
Abstract
We present results of ultra-deep ISOCAM observations through a cluster-lens at 7m and 15m with the Infrared Space Observatory (ISO) satellite. These observations reveal a large number of luminous Mid-Infrared (MIR) sources. Cross-identification in the optical and Near-Infrared (NIR) wavebands shows that about half of the 7 m sources are cluster galaxies. The other 7m and almost all 15 m sources are identified as lensed distant galaxies. Thanks to the gravitational amplification they constitute the faintest MIR detected sources, allowing us to extend the number counts in both the 7 and 15 bands. In particular, we find that the 15 counts have a steep slope and are large, with N arcmin-2. These numbers rule out non-evolutionary models and favour very strong evolution. Down to our counts limit, we found that the resolved 7 and 15 background radiation intensity is respectively (20.5)10-9 and (51)10-9 W m-2 sr-1.
Key Words.:
Galaxies: abundances – Galaxies: clusters: general – Galaxies: evolution – Gravitational lensing – Infrared: galaxies1 Introduction
Great progress in the understanding of physical properties of galaxies has been achieved with Mid-Infrared (MIR) and Far Infrared (FIR) observations using the ISO satellite (Kessler et al., 1996) and its ISOCAM camera (Cesarsky et al., 1996).
Deep optical surveys, such as the Hubble Deep Field (Williams et al., 1996) revealed a new population of distant sources at high-redshift () either using ‘drop-out’ techniques (Steidel et al., 1996) or ‘photometric redshift’ (e.g. Lanzetta et al., 1996, Connolly et al., 1997). Yet optical surveys may miss a whole class of high-redshift dust-enshrouded galaxies (Blain & Longair 1993). In particular the progenitors of today’s E/S0 galaxies at 2 may emit an important fraction of their total light in the NIR, MIR, FIR and Sub-millimeter regions (e.g. Franceschini et al., 1994). Indeed, galaxy formation models (e.g. Arimoto & Yoshi 1987, Guiderdoni et al., 1997) predict that galaxies in their forming phase are heavily obscured by abundant gas and dust inside the system. These issues have motivated very deep ISOCAM observations of blank fields (Rowan-Robinson et al., 1997; Aussel et al., 1997; Aussel et al., 1998; Désert et al., 1998; Taniguchi et al., 1997), as well as Sub-millimeter observations (Smail, Ivison and Blain 1997; Blain 1997; Barger et al., 1998.; Hughes et al., 1998).
The ISOCAM-HDF observations (Oliver et al., 1997; Aussel et al., 1998) showed that a non-evolving model at 15m is ruled out at 3. Analysing galaxy counts over a wide range of sensitivity, Elbaz et al., (1998) noted a change of slope in the counts observed at the mJy-level. This variation cannot be explained by a simple evolutionary model, but requires stronger star-formation activity for galaxies with .
Very deep ISOCAM observations have been conducted through gravitationally lensing clusters as part of a large programme executed in the ISO Science Operations Team guaranteed time (the ISO ARCS programme). The clusters used were A370 (Metcalfe et al., 1997, 1999), A2218 (Altieri et al., 1998a; Metcalfe et al., 1999), MS2137, Cl2244 and A2390. Further to a central goal of the ARCS programme, fainter detection thresholds were reached in a given observation time, thanks to gravitationnal amplification. We report here key results obtained for A2390.
By pushing ISOCAM to its ultimate limits with the help of gravitational lensing, we performed ultra-deep observations through the core of probably currently the best studied lensing cluster: Abell 2390 (), to obtain a magnified view of the background sky. This both increases the sensitivity of our MIR maps and reduces the effects of source confusion. These new observations supersede in area and depth the previous ISOCAM observations of this cluster (Lémonon et al., 1998).
In Section 2 the observations and data reduction techniques are discussed. Photometry, source identification and counts are presented in Section 3. Results are discussed in Section 4. Througout this paper, we used , and km/s/Mpc.
2 Observations & Data Reduction
2.1 Observations
The ESA guaranteed time observations reported here were allocated one full ISO revolution (science window of 16 hours), between December 26 and 29, 1997. We used the best observational strategy for detection of faint sources, based upon in-flight experience. In particular, the field was observed in 4 consecutive revolutions in 4 blocks of 4 hours. The allocated time was equally divided into the 2 broad-band ISOCAM filters LW2 (5-8.5m), centered at 6.75m, and LW3 (12-18m), centered at 15 m.
The observational strategy, that reaches the ultimate sensitivity (Altieri et al., 1998b), is performed by rastering the 3232-ISOCAM detector array in microscanning mode. The pixel-field-of-view (PFOV) of 3′′ per pixel was chosen to obtain high spatial resolution at the expense of signal, but obtaining a better sampling of the PSF, crucial for source cross-identification. The raster step size was 7′′ (2.33 pixels), the minimum value to step out of the PSF FWHM in two consecutive pointings. The size of rasters was 1010, so that, in the central part of each single raster, 100 different detector pixels sampled each sky pixel. Such redundancy was a key factor in ISOCAM deep observations. The final maps cover a field size of 2.6’2.6’.
| Filter | Raster Size | Steps | Nexp | Tint | PFOV |
|---|---|---|---|---|---|
| LW2 | 4 - 10x10 | 7′′ | 13 | 5s | 3′′ |
| LW2 | 1 - 6x6 | 10′′ | 30 | 5s | 3′′ |
| LW3 | 4 - 10x10 | 7′′ | 13 | 5s | 3′′ |
| LW3 | 1 - 6x6 | 10′′ | 30 | 5s | 3′′ |
2.2 Data Reduction & Calibration
The Abell 2390 raw data of both the ARCS and the
Lémonon et al., (1998) programme were processed together following the steps:
i) Dark subtraction using an IDL based package (Ott et al., 1997)
that uses a time-dependent dark correction (Biviano et al.,
1998).
ii) Deglitching, flat-fielding and sky subtraction of each raster,
was performed using the PRETI Multi-resolution Median Transform
techniques adapted for ISOCAM data analysis (Starck et al., 1997),
a multi-scale analysis that decomposes the different parts of the
signals.
iii) Field distortion correction (Aussel et al., 1998) for sky
projection, with a final pixel size of 1′′ .
iv) The five (4+1) rasters were then stacked together using the
drizzling technique (Fruchter & Hook 1998). The rasters were aligned
using the centroids of the 4–5 brightest sources in each waveband.
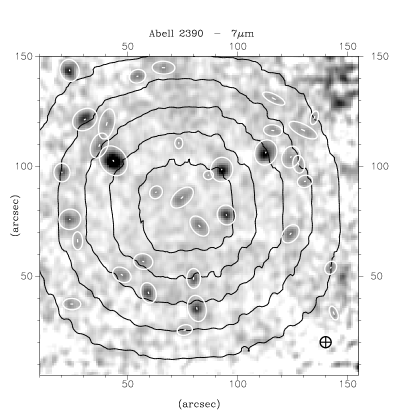
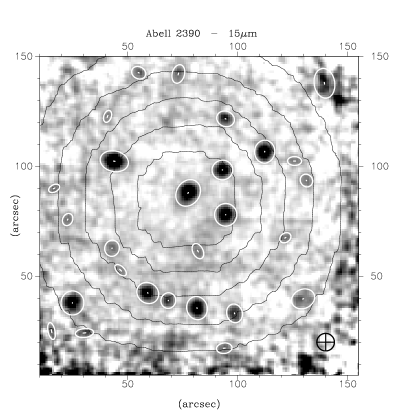
The central parts of the stacked 7 and 15 m images are shown respectively in Figs. 1 & 2. The noise in the central part of the image is 0.1 Jy arcsec-2 in LW2 and 0.2 Jy arcsec-2 in LW3.
The calibration into Jy was done using the refined in-flight values from Blommaert et al. (1998). We took into account the transient behaviour of the ISOCAM pixel signals, which do not stabilize at faint fluxes, but respond with transient drifts that depend both on the background level and the source intensity. We calibrated this response (in the 13 readouts per raster position) at 60% in LW2 and 80% in LW3, at various levels by running the IAS transient correction model (Abergel et al., 1996).
3 Analysis & results
3.1 Detection & Photometry
Source catalogs from our field in LW2 and LW3 were constructed using the SExtractor package (Bertin & Arnouts, 1996). The detection algorithm searches for 15 contiguous pixels, each having a surface brightness exceeding a threshold (chosen as 1.5 of the sky noise, Table 2), after subtracting a smooth background signal and convolving the image with a gaussian filter of the same width as the 7 and 15 image PSF. We performed 7′′ aperture photometry. Aussel et al. (1998) showed that aperture photometry is very linear, above 100 Jy even though at the faintest fluxes the remnants of cosmic rays pollute the sources with a positive bias. The photometry was corrected for loss of flux in the PSF wings, by using measurements of calibration stars under similar conditions (microscanning & rastering): 60% of the flux is found within a 7′′ diameter at 7 and 48% at 15 .
To assess the contribution of noise to our catalogs we ran the detection algorithm on the negative fluctuations in the maps, concluding that we have no false detections above 60 Jy in the central 2’2’ area of the maps in both filter bands.
Finally, to determine the completeness of the sample we added a template faint source (scaled-down version of a calibration star) to the maps repeatedly at different positions in the map and estimated the efficiency of detecting this source as a function of its flux density. This provided a reliable estimate of the visibility of a faint compact source in the maps. The estimated 80% and 50% completeness limits of the catalogs derived from these simulations are listed in Table 2. These figures refer to apparent source brightness and are similar to the deepest observations published to date at 7 on the Lockman Hole (Taniguchi et al., 1997, faintest detections around 30Jy) and at 15 on the HDF (faintest sources around 50 Jy). However, thanks to the gravitational magnification of a factor 2 to 10, the sources are intrisically the faintest MIR sources detected to date.
| Threshold | N | Nneg | S80% | S50% | |
|---|---|---|---|---|---|
| ( ) | Jy/beam (3) | Jy | Jy | ||
| 7 | 25 | 31 | 0 | 70 | 40 |
| 15 | 40 | 34 | 0 | 100 | 60 |
3.2 Cluster Contamination
Thanks to our high-resolution images we have been able to unambiguously identify almost all the MIR sources with counterparts in deep NIR and optical (HST/WFPC2 and ground-based) images. The relative astrometric accuracy is found to be better than 1′′ in both filters. In only a few cases we suspect that two sources are blended. There is one obvious case in the 7 map, where the straight arc (Pelló et al., 1991) is blended with the nearby elliptical galaxy.
30 sources are detected at 7 . Half of them are easily identified as cluster member galaxies (Pelló et al., 1991, Leborgne et al., 1992, Abraham et al., 1996). The 5-8.5 emission of the cluster galaxies corresponds to 4.5-6.9 restframe emission. For E/S0 galaxies it corresponds mostly to the Rayleigh-Jeans tail of their old stellar population as in the Virgo cluster (Boselli et al., 1998). Two stars are identified, and at least ten sources are lensed distant galaxies. These lensed sources are all detected at 15 .
At 15 , 34 sources are detected in the central 2.25’2.25’ field. Only three sources are identified as cluster members: the cD galaxy (Lémonon et al., 1998, Edge et al., 1998) and two star-forming galaxies. Based upon spectroscopic or photometric redshifts, all the other sources are identified as faint lensed galaxies. Almost all sources for which we have spectroscopic redshifts are background objects. Although, we can not rule out some of the targets being in the cluster, the probability is very small. The detection of almost exclusively background sources in the cluster images demonstrates that at 15 the cluster-core becomes transparent (as in Sub-mm/UV bands). Therefore the key feature is that the cluster-core acts as a natural gravitational telescope amplifying the flux of background sources, typically by a factor of 2.
3.3 Source counts
By correcting for the lens magnification and surface dilution effects, contamination by cluster galaxies, and non-uniform sensitivity of our maps, we can derive number counts at 15 to compare with blank sky counts (e.g. in the Hubble Deep field and Lockman Hole). The 7 number counts are more difficult to derive due to the larger contamination by the cluster and because of the small number statistics.
The number density of sources is high with respect to the size of the FWHM ( 6′′ diameter at 15 ), but the PSF is well sampled on the final maps, and its shape can be used to separate the sources; only two 15 sources lie at the location of pairs of suspected high-z galaxies. Our counts are not significantly affected by confusion.
The occasional blending of the sources has not been taken into account, but the surface area occupied by bright sources is subtracted for the computation of the surface density of the fainter ones (ie. other faint sources could be hidden by brighter ones). We used the completeness of the detection at 15 given in § 3. This correction is negligible to the 7 counts and was not applied.
Due to the non-uniform sensitivity of our maps (because of observation strategy) and the lensing effect, the object density per flux bin was computed using gain-dependant surface areas, and only the central 2’2’ area was taken into account for the faintest fluxes.
A detailed lensing model of A2390 has been produced by Kneib et al., (1998).
The lensing acts in two ways on the background population of galaxies:
i) an amplification of the source brightness,
typically by a factor of 2, but up to 10 near
the caustic lines.
ii) a surface dilation effect of the area probed, which
itself depends on the redshift; the space dilation is stronger towards
the centre (core of the cluster) and increases with source-plane redshift.
To estimate these factors we used: the spectroscopic redshift for 7 objects (Pelló et al., 1991, Bézecourt & Soucail 1997), and for the rest we use the best redshift estimate obtained with photometric redshift techniques (Pelló, private communication), and/or lensing inversion techniques (Kneib et al., 1998). By analysing the case with all background galaxies at a mean redshift , we checked the dependence of the results on redshift uncertainties.
4 Discussion and Conclusion
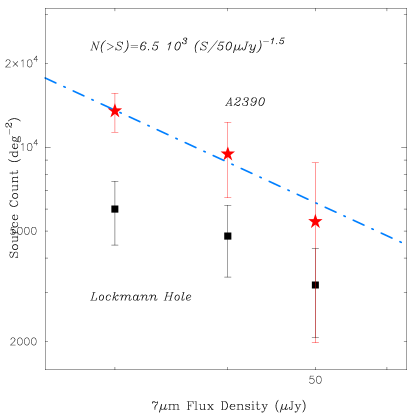
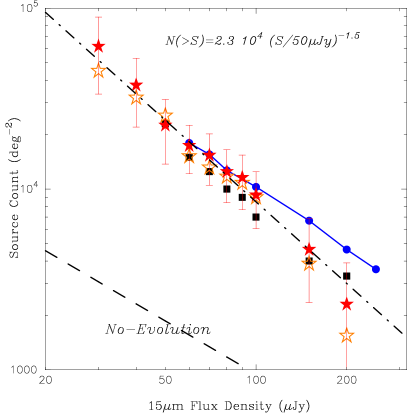
The source counts, corrected for cluster contamination and lensing effects, in both the LW2 and LW3 bands, are presented in Figs. 3 and 4. We have used only 5 sources (i.e. 60 Jy before lensing amplification correction). According to Hogg & Turner (1998), this is sufficient to avoid the positive flux-estimate Eddington bias which occurs for faint source counts.
At 7 , we find that the source density is greater than that of Taniguchi et al., (1997) by a factor of 2. We suggest that their observations are incomplete below 50 Jy, whereas our 7 map is 80% complete down to 30 Jy.
At 15 the number counts are compatible with the results of Aussel et al. (1998) in the HDF. However, with the help of gravitational lensing we are able to extend the counts in both bands down to 30Jy. Putting all background sources at only slightly decreases the faintest counts, at the faintest end, because a few suspectedly high-z faint sources would be less amplified. This shows the small dependency of our derived counts on the models. The very small positive magnification bias in the lensing-uncorrected counts is consistent with the measured slope of the source counts, while the general shift of the points towards higher flux follows from the loss of the lensing gain.
We find a total number density N7( 30Jy) = 3.5 arcmin-2 at 7 , and , and N15( 30Jy) = 13 arcmin-2 at 15 .
The 15 m counts show a steadily increasing excess (by more than a factor of 10) with respect to the prediction of a no-evolution model (dotted line, Franceschini et al., 1997). This confirms the steeper count slope below 1 mJy found on the Lockman Hole (Elbaz et al., 1998) and is in good agreement with the ISO HDF counts (Aussel et al., 1998). The counts are a factor 2-3 higher than the boundaries of the counts coming from an early analysis of the background fluctuations in the ISOCAM 15 map of the HDF (Oliver et al., 1997). In particular, we do not seem to detect any sign of flattening of the counts at the faintest levels, as expected from evolutionary models (Franceschini et al., 1997, Oliver et al., 1997). The slope stays close to -1.5 down to 30 Jy. This source density at faint levels favours extreme evolution models, needed to fit the counts at brighter fluxes, as shown by Elbaz et al. (1998).
Integrating the number counts over the whole flux range and extrapolating the counts we find that respectively and W m-2 sr-1 is emitted at 15 and 7 . This implies that a larger fraction of the UV/optical background is re-radiated in the MIR than in the local universe.
The absolute astrometry of MIR sources is difficult in deep surveys because of the lack of any obvious optical-NIR counterparts. In the A2390 field, unambiguous cross-identification of more than 90% of the sources was possible thanks to a large density of sources and a good sampling of the PSF. A number of these sources are well correlated with faint galaxies in the visible, some of them having very red colors in the NIR.
15 ISOCAM deep imaging is a good way to select star-forming galaxies and dusty AGNs which are not easy to identify in UV/optical surveys. A more detailed analysis of the SED of these MIR detected galaxies will be necessary to determine the nature of these sources and give an estimate of their SFR. Our observations confirm that abundant star formation activity occurs in very dusty environments at . Great caution must therefore be taken to infer global star formation activity based only on UV-continuum or optical luminosities of high-z galaxies. The global star formation history can be traced fully only if the effect of dust is taken into account in a consistent way. (e.g. Blain et al., 1998). Further, detailed analysis of our selected sample is needed to unveil the nature of these MIR galaxies.
Acknowledgements.
JPK acknowledges support from CNRS/INSU. Many thanks to A. Blain and I. Smail for useful discussions and comments. The ISOCAM data presented in this paper was analysed using “CIA”, a joint development by the ESA Astrophysics Division and the ISOCAM Consortium. The ISOCAM Consortium is led by the ISOCAM PI, C. Cesarsky, Direction des Sciences de la Matiere, C.E.A., France.References
- (1) Abergel A., Bernard J.-P., Boulanger F., et al., 1996, A&A, 315, L329
- (2) Abraham R, Smecker H., Tammy A. et al., 1996, ApJ, 471, 694
- (3) Altieri B., Metcalfe L., Biviano A. et al., 1998a, ASP Conf. Series, Vol. 146, p.136, astro-ph/9803155
- (4) Altieri B., Metcalfe L., Elbaz D. et al., 1998b, Experimental Astronomy, in press, “ISOCAM Ultimate sensitivity”,
- (5) Arimoto N., Yoshii Y., 1987, A&A, 173, 23
- (6) Aussel H., Cesarsky C.J., Elbaz D., Starck J.-L., 1998, A&A, in press, astro-ph 9810044
- (7) Barger A., Cowie L., Sanders D. et al., 1998, Nat., vol. 394
- (8) Bertin E. & Arnouts S., 1996. A&A, 177, 393
- (9) Bézecourt J. & Soucail G., 1997, A&A, 317, 661-669
- (10) Biviano A., Sauvage M., Gallais P., Roman P., Altieri B., 1998, Exp. Astr., in press, “Dark current behaviour in ISOCAM LW detector”
- (11) Blain & Longair, 1993, MNRAS, 255, L21
- (12) Blain A., Smail I., Ivison R., Kneib J.-P., 1998, MNRAS, in press, astro-ph/9806062
- (13) Blommaert J., Metcalfe L., Altieri B., 1998, Exp. Astr., in press, “The ISOCAM responsivity in orbit”
- (14) Boselli A., Lequeux J., Sauvage et al., 1998, A&A, 335, 53
- (15) Cesarsky C.J. et al., 1996, A&A 315, L32
- (16) Désert F.-X., Puget J.-L., Clemments D. et al., 1998 A&A, submitted, astro-ph/9809004
- (17) Connolly, A.J., Szalay, A.S., Dickinson, M., Subbarao, M.U., Brunner, R.J., 1997 , ApJL, 486, 11.
- (18) Edge, A.C, Ivison, R.J., Smail, I., Blain, A.W., Kneib, J.-P., 1998, MNRAS, submitted
- (19) Elbaz D., Aussel H., Cesarsky C. J. et al., 1998, Proc. of 34th Liege Int. Astr. Coll. on the NGST, astro-ph/9807209
- (20) Franceschini A., Mazzei P., De Zotti G., Danese L., 1994, ApJ, 427, 140-154
- (21) Fruchter A.& Hook R., 1998, Appl. of Digital Image Proc. XX, ed. A. Tescher, Proc.SPIE. vol.3164 astro-ph/9708242
- (22) Guiderdoni, B., Hivon, E., Bouchet, F. R., Maffei, B., 1997, MNRAS, 295, 877.
- (23) Hogg D & Turner E., 1998, PASP, 110, 723
- (24) Hughes D., Serjeant S., Dunlop J. et al., 1998, Nat., 394, 241
- (25) Kessler M.F. et al., 1996, A&A 315, L27
- (26) Kneib et al., 1998, in preparation.
- (27) Lanzetta K.M., Webb J., Barcons X., 1996, Nature, 381, 759
- (28) Leborgne J.-F., Pelló R., Sanahuja B., 1992, A&AS, 95, 87
- (29) Lémonon L., Pierre M., Cesarsky C.J., Elbaz D., Pelló R., Soucail G., Vigroux L., 1998, A&A, 334, L21
- (30) Metcalfe L., Altieri B., Aussel. et al., 1998 in Extr. Astronomy in the Infrared, Edt Frontieres, Mamon G., astro-ph 9803174
- (31) Metcalfe L. et al., 1999. In preparation.
- (32) Oliver S., Goldschmidt P., Franceschini A. et al., 1997, MNRAS, 289, 471
- (33) Ott S. et al., 1997, in Hunt G., Payne (eds) ASP Conf. Series Vol. 125
- (34) Pelló R., LeBorgne J.F., Soucail G., Mellier Y., Sanahuja B., 1991, ApJ, 366, 405
- (35) Pierre M., Aussel H., Altieri B. et al., 1996, A&A, 315, L297-L300
- (36) Rowan-Robinson M., Mann R., Oliver S. et al., 1997, MNRAS 289, 490
- (37) Rush B., Malkan M., Spinoglio L., 1993, ApJS, 89, 1
- (38) Starck J.-L. et al., 1997, in Extragalactic Astronomy in the Infrared, Edt Frontieres, G. Mamon
- (39) Starck J.-L., 1998, ’The multiscale approach’, in Image processing and data analysis, Cambridge University press.
- (40) Smail I., Ivison R.J., Blain A.W., 1997, ApJ, 1997, 490, L5
- (41) Steidel C.S., Giavalisco M, Dickinson M., 1996, AJ 112, 352
- (42) Taniguchi Y., Cowie L., Sato Y. et al., 1997, A&A, 328, L9
- (43) Williams R., Blacker B., Dickinson M. et al., 1996, AJ, 112, 1335