An HI Survey of LSB galaxies selected from the APM Survey
Abstract
We present preliminary results of a neutral hydrogen (HI) redshift survey to find low surface brightness (LSB) galaxies in the very nearby universe. Our sample consists of all galaxies in the APM catalog (Maddox et al. 1990) with a mean surface brightness of mag/arcsec2, down to a magnitude limit of . With the Parkes 64m radiotelescope 35 objects were detected at km s-1. The resulting luminosity function, HI mass function, and for the first time field mass function are presented. It is found that LSBs make a negligible contribution to the overall integrated luminosity, HI mass, and total mass contained in galaxies.
Dominion Astrophysical Observatory, Herzberg Institute of Astrophysics, National Research Council of Canada, 5071 W. Saanich Rd., Victoria, BC, V8X 4M6, Canada
Astronomy Department, University of California, Berkeley, CA94720, USA
Astronomy & Astrophysics Department, University of Chicago, 5640 S Ellis Ave, Chicago, IL60637, USA
Department of Physics & Astronomy, University of Victoria, Victoria BC, V8X 4M6, Canada
1. Introduction
Redshift surveys of the general field galaxy population have revealed an interesting class of optically low-surface-brightness (LSB) galaxy which refuse to yield a redshift by optical means, and which may represent however a significant population. Studies of nearby groups of galaxies have unveiled a large population of neutral hydrogen (HI) rich dwarfs at low redshifts (Côté et al. 1997). It is natural to suppose that more of these gas-rich dwarfs could be lurking in the field neighborhood, and could thus be relatively easily amenable to redshift detection in the radio. The following survey was designed to explore this possibility. Here we present preliminary results.
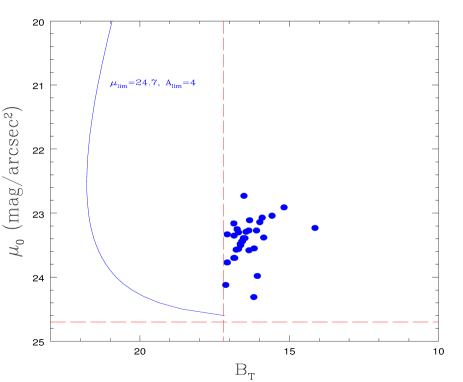
Our sample was extracted from the ’APM Galaxy Survey’ catalog of Maddox et al. (1990), which contains about 2 million galaxies spread over 4300 square degrees covering the southern galactic cap. Because images were identified by the APM as connected groups of pixels (16 pixels minimum) with densities higher than a set threshold above the local sky, the resulting catalog is effectively diameter-limited, to arcsec2, with a limiting surface brightness mag/arcsec2. To generate a well-defined sample of LSB field galaxies we retained all galaxies satisfying the following criteria:
mean surface brightness of mag/arcsec2
magnitude of
This produced a candidate list of 88 galaxies.
2. Observations
All our candidates were observed in HI at the 64m Parkes Radiotelescope, using a 32 MHz bandwidth, which resulted in a channel separation of 6 km s-1 for a (usable) velocity range of -300 to 4300 km s-1. This negative velocities coverage was necessary to ensure that unknown Local Group objects would be recovered. Our 3 detection limit is (at 4300 km s-1using Ho=75 km/s/Mpc). This yielded 35 redshifts.
These nearby galaxies were then observed at the CTIO 1.5m with a Tek1024 CCD in B and R, with typical exposure times of 20 minutes. Surface photometry was performed, and luminosity profiles (down to mag/arcsec2) were fitted to obtain the structural parameters, and integrated to get isophotal magnitudes, more reliable than the APM magnitudes.
This survey is therefore very much in the same flavor as the large APM survey of Impey et al. (1996) who obtained 332 redshifts in HI at Arecibo and in H. Their sample was not magnitude-limited though and their diameter limit was higher ( arcsec2), which means that their sample is more susceptible to observational selection bias, that needed to be corrected for (Sprayberry et al. 1996, 1997). By restricting ourselves to a relatively bright magnitude limit we avoided being affected by these biases (see Figure 1). Also our HI spectra have better resolution and sensitivity since our intended targets were nearby dwarfs.
3. Results
The absolute magnitudes of the objects recovered in this survey range from -18.5 down to -10.9, with disk scalelengths from 4 kpc to 0.15 kpc. The average central surface brightness is 23.4 mag/arcsec2, but there is a wide range of central surface brightnesses at a given absolute magnitude. The median colour of our sample is =0.93, which is essentially the same as that expected from High surface brightness galaxies: de Blok et al. (1995) have analysed a sample of galaxies extracted from the ESO-LV catalog (to use as a comparison sample for their LSBs) and found for the HSBs. A wide range of colours is recovered for our nearby galaxies, from =0.55 to 1.22, but again this is typical of the range found in normal late-type galaxies. No correlation is seen between the surface brightnesses and the colours which would not be the case if LSBs were the faded remnants of HSBs (see the discussion in O’Neil et al. 1997). The disk scalelengths in B and R agree within 20% for almost all the objects; combined with the fact that no correlation between colour and inclination is seen, and that only one object has been detected by IRAS, this all suggests that these LSBs have a relatively low dust content.
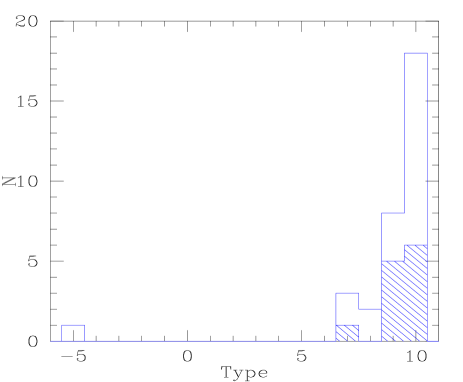
Figure 2 shows the distribution of morphological types in our sample. As expected the majority of them are irregulars. While spirals have more HI than irregulars (in terms of total gas mass in ), proportionally more irregulars are LSB galaxies, and with our HI detection limit we can recover ’typical’ irregulars down to , according to the magnitude-HI mass relations derived by Tully (1988) and Rao & Briggs (1993). One elliptical is also found, since following these same relations from Wardle & Knapp (1986) and Rao & Briggs (1993), we should be HI sensitive to them down to a magnitude of . The shaded histogram in the Figure shows the numbers of barred galaxies amongst them. Contrary to previous claims the same proportion of barred objects is seen amongst LSBs (about 34%) compared to normal galaxies, which are 30% barred (van den Bergh, 1998) (see also Knezek, this volume).
Amongst our 35 detections only 9 objects had already published redshifts (from the ESO catalog, the Southern Sky Redshift Survey Catalogue of da Costa et al. (1991), or Côté et al. (1997)). As far as very nearby dwarfs are concerned only 3 objects were detected at km s-1: ESO305-G2 (already detected in da Costa et al. 1991), ESO473-G24 (already known from Côté et al. 1997), and APM156-15-05 detected here for the fist time at 230 km s-1.
4. Implications
Luminosity function
After transforming our observed velocities to the Local Group frame (using ), the luminosity function was estimated using Schmidt (1968) method (Figure 3). None of our galaxy has and the average is , meaning that the sample is not suffering from serious incompleteness. A Schecter fit yields and (although with large uncertainties). In Figure 3 our results (where the error bars plotted are just poissonian) compare well with the luminosity function obtained by Sprayberry et al. (1997) with their larger sample of LSBs, for which and . Note that their raw values were considerably boosted to correct mostly for surface brightness selection biases (Sprayberry et al. 1996), assuming -like many other authors- that scalelengths and central surface brightnesses of galaxies are uncorrelated, which is most likely not the case (de Jong this volume). Nevertheless these corrections do not appear to be so unreasonable because in the end their final values agree well with our raw ones (not corrected, since as stated above we selected our sample such as to minimise biases).
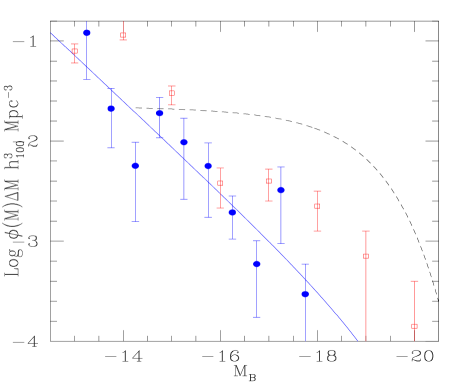
By integrating our luminosity function we derive an estimate of the total luminosity density of LSBs of Mpc-3, while Marzke et al. (1994) finds Mpc-3 over all galaxy types from the CFA survey, comparable to Loveday et al. (1992) value of Mpc-3. Clearly the luminosity contribution of LSBs is only a small fraction of the total luminosity in the universe, despite our steep faint-end slope, because these high number counts are for LSBs of insignificant luminosities.
HI mass function
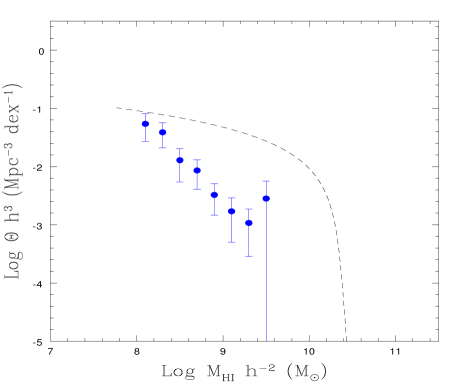
The HI spectra can yield more info than just a redshift, by integrating the profiles one gets an estimate of the HI mass contained in LSBs. The HI profiles of our LSB sample have widths typical of late-type spirals and dwarf irregulars (Schombert et al. 1992), with values for ranging from 20 to 203 km s-1, about half of them exhibiting the familiar double-horned shape. As noted before by e.g. de Blok et al. (1996) and Sprayberry et al. (1995) LSBs tend to be more gas-rich than HSBs of the same luminosity. However in terms of total HI mass contribution they do not seem to tilt the balance in their favour: Figure 4 show our HI mass function, compared to the schecter fit to the HI mass function of all galaxies detected in the Arecibo Strip Survey (Zwaan et al. 1997, see also Zwaan this volume). Galaxies with of HI will tend to be normal spirals, and only a small number of them are classified as LSBs. But down at of HI this is typically a late-type or an irregular, and most of them are LSBs (de Blok et al. (1995) find an average effective brightness of 24.25 mag/arcsec2 for Sd’s), which explains why our survey basically ’catches up’ with the Zwaan HI function eventually for these low HI masses. But the majority of the HI mass in the universe is not in LSBs but in galaxies of about of HI (Zwaan et al. 1997).
Mass function
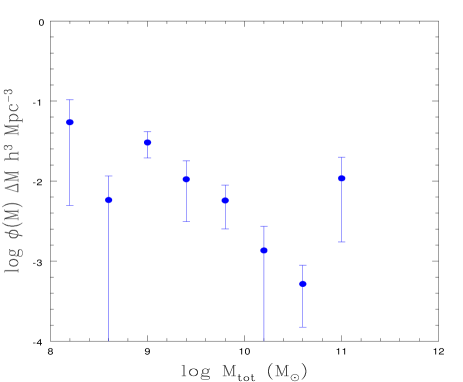
But besides an estimate of the total HI mass of the object, an HI profile also reveals, from its width, something about the kinematics of the galaxy. From the observed we estimated for each galaxy its maximum rotation velocity , by using its derived inclination from our photometry and the Tully-Fouqué (1985) corrections for random motions. This is still a reasonable thing to do for dwarfs down at like in our sample, because they are known to be still mainly rotationally-supported at that luminosity (see DDO154, Carignan & Freeman 10988, also Côté et al. 1997, van Zee et al. 1997). This is the only way (other than fully mapping them in HI with aperture synthesis) to estimate their because dwarfs deviate from the Tully-Fisher relation defined by spirals (Carignan & Freeman 1988, see also Freeman, this volume). With this one can then obtain an indicative dynamical mass with a relation of the form , where we will use , with the scalelengths derived from our photometry, because HI rotation curves for dwarfs typically reach at least (Broeils 1992). This first field mass function is presented in Figure 6, showing the number of galaxies of a particular mass per mass decade per Mpc3. The rise at the faint-end is much steeper than for the mass function calculated by Ashman et al. (1993) who converted the luminosity function of Efstathiou et al. (1998) using the variation of the mass-to-light ratio of Salucci et al. (1992). But it’s still not steep enough for small galaxies to dominate the mass in galaxies in the universe. With our limited sample of only 35 redshifts so far this figure should be taken just as an illustration of the interesting potential of HI surveys, compared to the conventional deep imaging surveys of LSB galaxies.
Acknowledgments.
Many thanks to the organisers for such a pleasant and stimulating workshop. We also thank the Parkes and CTIO TACs for all the observing time we needed. No thanks to big corporations for polluting our radiobands which make HI surveys like this one more and more difficult each year (see Science, vol282, no5386, p.34, for more details).
References
Broeils, A., 1992. PhD thesis, Rijksuniversiteit Groningen
Carignan, C., Freeman, K, 1988, 1988, ApJ, 332, 33
Côté, S., Freeman, K., Carignan, C. 1996. In ”Dark and Visible matter in galaxies”, ASP 117, eds. M.Persic,P.Salucci, 52
Côté, S., Freeman, K., Carignan, C., Quinn, P. 1997. AJ, 114, 1313
da Costa, L., Pellegrini, S., Davis, M et al 1991, ApJS, 75, 935
de Blok, W., McGaugh, S., van der Hulst, J. 1996, MNRAS, 283, 18
de Blok, W., van der Hulst, J., Bothin, G. 1995, MNRAS, 274, 235
Impey, C., Sprayberry, D., Irwin, M., Bothun, G., 1996, ApJS, 105,2091
Loveday, J., Peterson, B., Efstathiou, G., Maddox, S. 1992, ApJ, 390, 338
Maddox, S., Sutherland, W., EWfstathiou, G., Loveday, J. 1990, MNRAS, 243, 692
Marzke, R., Geller, M., Huchra, J., Corwin, H. 1994, AJ, 108, 437
O’Neil, K., Bothun, G., Schombert, J., Cornell, M., Impey, C. 1997, AJ, 114, 2448
Rao, S., Briggs, F. 1993, ApJ419, 515
Schmidt, M. 1968, ApJ, 151, 393
Schombert, J., Bothun, G., Schneider, S., McGaugh, S. 1992, AJ, 103, 1107
Sprayberry, D., Impey, C., Irwin, M. 1996, ApJ, 463, 535
Sprayberry, D., Impey, C., Irwin, M., Bothun, G. 1997, ApJ, 481, 104
Tully, B., 1988, Nearby Galaxies Catalog, cambridge univ. press
Tully, B., Fouqué, P. 1985, ApJS, 58, 67
van den Bergh, S. 1998, ”Galaxy morphology and classification”, cambridge univ.press
van Zee, L., Haynes, M., Salzer, J., Broeils, A. 1997, AJ, 113, 1618
Wardle, M., Knapp, G. 1986, AJ, 91, 23
Zwaan, M., Briggs, F., Sprayberry, D., Sorar, E. 1997, ApJ, 490