THE ISOLATED ELLIPTICAL NGC 1132: EVIDENCE FOR A MERGED GROUP OF GALAXIES?
Abstract
Numerical simulations predict that some poor groups of galaxies have merged by the present epoch into giant ellipticals (cf. Barnes 1989). To identify the possible remnants of such mergers, we have compiled a sample of nearby, isolated ellipticals (Colbert, Mulchaey, & Zabludoff 1998). ASCA observations of the first galaxy studied, NGC 1132, reveal an X-ray halo that extends out to at least 250 kpc h. The temperature ( 1 keV), metallicity ( 0.25 solar) and luminosity ( 2.5 1042 h erg s-1) of NGC 1132’s X-ray halo are comparable to those of poor group halos. The total mass inferred from the X-ray emission, 1.9 1013 h M⊙, is also like that of an X-ray detected group. Optical imaging uncovers a dwarf galaxy population clustered about NGC 1132 that is consistent in number density and in projected radial distribution with that of an X-ray group. The similarities of NGC 1132 to poor groups in both the X-ray band and at the faint end of the galaxy luminosity function, combined with the deficit of luminous galaxies in the NGC 1132 field, are compatible with the merged group picture. Another possibility is that the NGC 1132 system is a ‘failed’ group (i.e., a local overdensity in which other bright galaxies never formed).
mulchaey@pegasus.ociw.edu
and
aiz@ucolick.org
1 Introduction
The evolution of elliptical galaxies and of poor groups of galaxies is probably linked. Numerical simulations suggest that a merged group will relax to form a single elliptical galaxy (Barnes 1989; Governato et al. 1991; Bode et al. 1993; Athanassoula, Makino, & Bosma 1997). Because the merger timescales for the brightest group members (M M∗) are a few tenths of a Hubble time (cf. Zabludoff & Mulchaey 1998), some groups have probably already merged into elliptical remnants. Observational clues to the origin of these ellipticals may remain. For example, the timescales for the cooling of the group X-ray halo (cf. Ponman & Bertram 1993; Ponman et al. 1994) and the merger of dwarf group members are much longer than for the merger of the brightest group galaxies. Therefore, a merged group could appear today as an isolated elliptical with a group-like X-ray halo and a surrounding dwarf galaxy population.
To identify merged group candidates, we have compiled a well-defined sample of nearby isolated elliptical galaxies (Colbert, Mulchaey & Zabludoff 1998). Our sample was defined by examining the environment of every galaxy classified as elliptical in the RC3 (de Vaucouleurs et al. 1991) with z 0.03. We consider a galaxy “isolated” when there is no other catalogued (i.e., bright) galaxy within a projected radius of 1 h (h100=Ho/100) Mpc or a recessional velocity of km s-1. Because surveys like the RC3 are notoriously incomplete, we confirm the isolation of these galaxies by visual inspection of the STScI Digitized Sky Survey plates and by comparisons with group and cluster catalogs drawn from magnitude-limited redshift surveys (e.g., CfA Redshift Survey, Huchra et al. 1995). Finally, we have obtained CCD images of the fields of these galaxies that confirm there are no other galaxies in the immediate vicinity (typically within a 200 kpc h radius; Colbert et al. 1998). These criteria ensure that the environments of these ellipticals are among the most rarefied (i.e., have the lowest bright galaxy densities) in the nearby universe.
In general, the galaxies in our isolated sample have not been extensively studied. The majority of the galaxies do not have optical imaging or spectroscopy available in the literature and none of them have been studied in detail in the X-ray band. However, six of the sample galaxies are in the ROSAT All-Sky Survey Bright Source Catalog (Voges et al. 1996), indicating they are sufficiently bright for future X-ray studies. We have begun a program to study these objects in detail with ASCA (Advanced Satellite for Cosmology and Astrophysics). Here, we present the results of the ASCA observations and optical imaging of our first target, NGC 1132, a luminous (MR -21.5 + 5 log h100; q0 = 0.5) elliptical with a recessional velocity of 6951 km s-1 (RC3) and a stellar velocity dispersion of km s-1 (Tonry & Davis 1981).
2 X-ray Properties of NGC 1132
NGC 1132 was observed by ASCA August 8-9, 1997. The data were screened following the method described in Davis, Mulchaey & Mushotzky (1998). The resulting exposure times are 32.1 ksec for the GIS (Gas Imaging Spectrometer) and 34.6 ksec for the SIS (Solid-State Imaging Spectrometer). The GIS consists of two imaging gas scintillation proportional counters, each with a circular field of view of diameter 50 arcminutes. The SIS consists of two cameras each with four front-illuminated CCD chips. However, because of the increase in the telemetry rates due to hot and flickering pixels, the four CCDs can no longer be operated simultaneously. For our observation of NGC 1132, a single CCD was used for each SIS camera. The resulting field of view for the SIS cameras is approximately 11 arcminutes on a side.
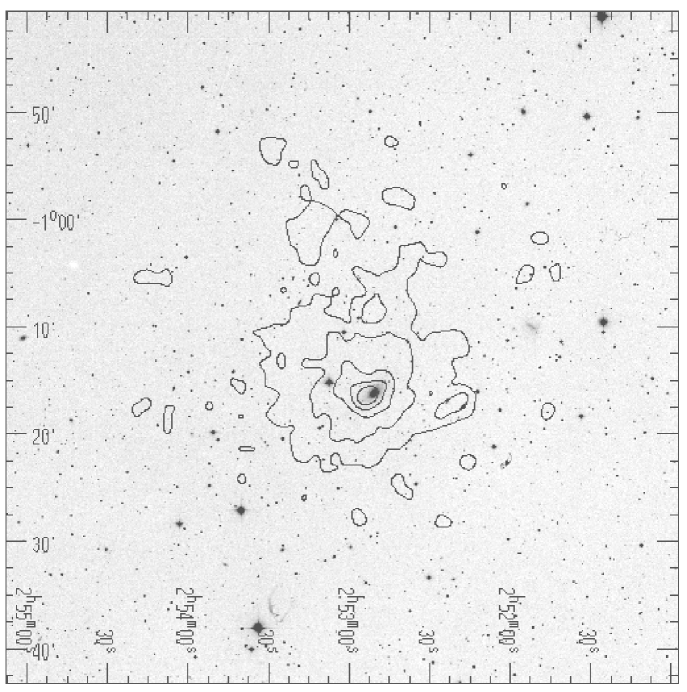
A bright extended X-ray source is clearly detected in both the SIS and GIS. The peak of the X-ray emission is located within 30 arcseconds of the optical position of NGC 1132. This offset is less than the 90% error circle for ASCA, consistent with the X-ray source being centered on NGC 1132 (Gotthelf 1996). In Figure 1, we overlay the contours of the X-ray emission from the GIS2 on the STScI Digitized Sky Survey image of the field.
To determine the extent of the X-ray emission, we construct an azimuthally-averaged surface brightness profile from the GIS2 data (Figure 2). Beyond a radius of 14′ the profile reaches a constant flux of 1.6 10-4 counts s-1 arcmin-2. We adopt this flux as the background level. The surface brightness profile reaches a level of 20% of the background at a radius of 12′ (corresponding to 243 h kpc). As this level is approximately the systematic error in the background, we adopt this radius as the maximum extent of the diffuse gas. We note that the physical extent of the hot gas in NGC 1132 is comparable to that of the X-ray halos of poor groups of galaxies (e.g., Mulchaey et al. 1996; Ponman et al. 1996).
We then use the XPROF program (Ptak 1997), which properly accounts for the GIS point spread function, to fit the profile with a standard hydrostatic-isothermal beta model (Cavaliere & Fusco-Femiano 1976) :
S(r)=So (1.0 + (r/rcore)2)-3β+0.5
where the free parameters are So (the central surface brightness), rcore (the core radius), and . We fix the background level in the fit to the value given above. The best fit to the profile gives =0.83 and rcore=4.65′ (94 h kpc). Although the model fit is formally acceptable ( 1.4), Figure 2 indicates that the model does not reproduce the flux levels at all radii and, in particular, it underestimates the central emission. This discrepancy is probably an indication that more complex models are required to describe the density profile. We note that the surface brightness profiles of groups derived from higher spatial resolution ROSAT PSPC observations suggest the presence of two X-ray components in these systems (Mulchaey & Zabludoff 1998). However, given the poor spatial resolution of the ASCA data, we do not attempt to fit more complicated models here. Future high spatial resolution images with AXAF (Advanced X-ray Astrophysics Facility) should provide better constraints on the gas density profile in NGC 1132 and allow us to search for the presence of multiple components in this system.
To determine the temperature and metallicity of the diffuse X-ray emission we extracted SIS and GIS spectra. As the SIS detectors were operated in 1-CCD mode, only the inner regions of the diffuse gas were covered. Thus, we are able to extract SIS spectra only out to a radius of 4′ (81 h kpc). For the GIS detectors, we extracted two spectra, one over the region covered by the SIS (i.e., 4 h kpc) and a second out to a radius of 12′ (243 h kpc), corresponding to the maximum measured extent of the X-ray emission. The spectra were fit with a Raymond-Smith model (Raymond & Smith 1977) with the gas temperature and metal abundance as free parameters. The absorbing column was fixed at the Galactic value of NH 5.2 1020 cm-2 (Stark et al. 1992). A simultaneous fit to the SIS and GIS (radius=4′) data gives a temperature of T=1.11 keV and a metal abundance of 0.58 solar. A fit to the GIS data out to radius=12′ gives a slightly lower best-fit temperature and metal abundance (T=1.04 keV, abundance=0.25 solar), but these values are still consistent within the errors with the spectral fit for the inner region. Based on the GIS data, the bolometric X-ray luminosity of NGC 1132 out to a radius of 12′ (243 h kpc) is 2.5 1042 h erg s-1. Overall, the temperature, metallicity and luminosity of the diffuse X-ray emission in NGC 1132 are similar to those of the intragroup medium in X-ray detected poor groups as determined by ASCA observations (Davis et al. 1998; Fukazawa et al. 1998).
The X-ray data can also be used to estimate the total mass of the NGC 1132 system. Assuming that the hot gas is in hydrostatic equilibrium and is isothermal, the total mass of the group at radius r is given by (e.g. Fabricant, Rybicki & Gornestein 1984):
Mtotal (r) = – [] r
where (r) is the gas temperature at radius r, is the gas density, k is Boltzmann’s constant, G is the gravitational constant, is the mean molecular weight, and is the mass of the proton. Adopting a model for the gas density profile and assuming that the gas is isothermal (i.e., = 0), this equation reduces to:
Mtotal (r) =
where r/rcore. Applying this equation to NGC 1132 and assuming the density profile derived from the model fit to the surface brightness profile, the total mass out to a radius of 12′ (243 kpc) is 1.9 1013 h M⊙. This mass is approximately the average mass found for poor groups observed by ROSAT (Mulchaey et al. 1996) and approximately 10 times the mass of the galaxy estimated from its internal velocity dispersion and effective radius (Tonry & Davis 1981).
3 Environment of NGC 1132
In the last section, we showed that NGC 1132 has a group-like X-ray halo, as might be expected if this galaxy is the remnant of a merged group. The number counts and distribution of galaxies in the NGC 1132 field provide additional tests of the merged group hypothesis. In this section, we compare the projected radial profile of faint galaxies in the NGC 1132 field with that of a composite of five, nearby X-ray detected groups to determine if NGC 1132 lies in a group-like system of dwarfs. These comparison groups are all of the groups in the Zabludoff & Mulchaey (1998) sample that have X-ray luminosities similar to NGC 1132 and for which we have optical imaging data. The five groups are NGC 2563, NGC 4325, NGC 5129, HCG 42 and HCG 62.
Images were obtained for NGC 1132 and the comparison X-ray groups in October 1996 at the 40-inch telescope at Las Campanas Observatory. The total exposure time for each field was 5 minutes using a Tek 2048 CCD chip and a Harris R filter. The images were reduced using standard techniques in IRAF and flux calibrated with standard star observations. For each field, the program SExtractor (Bertin & Arnouts 1996) was used to classify objects as stars or galaxies and to measure total magnitudes. Total magnitudes were measured using a method proposed by Kron (1980). Examination of plots of total magnitude versus total surface area indicate that SExtractor can cleanly separate galaxies from stars down to apparent R magnitudes of . This magnitude limit corresponds to an absolute magnitude of log h100 at the distance of our most distant object (NGC 4325) and we adopt this value as the limit of our analysis. For the purposes of this analysis, we consider only galaxies projected within 178 h kpc of the field centers (equivalent to the radius=9.14′ field-of-view of our NGC 1132 image).
In Figure 3 we plot the projected surface density of faint galaxies with apparent R magnitudes between 17.22 and 19.22 in the NGC 1132 field (open circles). If these galaxies all lie at the distance of NGC 1132, this magnitude range corresponds to log h100 MR log h100. The Figure shows that the surface density of faint galaxies increases within the central 60 h kpc, reaching a peak density of h-2 kpc-2. The clustering of faint galaxies around NGC 1132 suggests that these galaxies are true dwarfs and are physically associated with the giant elliptical.
By assuming that the faint galaxies in each group field are at the distance of the group, we construct a composite group radial profile for galaxies with log h100 MR log h100 (Figure 3, filled circles). This assumption is reasonable because, for both NGC 1132 and the composite group, the background level estimated from the fall-off in the profile at radii h kpc is small compared to the peak 111Counting statistics give as the significance of the peak above the background in the NGC 1132 field. The fact that the dwarfs are clustered within the inner 60h kpc of NGC 1132 suggests that the true significance of the peak is actually much higher.. Figure 3 demonstrates that both the number density and spatial distribution of dwarfs in the NGC 1132 field are comparable to those of the X-ray groups.
4 Discussion
The X-ray and optical observations discussed in the last two sections provide important insight into the NGC 1132 system. The X-ray properties of NGC 1132, such as gas extent, temperature, metallicity, and X-ray luminosity are all indistinguishable from those of X-ray detected groups. Furthermore, the total mass of the group as inferred from the X-ray halo is typical of poor groups (e.g., Mulchaey et al. 1996). From an X-ray perspective, NGC 1132 would be considered a group. Although the faint galaxies in the vicinity of NGC 1132 are clustered and their counts are group-like, there are no other bright () galaxies in the field. Thus, NGC 1132’s optical properties would not qualify it as a poor group.
The X-ray and optical observations might be reconciled if NGC 1132 is the product of a merged group. If NGC 1132 formed from the merger of the brightest group members, then its internal velocity dispersion is probably like that of the original group ( km s-1). For a group with this velocity dispersion (cf. Zabludoff & Mulchaey 1998), the timescale for a M∗ galaxy to merge with another galaxy is roughly a few tenths of a Hubble time tH. The dynamical friction timescale for a M∗ galaxy to fall into the center from an initial radius of h kpc (the extent of the observed NGC 1132 field) is similar. Thus, the luminous galaxies of a poor group could have merged into a central giant elliptical by the present time.
The dynamical evolution of fainter galaxies is slower. For example, the galaxy-galaxy merger and dynamical friction timescales for a M (log h100) galaxy in the same km s-1 group are tH (Zabludoff & Mulchaey 1998). Because the timescales for even fainter galaxies are longer still, we would expect many dwarfs (i.e., log h MR log h100) in the NGC 1132 system to have survived until the present day. Therefore, the group-like, clustered dwarf population and the deficit of luminous galaxies within h kpc of NGC 1132 are consistent with the merged group hypothesis.
A useful estimate of the lifetime of NGC 1132’s X-ray halo is the cooling time, tcool (d ln Tgas/dt)-1, where Tgas is the temperature of the gas. At X-ray emitting temperatures, tcool Tgas n-1 (Tgas)-1, where n is the gas number density and (Tgas) is the cooling function. Given our best fit model for the surface brightness profile, the gas density at 200 h kpc from the center of NGC 1132 is 3 10-4 cm-3. The temperature of the extended gas is 107 K. Using the cooling function in Raymond, Cox & Smith (1976) for a 107 K gas, we estimate a cooling time for the halo gas of roughly a Hubble time. Therefore, while the bright galaxies may have had enough time to merge into a single object, the large-scale X-ray halo remains basically unchanged from the time when the system was a group. Both the dwarf-to-giant ratio and the X-ray properties of NGC 1132 support the picture in which this giant elliptical was once a poor group.
On the other hand, it is possible that the NGC 1132 system formed with a deficit of luminous galaxies. In this “failed group” model, the majority of the stellar baryons were initially used up in a single luminous galaxy, rather than in several M objects. Hattori et al. (1997) have recently reported the discovery of another massive system that seems to lack galaxies. Based on ASCA observations, AXJ2019+1127 appears to be a luminous X-ray cluster at redshift z 1. However, optical imaging of the field around the X-ray source reveals only one luminous galaxy. The implied mass-to-light ratio of AXJ2019+1127 is M/LB 6,600 h100. What distinguishes this system from NGC 1132 is that AXJ2019+1127 is lacking in both the number of galaxies and in total stellar light, while the mass-to-light ratio of NGC 1132 (M/LR 300 h100) is comparable to poor groups of similar mass (the average M/LR for the five X-ray groups discussed in Section 3 is 340 h100). Therefore, the NGC 1132 system is not “dark” compared to groups, but rather has a high proportion of its stellar mass in a single object.
Regardless of the origin of isolated ellipticals, further studies of these galaxies are clearly warranted. Because the dark halos of giant ellipticals in denser environments like clusters are likely to be tidally-truncated by the cluster potential, isolated ellipticals may provide our only means of studying the halos of bright ellipticals before truncation. In the case of NGC 1132, the population of dwarf galaxies can be used as test particles to study the dynamics of the extended dark halo. Further X-ray observations of NGC 1132 and other isolated ellipticals should also prove fruitful. For example, AXAF observations should reveal whether the X-ray surface brightness profiles in these galaxies show the two-component structure characteristic of X-ray detected groups (Mulchaey & Zabludoff 1998).
References
- (1) Athanssoula, E., Makino, J., & Bosma, A. 1997, MNRAS, 286, 825
- (2) Barnes, J. E. 1989, Nature, 338, 123
- (3) Bertin, E., & Arnouts, S 1996, AA Suppl., 313, 21
- (4) Bode, P. W., Cohn, H. N., & Lugger, P. M. 1993, ApJ, 416, 17
- (5) Cavaliere, A., & Fusco-Femiano, R. 1976, AA, 49, 137
- (6) Colbert, J. W., Mulchaey, J. S., & Zabludoff, A. I. 1998, in preparation
- (7) Davis, D. S., Mulchaey, J. S., & Mushotzky, R. F. 1998, ApJ, in press.
- (8) de Vaucouleurs, G., de Vaucouleurs, A., Corwin, H. G. Jr., Buta, R. J., Paturel, G., & Foqué, P. 1991, Third Reference Catalogue of Bright Galaxies (New York: Springer-Verlag)(RC3)
- (9) Governato, F., Bhatia, R., & Chincarini, G. 1991, ApJ, 371, 15
- (10) Gotthelf, E. 1996, in ASCANews, No. 4
- (11) Fabricant, D., Rybicki, G. B., & Gorenstein, P. 1984, ApJ, 286, 186
- (12) Fukazawa, Y. et al. 1998, PASJ, 50, 187
- (13) Hattori, M. et al. 1997, Nature, 388, 146
- (14) Huchra, J. P., Geller, M. J., & Corwin, H. G. 1995, ApJ Suppl, 99, 391
- (15) Koo, D. C., & Kron, R. G. 1992, ARAA, 30, 613
- (16) Kron, R. G. 1980, ApJ Suppl, 43, 305
- (17) Mulchaey, J. S., Davis, D. S., Mushotzky, R. F., & Burstein, D. 1996, ApJ, 456, 80
- (18) Mulchaey, J. S., & Zabludoff, A. I. 1998, ApJ, 496, 73
- (19) Ponman, T. J., Allan, D. J., Jones, L. R., Merrifield, M., McHardy, I. M., Lehto, H. J., & Luppino, G. A. 1994, Nature, 369, 462
- (20) Ponman, T. J., Bourner, P. D. J., Ebeling, H., & Bohringer, H. 1996, MNRAS, 283, 690
- (21) Ponman, T. J., & Bertram, D. 1993, Nature, 363, 51
- (22) Ptak, A. 1997, PhD thesis, University of Maryland, College Park
- (23) Raymond, J. C., Cox, D. P., & Smith, B. W. 1976, ApJ, 204, 290
- (24) Raymond, J. C., & Smith, B. W. 1977, ApJ Suppl., 35, 419
- (25) Stark, A. A., et al. 1992, ApJ Suppl, 79, 77
- (26) Tonry, J. L., & Davis, M. 1981, ApJ, 246, 666
- (27) Voges, W. et al. 1996, IAU Circular, 6420, 2
- (28) Zabludoff, A. I., & Mulchaey, J. S. 1998, ApJ, 496, 39