Cosmological Insights from Supernovae
Abstract
-
† Department of Astronomy, University of Barcelona, Martí i Franqués 1, E–08028 Barcelona , SPAIN
-
‡ Max–Planck Institut für Astrophysik, Karl–Schwarzschild-Str. 1, D-86460 Garching, GERMANY
-
Abstract. While low–z Type Ia supernovae are used to measure the present rate of expansion of the Universe, high-z Type Ia measure its variation due to the cosmic matter–energy content. Results from those determinations imply a low matter density Universe with a non–zero cosmological constant (vacuum–energy component). The expansion rate of the Universe accelerates, according to these determinations. The validity of the Type Ia supernova approach for this cosmological research is addressed. An account is given of additional prospects to further investigate through supernovae what the Universe is made of. Those attempts range from constraining the large scale dark matter distribution to further test and interpret the presence of a vacuum energy component.
-
† Department of Astronomy, University of Barcelona, Martí i Franqués 1, E–08028 Barcelona , SPAIN
-
‡ Max–Planck Institut für Astrophysik, Karl–Schwarzschild-Str. 1, D-86460 Garching, GERMANY
-
Abstract. While low–z Type Ia supernovae are used to measure the present rate of expansion of the Universe, high-z Type Ia measure its variation due to the cosmic matter–energy content. Results from those determinations imply a low matter density Universe with a non–zero cosmological constant (vacuum–energy component). The expansion rate of the Universe accelerates, according to these determinations. The validity of the Type Ia supernova approach for this cosmological research is addressed. An account is given of additional prospects to further investigate through supernovae what the Universe is made of. Those attempts range from constraining the large scale dark matter distribution to further test and interpret the presence of a vacuum energy component.
1 Introduction
The epoch we are approaching unveils the Universe we live in and sheds new light on some of the problems that have remained open for several decades. The path already followed has been a controversial but exciting enterprise. Only two years ago we seemed to be facing a critical moment when comparing the present value of the expansion of the Universe, the age of the Universe as derived from the oldest objects, and the preliminary results on the matter content of the Universe. New, better results draw today a different picture, which appears reinforced by the agreement in the results from two independent groups in search of the cosmological values (matter density parameter) and (vacuum energy density content = / 3(H0)2). The results will be reviewed in detail in the next two contributions (Hook et al. 1998; Leibundgut 1998).
To test the model of our Universe and derive its expansion rate it is necessary to choose an object which can be used to trace distances with high accuracy. Cepheids and their period–luminosity relationship (Leavitt 1912) were first used by Hubble and are still used today to provide accurate distance determinations. To go to further depths in the Universe and attempt a determination of and , we need to have an object whose properties are universal (i.e. independent of the time and the region of space), homogeneous (i.e. being a low dispersion sample in brightness, or drawing a sharp relationship with brightness) and observable up to large redshift. The thermonuclear explosion of WDs, phenomenologically known as supernovae of Type Ia, turns to be the best available astrophysical object in this cosmological context. Studies of those supernovae in our close vicinity, at intermediate redshift, and at high z show that they all have the same properties and fulfill the same set of relationships.
In the next section, we will describe the empirical relationship, and in the following sections we will elaborate on the underlying method.
2 Luminosity of Type Ia supernova and H0
2.1 Brightness–decline
The first uses of SNe Ia to determine the cosmological parameters assumed those objects to be standard candles, implying that they all had similar luminosities. In 1977 Pskovskii realized a correlation between the brightness at maximum and the rate of decline of the light curve. First explanations attributed such correlation to external factors such as interstellar reddening (Boisseau & Wheeler 1991). However, a systematic follow–up of SNe Ia (Maza et al. 1994; Filippenko et al. 1992a,b; Leibundgut et al. 1992; Phillips 1993, Hamuy et al. 1996a,b) confirmed the brightness–decline relation. Phillips (1993), and Hamuy et al. (1996a,b) quantified it by studying supernovae at z 0.1, a z large enough that peculiar motions do not introduce dispersion in the magnitude–redshift diagram. The intrinsic variation of SNe Ia is written as a linear relationship of the sort:
(1) with dispersion of only . The relationship is calibrated in terms of an arbitrary value of . , the parameter of the SNe Ia light curve family, is the number of magnitudes decreased in 15 days after maximum.
Figure 2: The Hubble diagram for SNe Ia before (top panel) and after (bottom panel) correction of the width–absolute brightness relationship. The figure is from Riess, Press & Kirshner (1995a). Other groups have formulated the brightness–decline correlation in a different way. Riess, Press & Kirshner (1995a,b) use the full shape of the light curve in respect to a template. This is also the formulation used by the High-Z Team in their high redshift supernova studies. The Supernova Cosmology Project collaboration, on the other hand, has introduced the stretch–factor, s as a parameter to account for the brightness–decline relationship. All ways to parameterize the effect give equivalent results. The degree at which this correlation reduces the scatter in the Hubble diagram is shown in Fig.1.
The relationships above, if used in combination with local calibrators, provide a direct measurement of H0. Those local calibrators are Type Ia supernovae for which Cepheid distances to their host galaxies have been determined through HST observations. Using the first local available calibrators with distance provided by Cepheids (SN 1937C, SN 1972E, SN 1981B, SN 1990N) and the brightness–decline relationship, Hamuy et al. (1996a,b) derived a H0 value of 63.1 3.4 (internal) 2.9 (external) km s-1 Mpc-1. Riess, Press & Kirshner (1996) derived a value of 64 6 km s-1 Mpc-1. Whereas most of the empirical determinations of H0 using SNe Ia give values around 65 (see also the theoretical predictions in the next subsections), Sandage and Tammann (1997), and Saha et al (1997) argue for a H0 value 65. Sandage, Tammann and collaborators, and Branch and collaborators have selected from the SNe Ia sample those presenting bluer colors (“normal SNe Ia”) instead of using the whole sample correlation as in (1). The H0 value found is 57 6 km s-1 Mpc-1 (for a review, see Branch 1998).
The view held by most authors is that differences on these discrepant H0 values arise when instead of using the whole sample of SNe Ia and the brightness–decline correlation, a restricted use of the subsample of “normal” looking SNe Ia is made. Differences also originate in the way to place SNe Ia in the Hubble flow. Further investigation must clarify the still remaining discrepancies.
2.2 Physical approach: Boundaries on from WD explosions
The previous paragraphs gave a brief account of the empirical calibrations of the luminosity of Type Ia supernovae. From a basic understanding of Type Ia supernovae as physical objects, one can also put constraints on the value of the Hubble constant.
The absolute magnitude of a exploded WD has a limit established by the maximum mass of any WD: the Chandrasekhar mass , where is the number of electrons per nucleon. A WD accreting mass beyond the Chandrasekhar mass would either undergo a gravitational collapse forming a neutron star, or it would form a exploding Chandrasekhar mass object plus an envelope of some mass around. The former would be an underluminous explosion, and the second would not imply significantly higher absolute magnitudes than the bare exploded C+O WD.
In the thermonuclear explosion of a Chandrasekhar WD, the generated kinetic energy, and the radioactive energy are linked. The larger the radioactive energy from , providing the luminosity, the highest expansion velocities have the ejecta. A fast expanding ejecta traps less efficiently the radioactive energy: thus a self–constraining interplay on the final absolute magnitude is obtained for explosions of different energies to give a maximum absolute magnitude which a Type Ia explosion could achieve. That limit corresponds to a final minimum of about 50 km s-1 Mpc-1.
An upper limit to the value of is provided by the discussion of the minimum mass of a exploding WD, and if that could correspond to what we see as SNe Ia. The exploration of the range of possible exploding WDs by various proposed mechanisms suggests that the range of what we can observe if a whole range of WDs below the Chandrasekhar mass explode is much wider than the objects we actually identify as SNe Ia. This argument disfavors larger than 75 km s-1 Mpc-1.
2.3 Model light curves and spectra
Going a step further in the theoretical examination of Type Ia supernovae, a comparison of calculated light curves and observations can led to estimate the absolute luminosity of those explosions and derive H0. The exploration of light curves of exploded WDs by Arnett, Wheeler & Branch (1985), lead to H0 60 km s-1 Mpc-1. Using the light curves in different colors and a larger set of explosion models, values of H0=67 7 km s-1 Mpc-1 are found by Höflich et al. (1997). Those authors can reproduce the above correlations by changing the explosion mode and energy of centrally ignited WD at the Chandrasekhar mass. Eastman & Pinto (1993), from their own light curve calculations, find that the magnitude decline correlation can be explained in different ways, even as a result of different total masses, by exploding sub–Chandrasekhar WDs.
Table 2: A table showing the mean absolute brightness for Type Ia SNe, and H0. Source H0 km s-1 Mpc-1 Method Saha et al. 1997 58 -19.52 0.07 SNeIa/Cepheids Hamuy et al. 1997 63 6 -19.28 0.1 SNe Ia//Cepheids Höflich & Khokhlov 1997 67 7 -19.45 0.2 SNe Ia Light Curves Ruiz-Lapuente 1996 68 13 -19.3 0.3 Late SNe Ia spectra Through the prediction of spectra of Type Ia supernovae, which are good discriminators of density and temperature, and comparison with observations, H0 is found to be 68 6 (stat) 7 (sys) km s-1 Mpc-1 (Ruiz–Lapuente 1996).
Table 4: A comparison of distance measurements for two SNe Ia by three methods used to determine H0 with SNe Ia. Supernova/galaxy Theor. light curves Theor. Late Spectra Cepheids m-M m-M m-M SN 1990N / NGC 4539 31.5 0.4 a 31.81 0.2 b 32. 0.23 c SN 1989B / NGC 4532 29.7 a 29.95 0.4 b 30.37 0.16 d a Höflich et al. 1996; b Ruiz–Lapuente 1996; c Sandage et al. 1997; d Tanvir et al. 1995
When comparing the luminosities of individual SNe Ia obtained by different methods (theoretical light curves, spectra, or through the empirical method) the results agree up to a high extent (see Table 1). This illustrates the convergence achieved during the last years. Empirical and theoretical results on H0 from SNe Ia, give values centered at 65 km s-1 Mpc-1, with up to 10 disagreement between various determinations (Table 1 and 2). Table 2 shows that the methods applied to determine distances to SNe Ia give consistent results.
3 High-z Type Ia supernovae
The previous section dealt with the absolute calibration of the luminosity of SNe Ia and the determination of the present value of the expansion of the Universe (H0). Independently of that calibration and independently of the H0 derived from it, one can use the apparent brightness of Type Ia at high z (z 0.3) to measure the global curvature of the Universe. This has been the scope of the Supernova Cosmology Project (see Hook et al. in this volume) and of the High–z Team (Leibundgut in this volume). The approach relies in that SNe Ia have observational properties which are well–understood and identical at all redshifts.
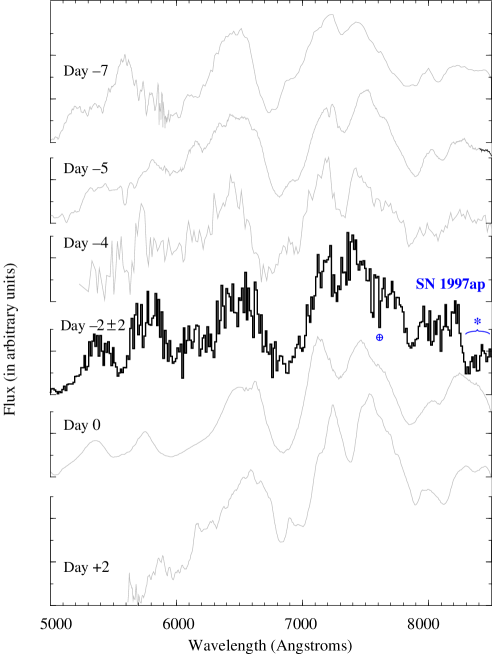
Figure 4: Spectrum of SN 1997ap at z=0.83 is shown in the rest frame compared with the spectra of nearby SNe Ia. The spectrum allow a classification of the supernova within the family of SNe Ia (Perlmutter et al. 1998; Nugent et al. 1996). Indeed, the exploration of spectra and light curves of SNe Ia shows that the high–redshift supernovae have light curve shapes and spectra like the low–redshift ones (Goldhaber et al. 1998; Perlmutter et al. 1998). It is possible to determine for each high-z SN Ia where does it lie within the family of SNe Ia studied at low redshift (see Figure 2). This is possible both spectroscopicaly and through their light curves. Lightcurve declines in terms of the stretch factor are measured in high-z SNe Ia and the correlation between brightness and rate of decline is the same as at low z. On the other hand, the family of SNe Ia form a sequence of highly resembling spectra with subtle changes in some spectral features correlated with the light curves shapes (Nugent et al. 1998).
\epsfboxgoobar4.ps
Figure 6: The m(z) relation for different choices of and , compared with an observed SN Ia with z 0.45, according to Goobar & Perlmutter (1995). SNe Ia at different z help to discriminate between the possible Universe models. In the following we will address the determination of and with high–z SNe Ia.
3.1 , and the equation of state of the Universe
The expansion rate of the Universe would slow down or speed up depending on its matter–energy content, as formulated in the Einstein field equations (Einstein 1917). It would accelerate if the vacuum energy, i.e cosmological constant term, would dominate. The first derivations of the luminosity distance of standard candles as a function of z used to combine the matter density term (density parameter) and the term (vacuum energy density term, = / 3(H0)2) in the so–called deceleration parameter (q0=1/2 - ). The value of q0 would determine whether the expansion of the Universe accelerates or decelerates. Goobar & Perlmutter (1995) showed that it is better to preserve the terms involving and separately in the luminosity distance expression for a standard candle as a function of z, since they enter with a different z dependence.
By using the magnitude–redshift relation m(z) as a function of and with a sample of high-z SNe Ia of different z, it is possible to determine the region in the – plane favored by the observations (Goobar & Perlmutter 1995). The relation goes as:
(2) where M is the absolute magnitude of the supernova, the luminosity distance, and is the K–correction (see, for instance, Goobar & Perlmutter 1995). The method is illustrated in Figure 3.
The Supernova Cosmology Project and the High–z team have presented the results of this analysis. For first time, it is found evidence for a non–zero term.
Steinhardt (1996) has pointed out that the acceleration of the expansion as due to a term could also be explained by a component with a negative pressure, whose equation of state could have any w within . Such a component, (or Q-component), would be the energy associated with a slowly evolving–down scalar field, which would be responsible for the observed acceleration in the rate of expansion of the Universe. The vacuum energy case is the simplest case with w = –1. Steinhardt (1996) shows how the m(z) solutions with non–zero cosmological constant and low could be mistaken for some solutions where vanishes and there is a significant quintessence contribution. Huterer & Turner (1998) propose to use luminosity distance to high–z SNe Ia to put constraints on the quintessence potential.
3.2 SNe Ia as cosmological candle: evolution?
Before bringing SNe Ia to enlighten early Universe physics, one may think about the present understanding of the systematic effects in those cosmological projects.
Are SNe Ia the universal candles we think they are?
So far, the Supernova Cosmology Project has found that the most distant SNe Ia in their sample are indistinguishible from the nearby ones (see Figure 2). The use of those SNe Ia gives robustness to the and results.
Besides the empirical assessment expected to grow in the next years, it is worth to debate the evolution in z of SNe Ia properties according to theoretical expectations.
3.2.1 Exploration of metallicity effects
Höflich, Wheeler & Thielemann (1998) have explored the possible outcome that various initial metallicities and ages of the WD could have in the final explosion. This investigation finds that changing the initial metallicity Z from Population I to II alters the isotopic composition of the outer layers of the supernova ejecta. The influence in the visual and blue light curves is found to be small (0.01–0.02 mag). A second effect of the age of the WD comes in the variation of C/O ratio of the WD. A decreased C/O ratio reduces the explosion energy and 56Ni production. The effect in the light curve is similar to a reduction in the deflagration to detonation transition density.
As long as the brightness–decline relationship (1) does not change with increasing z, the cosmological uses of SNe Ia are on safe ground. Somehow, it could be that all observable effects reduce to the well–known brightness–decline relationship.
3.2.2 Exploration of age–mass evolutionary effects
Within the present discussion on the evolutionary path that leads to Type Ia supernovae, Ruiz–Lapuente, Canal & Burkert (1997) have predicted a number of behaviors that would be expected when going to high redshift, depending on the way the WD is brought to explosion (sub–Chandrasekhar or Chandrasekhar explosions). A population–age effect is expected because more massive SNe Ia–progenitor binary systems will be selected for in younger populations (Ruiz–Lapuente, Burkert & Canal 1995). If the path to explosion is to reach the Chandrasekhar mass through accretion of C–O from a disrupted WD companion (merging WDs scenario), the range of differences in mass of the system before starting the accretion that would lead to explosion is of only 5 . Within this scenario, that mass difference can not lead to a significant effect. If the WD gains mass by accreting H from a non-WD companion and burning it to He and C–O, then the typical age of the system when it reaches explosion is longer (5 109 yr) and a very small mass variation between z=0 and z=0.8 is found (less than 3).
All the above suggests that we have one of the best distance indicators one could have. An object whose evolutionary effects going back half the age of the Universe are negligible because that is the typical time that the star takes to explode.
At the moment, to complete the sample of SNe Ia at various z is a prioritary goal of the project. That should allow to size the systematic uncertanties related to possible evolutionary effects, and to discriminate from other contributions in the m(z) diagram.
\epsfboxnewfigure2.ps
Figure 8: The effect of a non–zero in the number counts of SNe Ia is to increase those counts at z close to 1. This effect can only be appreciated if the global SFR is known to a precision better than a factor 1.5. 4 Further cosmological tests with SNe Ia
SNe Ia can also be used to study inhomogeneities in the matter distribution. Gravitational lensing of supernovae increase the dispersion of the SNe Ia magnitude–redshift diagram due to magnification of supernova brightness. With good statistics of supernovae it may become possible to measure the magnification distribution of the supernovae from observations, and thus determine the matter distribution. Both, continuous matter distribution, like medium scale distribtion and large scale distribution, and point–like distribution, like the mass concentration in supermassive compact objects can be examined (Holz & Wald 1997, Metcalf & Silk 1998, Wambsganss et al. 1997). Constraints on the presence of dark matter halos in the Universe up to high z can be drawn from the SNe Ia results (Metcalf 1998).
Type Ia supernovae at z 0.1 can also be used to trace cosmic flows (Riess, Press & Kirshner 1995b). By probing large scale velocity fields in the Universe an independent measure of (i.e. a combination of the density parameter and the bias factor which informs on how galaxies trace the mass distribution) can be obtained.
An independent test on the presence of comes from the counts of SNe Ia (number of SNe Ia yr -1 sqdeg-2 dz-1) as shown in Figure 4. The different comoving volume at a given z for Universe models with a non–zero and models with =0 predicts that the number of SNe Ia at z 1 would increase more rapidly in dominated universes (Ruiz–Lapuente & Canal 1998). The Supernova Cosmology Project is obtaining new values of those numbers by carefully evaluating the results of the searches at various z (Pain et al.1996).
All the precedent is a summary of the cosmological uses of SNe Ia undertaken recently, making of supernovae a field which has diversified its cosmological scope. Hopefully, the interesting prospects here mentioned will bring us definitive answers in the near future.
This work is supported by the Spanish DGES under grant PB94-0827-C02-01. It is a pleasure to thank the organizers of DARK98 for providing the opportunity to discuss this and many other interesting topics.
References
-
Arnett W.D , Branch, D., & Wheeler, J. C. 1985 Nature 314 337
-
Boisseau, J.R.,& Wheeler, J.C. 1991 AJ 101 1281
-
Branch, D. 1998 ARAA, in press
-
Eastman, R. & Pinto, P. 1993, ApJ 412 721
-
Einstein, A. 1917. S.–B. Preuss. Akad. Wiss. 142
-
Filippenko, A.V. et al. 1992a, ApJ 384 L15
-
Filippenko, A.V. et al. 1992b, AJ 104 1543
-
Goldhaber, G. et al. 1998, ApJ in preparation
-
Goobar, A.,& Perlmutter, S 1995 ApJ 450 14
-
Hamuy, M., Phillips, M.M., Schommer, R.A., Suntzeff, N.B., Maza, J., & Aviles, R. 1996a AJ 112 2399
-
Hamuy, M., Phillips, M.M., Suntzeff, N.B., Schommer, R.A., Maza, J., & Aviles, R. 1996b AJ 112 2391
-
Höflich, P. & Khokhlov, A. 1997 ApJ 457 500
-
Höflich, P., Wheeler, J.C., & Thielemann, F.K 1998 ApJ 495 617
-
Holz, D.E. & Wald, R.M. 1997, astro-ph/9708036
-
Hook, I. et al. 1998, this volume.
-
Huterer, D. & Turner, M. S 1998 astro–ph/9808133
-
Leavitt, H.S. 1912 Harvard Circular 173
-
Leibundgut, B. et al. 1993 AJ 105 301
-
Leibundgut, B. 1998, this volume.
-
Maza, J. et al. 1994 ApJ 424 L107
-
Metcalf, B. 1998 astro–ph/9803319
-
Metcalf, B. & Silk, J. 1998 ApJ 492 1
-
Nugent, P., Phillips, M. M., Baron, E., Branch, D., & Hauschildt, P. 1995, ApJ 455 L147
-
Pain R et al. 1996 ApJ. 473 87
-
Perlmutter, S. et al.(Supernova Cosmology Project) 1998 Nature 391 51
-
Perlmutter, S. et al. 1998 (Supernova Cosmology Project) ApJ submitted
-
Phillips M. M 1993 ApJ. 413 L105
-
Pskovskii, Y.P. 1977 Soviet Astronomy 21 675
-
Riess, A.G., Press, W.H., & Kirshner, R.P. 1995a ApJ 438 L17
-
Riess, A.G., Press, W.H., & Kirshner, R.P. 1995b ApJ 438 L17
-
Riess, A.G., Press, W.H., & Kirshner, R.P. 1996 ApJ 473 88
-
Ruiz–Lapuente, P. 1996 ApJ 465 L83
-
Ruiz–Lapuente, P. & Canal, R. 1998 ApJ497 L57
-
Ruiz–Lapuente, Burkert, A. & Canal, R. 1995 ApJ 447 L69
-
Ruiz–Lapuente, P., Canal, R., & Burkert, A. 1997 Thermonuclear Supernovae (Kluwer Academic Publishers) p 205
-
Steinhardt, P. 1996 astro-ph/9603072
-
Saha, A., Sandage, A., Labhardt, L., Tammann, G.A., Macchetto, F.D. & Panagia, N. 1997 ApJ 486 1
-
Sandage, A. et al. 1994 ApJ 423 L13
-
Tammann, G. 1998 Proceedings p astro-ph/9803325
-
Tammann, G. 1998 Proceedings p astro-ph/9805013
-
Tanvir, N. et al. 1995 Nature 377 27
-
Wambsganss, J. et al. 1997 ApJ 475 81
-