ASCA observations of deep ROSAT fields IV. IR and hard X-ray observations of an obscured high-redshift QSO
Abstract
We use UKIRT and ASCA observations to determine the nature of a high redshift () narrow-line AGN, previously discovered by Almaini et al. (1995). The UKIRT observations show a broad line while no line is detected. This together with the red colour () suggest that our object is a moderately obscured QSO (), in optical wavelengths. The ASCA data suggest a hard spectrum, probably due to a large obscuring column, with . The combined ASCA and ROSAT data again suggest a heavily obscured spectrum ( or ). In this picture, the ROSAT soft X-ray emission may arise from electron scattering, in a similar fashion to local Seyfert 1.9. Then, there is a large discrepancy between the moderate reddening witnessed by the IR and the large X-ray absorbing column. This could be possibly explained on the basis of e.g. high gas metallicities or assuming that the X-ray absorbing column is inside the dust sublimation radius. An alternative explanation can be obtained when we allow for variability between the ROSAT and ASCA observations. Then the best fit spectrum is still flat, , but with low intrinsic absorption in better agreement with the IR data, while the ROSAT normalization is a factor of two below the ASCA normalization. This object may be one of the bright examples of a type-II QSO population at high redshift, previously undetected in optical surveys. The hard X-ray spectrum of this object suggests that such a population could make a substantial contribution to the X-ray background.
keywords:
galaxies:active-quasars:general-X-rays:general:1 INTRODUCTION
In recent years, deep field observations with the X-ray missions ROSAT and ASCA have led to great progress in understanding the extragalactic X-ray source populations. ROSAT surveys have resolved 70 per cent of the extragalactic light at soft X-ray energies reaching a surface density of 1000 (Hasinger et al. 1998). Spectroscopic follow-up observations showed that the majority of sources are broad-line QSOs at high redshift, , (e.g. Shanks et al. 1991; Georgantopoulos et al. 1996; Schmidt et al. 1998). However, a large fraction of the X-ray sources at faint fluxes are associated with faint optical galaxies. These have narrow emission lines and X-ray luminosities ( ) orders of magnitude above those of normal galaxies (Roche et al. 1995; Griffiths et al. 1996; McHardy et al. 1998). Their hardness ratios suggest a flat spectrum, , (Romero-Colmenero et al. 1996; Almaini et al. 1996). There is strong evidence that these galaxies host an AGN as they present either high ionization lines or broad lines in their spectra (Schmidt et al. 1998).
ASCA provided us with the first images of the hard X-ray sky (2-10 keV). Due to its moderate spatial resolution it reaches a flux limit of , an order of magnitude above ROSAT , resolving about 30 per cent of the 2-10 keV X-ray background (XRB), (Georgantopoulos et al. 1997; Ueda et al. 1998). The number count distribution, , is a factor of two above the ROSAT counts, where the latter were converted to the 2-10 keV band, using an average spectral index of the ROSAT sources i.e. . This immediately suggests the presence of a population with a flat X-ray spectrum other than the broad-line QSOs which have steep X-ray spectra in the ROSAT band. Indeed, despite the difficulties in the optical follow-up due to the large position error box, there are now several examples of narrow-line AGN with hard X-ray spectrum at redshifts , (Ohta et al. 1996; Iwasawa et al. 1997; Akiyama et al. 1998; Boyle et al. 1998) These narrow line AGN may be identical to those detected in the ROSAT surveys. Their flat X-ray spectrum would then make them easily detected at hard X-ray energies. They may represent the brightest examples of high luminosity, type-II QSOs, that is the high redshift counterparts of the Seyfert 1.9 and Seyfert 2 galaxies. The existence of such a population has been debated in the last few years (e.g. Halpern et al. 1998). This population is likely to be significantly under-represented in optical QSO surveys, which are based on the presence of strong, usually blue, continua and broad emission lines. Moreover, the flat X-ray spectra of ASCA narrow-line AGN bear the promise that these belong to the long sought population which forms a substantial fraction of the XRB (e.g. Comastri et al. 1995; Madau et al. 1995).
One of the most well-known examples of the narrow-line AGN population is RXJ13334+001 at a redshift of . This was discovered in our deep ROSAT survey and its optical and ROSAT X-ray spectrum were presented in Almaini et al. (1995). It presents narrow , Civ emission lines on top of a strong UV continuum. Its ROSAT X-ray spectrum appears to be hard, , with the column density fixed to the Galactic value ; the 95 per cent upper limit on its absorbing column is when . However, the ROSAT passband and limited spectral resolution did not allow a detailed study of its X-ray spectrum. Here, we present the ASCA observations of this object extending the spectral coverage to 10 keV at the observer’s frame. In addition, we discuss observations at UKIRT, aimed at detecting broad emission lines (see also Shanks et al. 1995, 1996).
2 The Infrared Observations
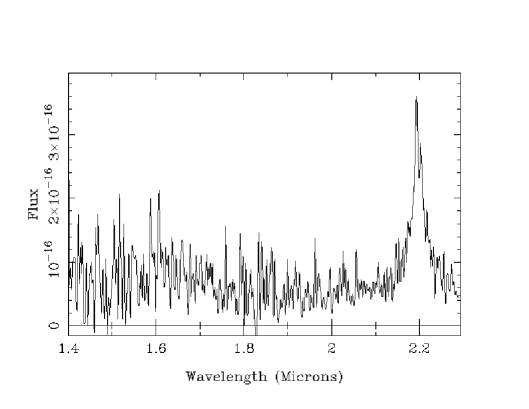
During March and May 1995, observations of RXJ13334+0001 were made at the UK Infrared Telescope in Hawaii. Photometry with IRCAM3 revealed a point-like object in arcsec seeing with a magnitude . This gives compared to for normal QSOs at this redshift (Webster et al. 1995; Barvainis 1993), suggesting magnitudes of UV extinction (although, as discussed in Section 5, the internal extinction could be significantly larger if the UV flux is dominated by surrounding star-forming activity rather than the AGN). An infrared spectrum was obtained with the aim of detecting redshifted . A short exposure was taken with the CGS4 spectrograph using a 2.4 arcsec slit. The resulting spectrum, with a resolution of is shown in Fig. 1. The broad emission line at 2.2 microns corresponds exactly to the expected position of , confirming the redshift . The full width at half maximum corresponds to , i.e. km s-1, which is entirely consistent with ordinary broad-line QSOs. Hence the UKIRT observations confirm that RXJ13334+0001 is a QSO obscured by a moderate amount of dust, sufficient to obliterate the UV broad emission lines but not the broad .
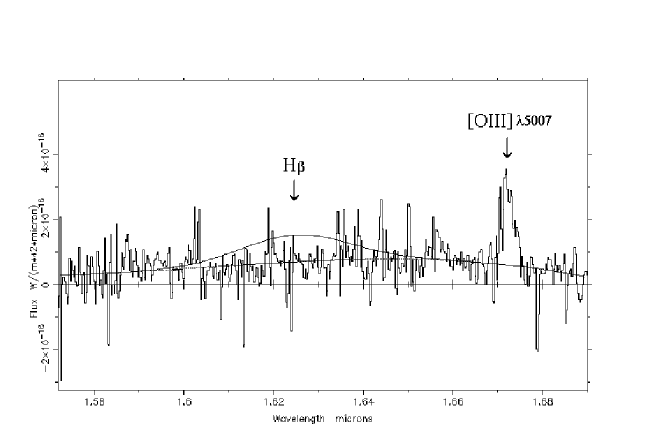
The short exposure displayed in Fig. 1 was insufficient to detect at 1.63 microns. Detection of this line would allow a direct determination of the reddening from the Balmer decrement. A deeper service observation was therefore obtained during April 1996 using CGS4 with a 2.5 arcsec slit and a 150 lines/mm grating at 2nd order, giving improved spectral resolution () over a narrow wavelength range. Broad was still not detected, but this new spectrum allowed us to place a useful upper limit on the line flux. This limit was obtained by fitting a model consisting of the continuum plus a broad line with the same width as . The continuum level was well determined by fitting a 4th order polynomial to the spectrum after excluding the [OIII] emission lines and a region either side of the expected peak of . By varying the line flux and performing a fit to the data, we obtain a limit at the confidence level. On the basis of Case B recombination (Baker & Menzel 1938) one would expect a line ratio , which is clearly inconsistent with the data (see Fig. 2). Observed broad-line QSOs have somewhat higher Balmer decrements than Case B predictions (typically ) but these are also inconsistent with RXJ13334+0001. We conclude from this limit that the broad line region is undergoing photoelectric extinction, with a lower limit .
The detection of broad but non-detection of formally classifies this object as a QSO equivalent to ‘Type 1.9’ Seyferts (Osterbrock 1981). The service observation also revealed [OIII] at microns (consistent with ) with an equivalent width of and a FWHM of km s-1. Assuming a similar width for narrow one can obtain a limit on the line ratio [OIII] (using the same technique described above). We note that this is consistent with local Seyfert 2 galaxies (Veilleux & Osterbrock 1987).
3 THE X-RAY OBSERVATIONS
This object was detected in the BJS864 field of our deep ROSAT PSPC survey (Shanks et al. 1991; Georgantopoulos et al. 1996). There are two PSPC exposures available of 50 ksec total, the first obtained in January 1993 and the second in January 1994. The ROSAT data were described in detail by Almaini et al. (1995). The 0.1-2 keV flux is , translating to a luminosity of () at the redshift of this object. Its optical position is 13h43m29.2s +00∘01’33” (J2000).
RXJ13334+001 was observed by ASCA (Tanaka, Inoue & Holt 1994) in January 1996. The net exposure after screening the data using the standard criteria (REV1), (Yaqoob 1997), is 77 ksec for the Gas Imaging Spectrometers (GIS; Tashiro et al. 1996) and 74 ksec for the Solid State Imaging Spectrometers (SIS; Gendreau 1995). The source was clearly detected by ASCA with an X-ray flux in the 2-10 keV band of . This translates to a luminosity of in the same band (). The SIS and GIS spectra were extracted from a region within 1.5 and 2 arcmin respectively of the X-ray centroid. Background data were accumulated from several source-free regions within the same field. The photons are grouped so that each channel contains a minimum of 20 counts (source plus background). The spectral analysis was performed using the XSPEC v10 package.
4 The X-ray spectral results
4.1 The ASCA fits
The spectral fits to the ROSAT data alone were presented in Almaini et al. (1995). Here, we present the spectral fits to the ASCA GIS and SIS data. Following our ROSAT results, we use a single power-law model with absorption in the QSO rest-frame. An additional absorption component was set constant to the Galactic value (). The results are given in table 1: in column (1) we give the column density in units of ; in column (2) we give the photon index ; column (3) contains the value of the divided by the number of degrees of freedom; finally, column (4) contains the probability at which the fit is acceptable. The values presented with no associated error bars were kept constant during the spectral fit. All uncertainties given correspond to the 90 per cent confidence level.
| () | prob. | ||
|---|---|---|---|
| 34.3/39 | 0.69 | ||
| 1.56 | 36.1/40 | 0.64 | |
| 0 | 39.6/40 | 0.49 | |
| 0 | 1.56 | 42.7/41 | 0.40 |

The best-fit model has a steep photon index, , albeit with a large uncertainty; this is consistent with the spectral slope of nearby AGN (Nandra & Pounds 1994). However, the absorbing column is large with . The confidence contours for these parameters are given in Fig. 3. It is evident that the ASCA data favour a hard spectrum: the error contours show that and are correlated in the sense that we obtain either a steep power-law with a large absorbing column or a flat power-law with a moderate column. Thus, when we fix the column density to , we obtain a flat spectral index . Finally, we fix both the column density and the power-law to the values obtained from the ROSAT data alone (). We see that the ROSAT best-fits are not rejected by the ASCA data. In conclusion, the ASCA data favour a hard spectrum, in agreement with the ROSAT data. However, with the current photon statistics it is not clear whether this hard spectrum is due to a flat spectral index or a high amount of photoelectric absorption.
4.2 The ROSAT-ASCA joint fits
Next, we combine the ROSAT with the ASCA data. Thus, we extend the spectral coverage from 0.3-33 keV at the emitter’s rest-frame and also we improve substantially the photon statistics. We first use a simple model, i.e. a power-law model with absorption both at the emitter’s rest-frame and the Galaxy. The Galactic column density is fixed at as before. The results are presented in table 2: column (1) gives the column density at the emitter’s rest frame in units of ; column (2) gives the photon index; column (3) gives the covering factor in the case of the scattered power-law model (see below); column (4) lists the and the number of degrees of freedom; while column (5) gives the probability that the model is acceptable.
| () | cov. factor | prob. | |||
|---|---|---|---|---|---|
| Single power-law (ASCA-ROSAT norm. tied ) | - | 71.7/55 | 0.06 | ||
| Single power-law (ASCA-ROSAT norm. tied) | 0 | - | 73.0/56 | 0.06 | |
| Single power-law (ASCA-ROSAT norm. untied) | 0 | - | 59.4/55 | 0.32 | |
| Scattered power-law | 50.4/53 | 0.67 |
The best-fit photon index is hard with an appreciable error, while a large column density is again favoured by the data. Although, the best-fit model does not provide an excellent fit to the data, it cannot be strongly rejected at a high level of significance (only at the confidence level). When we fix the column density to we obtain a very flat spectral index, . Next, we leave the ASCA and ROSAT normalizations untied. The reduced is significantly improved compared to the previous model (at over the 99.9 confidence level for one additional parameter, according to the F-test, Bevington & Robinson 1995). However, the ASCA normalization is higher than the ROSAT normalization by a factor of two (3.4 and 1.7 at 1 keV respectively). This difference is significant at the 99.9 confidence level. It is highly unlikely that this discrepancy is due to calibration uncertainties in the ASCA or ROSAT instruments. In contrast, it is likely that this could be due to flux variability of our object between the ASCA and the ROSAT epochs. Note that the underlying assumption in our spectral fits was that there is no spectral variability as the ROSAT photon index was set equal to the ASCA index. A third possibility is that the soft flux has indeed lower normalization as it could leak through a partial coverer or it could be scattered emission. This geometry probably applies to obscured AGN (e.g. Turner et al. 1997). According to this standard model, the soft X-rays are obscured from view by a thick torus while the hard X-rays can penetrate through the absorbing material. Then the soft X-rays could be scattered emission on a pure electron medium. Then the scattered power-law should have the same slope as the hard power-law. The best fit results for this model are given in table 2: We see that we obtain a good compared to the single power-law model, where the ASCA and ROSAT normalizations are tied together. Using the F-test we find that the change in the is statistically significant at over the 99.9 confidence level. The best-fit model favours a steep power-law, , with a large column density, . The covering fraction is around 90 per cent, comparable to the values obtained in intermediate type Seyfert galaxies, e.g. Seyfert 1.9 (e.g. Turner et al. 1997). In Fig. 4 we present the confidence contours for the photon index and the column density for the model above while in Fig. 5 we give the folded spectrum together with the data residuals from the fitted model (the data have been binned for clarity).


5 DISCUSSION
The broad line detected shows that this object is an obscured AGN. Therefore this QSO may be a bright example of a type-II QSO population which avoids detection in the optical surveys. Interestingly, this object presents UV excess but it would not be classified as a QSO as it does not present broad lines in its optical spectrum. There is no line detected and this implies a reddening of at least . Note however, that the reddening cannot be much higher than the value above; if as the X-ray spectral fits suggest, then the line would be obliterated as well. This is consistent with the moderately red colour () of this object; here we assumed that the relative AGN and host galaxy contributions are the same in the and the band. It is therefore a puzzle how the UV continuum is emerging unattenuated. One possibility is that a powerful star-forming galaxy hosts the QSO. Then, the QSO UV emission is completely obscured due to large amounts of dust while we are observing the UV continuum of the starburst. Even in this case, the highly ionized Civ () and lines cannot originate from star-forming processes. Another possibility is that the UV emission we observe is scattered light from the nucleus (Kinney et al. 1991). Then however, as the scattered fraction is usually of the order of a few percent, the unobscured total UV emission would be abnormally high.
Our ROSAT data suggested a hard spectrum of . The ASCA data alone confirm the ROSAT findings. They show a flat spectrum, although it is difficult to disentangle whether this is due to a flat power-law or a large absorbing column. The joint ROSAT -ASCA spectrum again favours a hard spectrum. Although a single power-law with high intrinsic absorption (, ), cannot be strongly rejected, the data prefer a ROSAT power-law normalization below the ASCA normalization. This could be attributed to variability between the ASCA and the ROSAT epochs. Indeed, there is some tentative () evidence for variability even between the two ROSAT observations (see Almaini et al. 1998). If this is the case then a single flat power-law model with no intrinsic absorption would fit the data. The best fit power-law spectrum is again hard () very different from the spectrum of radio-quiet QSOs in ASCA which have (Reeves et al. 1997). Alternatively, if we do not allow for variability between the ASCA and the ROSAT data we can fit the spectrum using a “scattered” power-law model i.e. adding a soft power-law component with slope identical to that of the hard power-law. The amount of the hard flux relative to the scattered flux is given by the covering factor. This model describes well the X-ray spectra of local obscured Seyfert galaxies (e.g. Seyfert 1.9 galaxies). We obtain a best fit column density of while the spectral slope is ; the covering factor is high (). These values are consistent with those obtained for local obscured Seyfert galaxies (Turner et al. 1997). There may be a problem however with this interpretation. The derived column density ( corresponds to according to Bohlin et al. 1978) is much higher than the column inferred from the Balmer decrement (); note that although the Balmer decrement gives only a lower limit to the visual extinction, cannot be much greater than the above value of 3 magnitudes, as then the line would be obliterated. The same discrepancy is observed in some Seyfert 2 galaxies (e.g. Veilleux et al. 1997; Simpson 1998). Veilleux et al. suggest several possibilities to resolve this. The broad lines may originate at much larger distances from the nucleus where the X-ray emitting region is probably situated. Then the X-rays would view a larger column compared to that viewed by the broad-line region. Alternatively, as the X-rays are absorbed by heavy elements while the optical light is absorbed by dust, a large gas-to-dust ratio or a metallicity much higher than solar could alleviate the discrepancy. For example, the former would be the case in the model of Granato, Danese & Franceschini (1997) where the absorbing column is inside the dust sublimation radius.
A few other obscured AGN have been detected in the ASCA surveys but at lower redshift () and only on the basis of high excitation narrow lines (Ohta et al. 1996; Akiyama et al. 1998; Boyle et al. 1998). This population does not come as a great surprise. It was well-known that some narrow-line radio galaxies present broad emission lines in the IR and therefore they are hidden radio-loud QSOs (Economou et al. 1995; Hill et al. 1996). These objects tend to have flat X-ray spectra probably due to an additional beamed component (e.g. Reeves et al. 1997). However, our object is not a powerful radio emitter. It is not detected in the NVSS survey (Condon et al. 1998), thus having flux less than 2.5mJy at 1.4 GHz; this translates to a radio-optical spectral index (Zamorani et al. 1981) of . Although deeper radio observations are necessary in order to measure its radio power, it is likely that our object represents the first radio-quiet counterpart of these high redshift radio galaxies. The hard X-ray spectrum of this object, similar to the spectrum of the XRB in the 2-10 keV band (e.g. Gendreau et al. 1995), suggests that such an obscured AGN population may make a significant contribution to the XRB.
6 conclusions
We have presented near-IR and hard X-ray (ASCA ) spectra of the obscured, high-redshift, , AGN RXJ13334+0001. This object presents only narrow emission lines in its rest-frame UV spectrum. However, a broad line in the UKIRT spectrum clearly classifies this object as a QSO. The absence of a broad line suggests a moderate amount of reddening (not much higher than otherwise the line would be obliterated as well) in agreement with the red colour () obtained with IRCAM3.
The ASCA data favour a flat or absorbed spectrum. The best-fit spectrum has with the power-law being rather unconstrained, . Combining the ROSAT with the ASCA data, keeping the ASCA equal to the ROSAT normalization, we obtain again a similar hard spectrum with , . However, the above model is acceptable at only the 6 per cent confidence level. A (statistically significant) better fit is obtained when we use a scattered power-law model (hard power-law plus scattered soft power-law). The best fit spectrum shows a high absorbing column with and a covering fraction of 0.9. This is very similar to the spectrum of obscured Seyfert nuclei. However, the derived column density is far above the value obtained from the UKIRT data alone. This discrepancy is not uncommon in obscured Seyfert galaxies and it can be resolved on the basis of eg high gas metallicities, high gas-to-dust ratios, or simply considering that the X-rays originate from the nucleus while the broad line region is located further away. Alternatively, the discrepancy between the columns viewed in X-rays and in the IR can be alleviated if we allow for variability between the ASCA and the ROSAT epoch. Then the best fit X-ray spectrum is while there is no evidence for a large absorbing column in better agreement with the UKIRT findings.
Our object may be one of the first examples of a radio-quiet, type-II QSO. This population with properties similar to those of obscured Seyfert galaxies locally, remains undetected in optical UVX surveys. However, it could be readily detected in hard X-ray, the far-IR and mm part of the spectrum where obscuration effects are less important. Indeed, there are now several examples of obscured type-II AGN in the ASCA surveys. Future surveys with the AXAF and XMM X-ray missions are expected to reveal large numbers of these obscured AGN and to provide much better constraints on their X-ray spectrum and number density.
7 Acknowledgements
We thank the referee X. Barcons for his usefull suggestions. We thank S.J. Rawlings (Univ. of Oxford) for his assistance in the taking and reducing of the UKIRT CGS4 data. IG thanks the Institute for Astronomy at Edinburgh for their hospitality. We also thank A. Lawrence, J. Dunlop and C. Done for many useful discussions. This research has made use of data obtained through the HEASARC online services, provided by the NASA Goddard Space flight Center. The optical data were obtained at the Anglo-Australian and the UKIRT telescope.
References
Akiyama, M. et al., 1998, ApJ, 500, 173
Almaini, O., Boyle, B.J., Griffiths, R.E., Shanks, T., Stewart, G.C.,
Georgantopoulos, I., 1995, MNRAS, 277, L31
Almaini, O., Shanks T., Boyle B.J., Griffiths R.E., Roche N., Stewart G.C.
& Georgantopoulos I., 1996, MNRAS 282, 295
Almaini, O., et al., 1998, MNRAS, submitted
Baker J.G. & Menzel D.H., 1938, ApJ, 88, 52
Barvainis R., 1993, ApJ, 412, 513
Bevington P.R. and Robinson D.K., 1992, Data reduction and error analysis
for the physical sciences, 2nd ed.
Bohlin, R.C., Savage, B.D., Drake, J.F., 1978, ApJ, 224, 132
Boyle, B.J., Almaini, O., Georgantopoulos, I., Stewart, G.C., Shanks, T.,
Griffiths, R.E., Gunn, K., 1998, MNRAS, 297, L53
Comastri, A., Setti, G., Zamorani, G., Hasinger, G., 1995, AA, 296,1
Condon, J.J., Cotton, W.D., Greisen, E.W., Yin, Q.F., Perley, R.A.,
Taylor, G.B., Broderick, J.J., 1998, AJ, 115, 1693
Economou, F., Lawrence, A., Ward, M.J., Blanco, P.R., 1995, MNRAS, 272, L5
Gendreau, K., 1995, Ph.D. thesis, MIT
Georgantopoulos, I., Stewart, G.C., Shanks, T., Boyle, B.J., Griffiths, R.E.,
1996, MNRAS, 280, 276
Georgantopoulos, I., Stewart, G.C., Blair, A.J., Shanks, T., Griffiths, R.E.,
Boyle, B.J., Almaini, O., Roche, N., 1997, MNRAS, 291, 203
Granato, G.L., Danese, L., Franceschini, A., 1997, ApJ, 486, 147
Halpern, J.P., Eracleous, M., Forster, K., 1998, ApJ, in press
Hasinger, G., Burg, R., Giacconi, R., Schmidt, M., Trumper, J., Zamorani, G.,
1998, AA, 329, 482
Hill, G.J., Goodrich, R.W., De Poy, D.L., 1996, ApJ, 462, 163
Iwasawa, K., Fabian, A.C., Brandt, W.N., Crawford, C.S., Almaini, O., 1997,
MNRAS, 291, L17
Kinney, A.L., Antonucci, R.R.J., Ward, M.J., Wilson, A.S.,
Whittle, M., 1991, 377, 100
Madau, P., Ghisellini, G., Fabian, A.C., 1994, MNRAS, 270, L17
McHardy, I.M., et al., 1998, MNRAS, 295, 641
Nandra, K., Pounds, K.A., 1994, MNRAS, 268, 405
Ohta, K., Yamada, T., Nakanishi, K., Ogasaka, Y., Kii, T., Hayashida, K.,
1996, ApJ, 458, L57
Osterbrock D.E., 1981, ApJ, 249, 462
Reeves, J.N., Turner, M.J.L., Ohashi, T., Kii, T., 1997, MNRAS, 292, 468
Shanks, T., Georgantopoulos, I., Stewart, G.C. Pounds, K.A., Boyle, B.J.,
Griffiths, R.E., 1991, Nature, 353, 315
Shanks, T., Almaini, O., Boyle, B.J., Done, C., Georgantopoulos, I.,
Griffiths, R.E., Rawlings, S., Stewart, G.C., 1995, Spectrum, 7, 7
Shanks, T., Almaini, O., Boyle, B.J., Della-Ceca, R., Done, C.,
Georgantopoulos, I., Griffiths, R.E., Rawlings, S.J., Roche, N.,
Stewart, G.C., 1996, In Roentgensstrahlung from the Universe, MPE Report 263,
Eds. Zimmermann, H.U., Trumper, J.E. and Yorke, H., p. 341
Simpson, D., 1998, ApJ, in press
Stark A. A. et al. , 1992, ApJS, 79, 77
Tanaka Y., Inoue H., Holt S.S., 1994, PASJ, 46, 37L
Tashiro O. et al., 1996, PASJ, 438, 157
Truemper J., 1983, Adv. Sp. Res., 2, 241
Turner, T.J., George, I.M., Nandra, K., Mushotzky, R.F., 1997, ApJ, 488, 164
Veilleux S., Osterbrock D.E., 1987, ApJS, 63, 295
Veilleux, S., Goodrich, R.W., Hill, G.J., 1997, ApJ, 477, 631
Webster, R., Francis, P.J., Peterson, B.A., Drinkwater, M.J., Masci, F.J.,
1995, Nature, 375, 469
Yaqoob T. et al. , 1997, The ASCA ABC Guide, v2.0, NASA/GSFC
Zamorani, G. et al., 1981, ApJ, 245, 357