SPECTRO-PHOTOMETRIC CONSTRAINTS ON GALAXY EVOLUTION WITH NGST
Abstract
The Next Generation Space Telescope (NGST) will
gather unprecedented spectro-photometric data on galaxies
out to the highest redshifts. It is therefore crucial to identify the
spectro-photometric diagnostics within reach of NGST, which will allow
us to best constrain the history of star formation and evolution of galaxies.
The primary parameters
to be determined are the ongoing rate of star formation and stellar mass
of galaxies at all redshifts. In this context, we briefly review the
reliability of various star formation rate and mass estimators
of galaxies in a full range of redshifts, with particular emphasis on the
relative merits of optical versus near- to mid-IR observations.
1. INTRODUCTION
NGST will explore unknown domains in the field of galaxy evolution (see other contributions in these proceedings). Here, we focus on the scientific drivers for these observations from the point of vue of models designed to interpret galaxy light (from stars and gas) in terms of physical parameters such as the star formation rate (hereafter SFR), mass, metallicity, age, and initial mass function (hereafter IMF). Two main points need to be addressed. First, since NGST will open a window on the rest-frame UV to optical light of galaxies at , one must identify, based on models of the UV to near-IR emission of nearby objects, the best tracers to constrain the physical properties of the most distant galaxies. Second, since NGST will also open a new window on the less familiar near-to-mid IR emission from nearby galaxies, it is crucial to identify whether valuable predictions can be made in this spectral range. In particular, there may be unexplored spectral features useful for photometric redshift determinations, which could help to compensate for the expected limited coverage of NGST instruments in the optical.
2. CURRENT STATE OF AFFAIRS IN SPECTRAL MODELS
Figure 1 shows the spectral energy distribution of a model galaxy in the wavelength range m that is potentially relevant for NGST observations of galaxies at all redshifts. The model corresponds to a 0.5 Gyr old stellar population with constant SFR, solar metallicity, and a Salpeter IMF as computed using the Bruzual & Charlot (1993, 1998) population synthesis code. Nebular emission was computed using G. Ferland’s (1996) CLOUDY code, and it includes the contribution by dust. We now address the reliability of the models in various spectral regions.

Much previous work in the spectral modeling of galaxies has focused on the m wavelength domain. The main reason for this is that the stellar spectral libraries that were assembled to build the models and the observations of galaxies the models were aimed to interpret were mainly gathered at wavelengths m (see Leitherer et al. 1996, and references therein). A complete review of the achievements of population synthesis models in this spectral range is beyond the scope of the present contribution (see, e.g., Charlot 1996a for a slightly more detailed description). The most general conclusions are that spectro-photometric fits of galaxies suffer from several degeneracies. First, there is a degeneracy between age and star formation timescale of models reproducing a given spectral continuum shape, and hence, given colors. This follows from the fact that the continuum shape is essentially driven by the ratio of blue to red stars in a galaxy, i.e., the ratio of young to older stars. Second, there is a degeneracy between age and metallicity in the solutions to spectral fits of galaxies. At fixed age, a more metal-rich stellar population will appear redder and fainter than a more metal-poor one, while at fixed metallicity, colors redden with age. Finally, extinction by dust introduces an additional degeneracy in the solutions to spectro-photometric fits of galaxies. The reason for this is that dust and metallicity (or age) vectors are roughly parallel in many color-color diagrams.
It is worth pointing out that within the framework of a specific population synthesis model, finer spectro-photometric diagnostics can be built from the m emission of a galaxy to constrain the past history of star formation (in particular, by involving three-color diagrams). In practice, however, the changes in photometric colors or line-index strength on which such finer diagnostics rely are more subtle than the typical discrepancies between the predictions of different models for the properties of stellar populations with fixed parameters (Charlot et al. 1996; Charlot 1996b). With current spectral models, therefore, reconstructing the detailed history of past star formation from the integrated light of galaxies appears to be difficult. An alternative and perhaps more promising approach would be to focus on the few parameters that are generically best constrained from the integrated light of galaxies, such as the ongoing SFR and stellar mass, and to try and determine these parameters in galaxies at all redshifts. The important question, then, is to identify the best tracers of these quantities to be selected for NGST studies.
Predictions of spectral models are more uncertain in the m wavelength domain. There are several reasons for this. First, the late phases of stellar evolution are difficult to model because, for example, of the uncertain influence of mass loss on the red giant branch, the difficult treatment of convection during core-helium burning, and the occurence of thermal pulses near the tip of the asymptotic giant branch (AGB). Moreover, spectral (color-temperature) calibrations of theoretical stellar models are difficult to achieve for cool stars. Empirically, determinations of temperatures, at least by means of lunar occultation, are limited by the scarcity of cool stars in the solar neighborhood. Spectra of M giants are also difficult to model theoretically because they are blanketed mostly by molecular opacity and because their atmospheres tend to be very extended. Since the advanced stages of stellar evolution are also the brightest, these uncertainties limit our ability to model the integrated spectra of galaxies in the near-IR. For example, AGB stars are the main contributors to the integrated near-IR light of stellar populations at ages around Gyr.
Young stellar objects (YSOs) are other potential contributors to the near-IR light of young galaxies. Pre-main sequence (hereafter pre-MS) evolution of massive stars has generally been ignored in studies of stellar populations by lack of sufficient observational constraints. Also, the pre-MS evolution of massive stars was once considered to be very short, about 1% of the MS evolution (Maeder 1996, and references therein). Revised models based on the accretion scenario of Palla & Stahler (1993, and references therein) predict that stars more massive than could accrete surrounding matter for much longer than the standard contraction times, and for almost as long as the usual MS lifetimes (Bernasconi & Maeder 1996). Hence, young massive stars could have burnt a substantial fraction of their central hydrogen by the time they emerge from their parental clouds. This appears to be supported by new statistics on the observations of young O-type stars (see, e.g., Maeder 1996 for a review).
There is direct observational evidence that the inclusion of evolved AGB (in particular, carbon-enriched) stars and young stellar objects could significantly modify the predicted spectrum of Figure 1 at wavelengths m. Lançon & Wood (1997) have performed repeated optical-infrared (m) spectroscopy of luminous, pulsating AGB variables in the Galaxy and LMC in order to obtain period-averaged predictions for population synthesis models. Preliminary results indicate that the spectral energy distributions of these stars does not follow the pronounced decrease in predicted around the P wavelength in Figure 1. Also, m spectroscopy of a sample of massive YSOs by Porter et al. (1998) shows in some cases a marked increase of the spectral energy distribution in the same region. These observations are still too rare to be implemented consistently in stellar population synthesis models. Among the major difficulties to be faced, it appears that the ratio of luminous carbon stars to oxygen-rich (bluer, M-type) stars highly depends on metallicity (Habing 1996, and references therein). The need for more accurate predictions in preparation for future near-to-mid infrared surveys, however, triggers important efforts on both theoretical and observational sides.
At wavelengths redward of m the spectral energy distribution of a galaxy can be significantly affected by dust emission (see the contributions by D. Elbaz and by J.-L. Puget in these proceedings). The amount of m emission, however, can vary significantly from galaxy to galaxy in no clear relation with other properties such as morphological type or optical-IR spectral type. This can be appreciated for example from recent observations with the Infrared Space Observatory (ISO) of a complete, optically-selected sample of 99 galaxies in the Virgo cluster by Boselli et al. (1998). The near- to mid-IR colors of the galaxies exhibit wide variations, even at similar optical to near-IR color (see Fig. 9 of their paper). The amplitude of these variations is illustrated by the two possible shapes of the spectral energy distribution of the model galaxy spectrum in Figure 1 at wavelengths m.
Hence, current uncertainties in the modeling of the rest-frame near- to mid-IR spectral energy distribution of galaxies prevent us from making reliable predictions for studies of nearby galaxies with NGST. One of the consequences of this limitation is that strong spectral features that could be present at wavelengths m (Figure 1) cannot yet be used to develop photometric redshift techniques for NGST. We will return to this point in §5. In the meantime, improving our ability to model this spectral domain is becoming a top priority in population synthesis studies. Dedicated observations to gather the required stellar libraries with current infrared spectrographs is the first necessary step towards such an improvement.
3. SELECTING THE BEST STAR FORMATION ESTIMATORS
The most reobust star formation estimators must be identified to warrant the best constraints on galaxy formation and evolution to be extracted from NGST observations. Commonly used SFR estimators are hydrogen recombination lines (e.g., H), collisionally excited oxygen lines ([OII], [OIII]), the ultraviolet continuum from young massive stars (e.g., at 1500 Å, at 2800 Å), and the far-infrared radiation from dust heated by young stars (e.g., Kennicutt 1992; Meurer et al. 1995; Lilly et al. 1996; Madau et al. 1996). With NGST it will also be possible to use near-IR hydrogen recombination lines such as P at 1.88m as ordinary SFR estimators in nearby galaxies. We do not discuss here H-Ly emission as a star formation estimator because resonant scattering of Ly photons by neutral atomic hydrogen dramatically affects their relation to the SFR in a galaxy (see, e.g., Charlot & Fall 1993 for a review). Also, since we are interested in measurements of the star formation properties of galaxies from observations at m, we do not discuss here the far-infrared radiation by dust grains (see, e.g., Meurer et al. 1995 and references therein).
Evaluating the reliability of the above SFR estimators is difficult because nebular properties are expected to greatly vary from galaxy to galaxy, and even within a single galaxy. An idea of the relative sensitivity of the different estimators to model assumptions may be obtained by examining the range in SFR-to-light conversion factors predicted by a wide range of models reproducing the observed properties of nearby HII regions and galaxies. We are in the process of completing such a study (Charlot & Longhetti 1998), based on a combination of the Bruzual & Charlot (1998) population synthesis code and the latest version of Ferland’s (1996) photoionization code CLOUDY. This involves considering a range of stellar evolution prescriptions, IMFs, star formation histories, metallicities (taken to be the same for the stars and gas), characteric masses of ionizing star clusters in galaxies, gas densities in HII regions, and dust contents of HII regions. Typically, logarithmic ionization parameters are comprised between and , and the filling factor of the gas in HII regions ranges from a few times 0.01 to nearly 1.
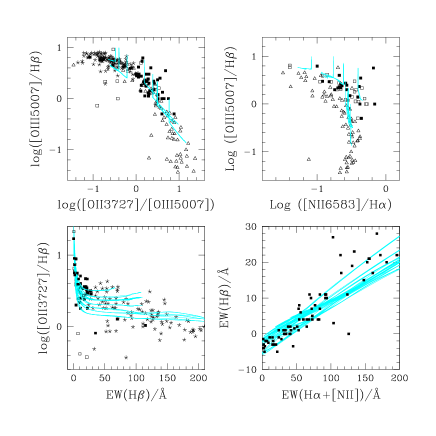
Figure 2 shows examples of models reproducing the nebular emission line properties of nearby HII regions and galaxies. The different panels correspond to various combinations of flux ratios and equivalent widths involving the H, H, [OII], [OIII], and [NII] lines. Also shown in Figure 2 are the observations of nearby HII regions and galaxies from the samples of Kennicutt (1992), McCall et al. (1985), and Stasińska & Leitherer (1996). Since emission line intensities depend primarily on the amount of ionizing radiation from short-lived, massive stars, models with different past star formation histories and fixed other parameters lead to similar line flux ratios in Figure 2. The predicted H and H equivalent widths are different, however, since these are weighted by the continuum intensity from older stars. Figure 2 also shows that stellar absorption at H dominates over nebular emission in galaxies with declining star formation rates, leading to negative net equivalent widths (see also Kennicutt 1992). A detailed discussion of Figure 2 and of the dependence of the predicted nebular emission on the various model parameters can be found in Charlot & Longhetti (1998). Our main purpose here is to show that the models sample reasonably well the range of nebular properties of nearby HII regions and galaxies, and hence, that they represent a useful basis for testing the reliability of commonly used star formation estimators.
We now report preliminary results on the implications of this study for SFR estimates in galaxies. We refer the reader to Charlot & Longhetti (1998) for a more complete analysis. Figure 3 shows the range conversion factors predicted by the models described above, where stands for either , , , , , or . We do not discuss here the weaker, higher-order Balmer lines as SFR estimators since these can be seriously contaminated by stellar absorption (even at H; see, e.g., Figure 2). The results are expressed for each estimator in units of the reference value corresponding to a stellar population with constant SFR, solar metallicity, no dust and a Salpeter IMF truncated at 0.1 and 100. A first impression from Figure 3 is that , and are potentially stable star formation estimators, with uncertainties of a factor of only 3 in despite the large variations in model parameters. The luminosity, on the other hand, stands out as a rather poor star formation estimator, essentially for two reasons. First, it can be substantially contaminated by the emission from older stars in galaxies with declining star formation rates. And second, it is more sensitive to metallicity than the luminosity. As expected, the collisionally-excited oxygen lines lead to larger values in models with low metallicities because of the higher implied gas temperatures (e.g., Kennicutt 1992). The effect is stronger for than for .
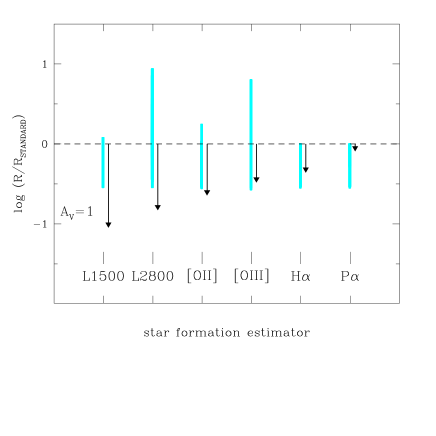
Extinction by dust outside the HII regions can seriously affect the accuracy of star formation estimators in the ultraviolet. For illustration, we show by downward arrows in Figure 3 the effect of extinction by a screen of Galactic-type dust with . The corresponding drop in the emission at 1500 Å, and hence in , amounts to a factor of 10. Also, as emphasized by Pettini et al. (1998; see also the contribution by Dickinson in these proceedings), uncertainties in the extinction curves of distant galaxies have dramatic implications for corrections of the 1500 Å emission. Additional uncertainties arise from the dependence of dust extinction on the topology of the interstellar medium in a galaxy and on the relative mixing of stars, gas and dust (e.g., Witt et al. 1992).
In the end, the most robust star formation estimators in Figure 3 appear to be the H and P recombination lines of hydrogen. It worth pointing out that these may also be contaminated by nonthermal sources of radiation in galaxies, which could be systematically more important at high redshifts than locally (e.g., Tresse et al. 1996). The presence of an active galactic nucleus in a galaxy, however, should have other readily identifiable signatures, such as large velocity widths and strong emission lines of highly-ionized species. Finally, we note that the uncertainties in SFR estimates of galaxies may be reduced by constraining simultaneously two or more of the estimators in Figure 3. We are investigating this effect (see Charlot & Longhetti 1998).
4. SELECTING THE BEST STELLAR MASS ESTIMATORS
Dynamical mass estimates will be achievable for a subset of galaxies observed with NGST from either line width, rotation curve, or galaxy-galaxy lensing measurements (see, e.g., the contributions by Schneider and Stiavelli in these proceedings). Stellar mass estimates, however, remain important since they will be within reach for many more galaxies, especially at the faintest magnitudes. Also, stellar mass relates more directly than dynamical mass to the past history of star formation in galaxies, and hence, it provides complementary constraints on the efficiency of star formation as a function of dynamical environment.
The most commonly used stellar mass estimators of galaxies are the photometric optical and near-IR magnitudes. By analogy with our approach in the previous section, we can evaluate the relative accuracies of the and estimators in various redshift ranges by considering the variations of these quantities among models in a wide range of metallicities and star formation histories. We do not include nebular emission here since it negligibly affects the integrated and magnitudes of galaxies older than a few times yr (e.g., Charlot & Longhetti 1998). At earlier ages, before the first red supergiants appear, the contribution to near-IR light by hydrogen recombination continuum can significantly affect the predicted optical to near-IR colors of stellar populations (e.g., Leitherer & Heckman 1995). However, this has no implication for the results shown below because the corresponding ratios are intermediate between those derived for stellar populations in which the near-IR light is dominated by either red supergiants or old, red giants.
In Figure 4 we show the ranges in rest-frame and ratios of a comprehensive set of model galaxies sampling widely different star formation histories (a few) and metallicities (). Such models have been checked to reproduce the observed optical to near-IR properties of galaxies of different spectral types at various redshifts (Bruzual & Charlot 1998, and references therein). Since the main effect of varying the IMF on this diagram is to change to overall normalization of the mass-to-light ratios by changing the fraction of the total mass in faint stars, we have adopted a standard Scalo IMF truncated at 0.1 and 100 . A Salpeter IMF with the same lower cutoff would give ratios a factor of higher. Also indicated in Figure 4 is the separation between models younger and older than 0.5 Gyr. Galaxies younger than 0.5 Gyr are expected to be rare at modest redshifts, and hence, including these models in Figure 4 tends to overestimate the uncertainties associated to local stellar mass estimates from photometric light. Extremely young galaxies, however, must be included to interpret NGST observations at redshifts when the universe was less than a billion years old.
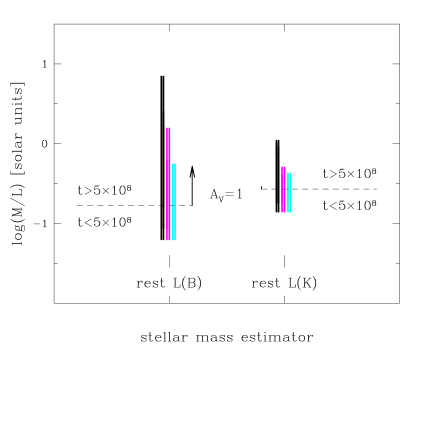
Figure 4 inspires two main reactions. First, as expected, the rest-frame -band light is found to be a less reliable tracer of stellar mass than the rest-frame -band light, by a factor of about 20 at . The reason for this is that the emission in the band is dominated by the brightest main-sequence stars, whose characteristic luminosity decreases steadily as a stellar population ages. In contrast, a conspiracy in the post-main sequence evolution of stars helps to maintain the -band light at a roughly constant level in an ageing stellar population (e.g., Charlot 1996a). Perhaps the most instructive feature of Figure 4 is the illustration that at high redshifts, mass estimates from the rest-frame -band light are improved with respect to estimates since stellar populations in distant galaxies cannot be older than the universe. For example, at the range in spanned by the models is a factor of 10 smaller than at , while at the allowed range in is less than a factor of 3. The near-IR light remains a better tracer of stellar mass than the optical light at all redshifts, but the difference in accuracy between the two estimators reduces with redshift, to reach less than 50% at .
Therefore, although is confirmed to be a much better tracer of stellar mass than in galaxies at redshifts up to a few, estimates based on the rest-frame optical light at higher redshifts should be far more reliable than locally. Extinction by dust, however, will affect -band emission more significantly than -band emission in galaxies (see Figure 4). On the other hand, potential contributions to the rest-frame near-IR emission by carbon stars (especially at the low metallicities of distant galaxies) and young stellar objects can affect the reliability of as a stellar mass estimator (see §1). It is worth mentioning again that the results of Figure 4 were computed by adopting the local Scalo IMF for all model galaxies. There is growing observational evidence, however, that the IMF might vary as a function of environment in galaxies (e.g., Scalo 1997, and references therein). Thus, the tight constraints on the low-mass end of the IMF that will be obtained with NGST in nearby stellar populations (see, e.g., the contribution by Beckwith in these proceedings) will have crucial implications for stellar mass estimates in the most distant galaxies.
5. DISCUSSION AND CONCLUSIONS
The arguments presented in the previous sections can be used to better assess the implications of future NGST observations for constraining the evolution of galaxies. To visualize this we plot in Figure 5 the model spectral energy distribution of the star-forming galaxy computed in Figure 1 as seen at different redshifts through NGST’s m observational window. We have included absorption by the Ly forest of rest-frame emission blueward of Ly according to the prescription of Madau (1995).
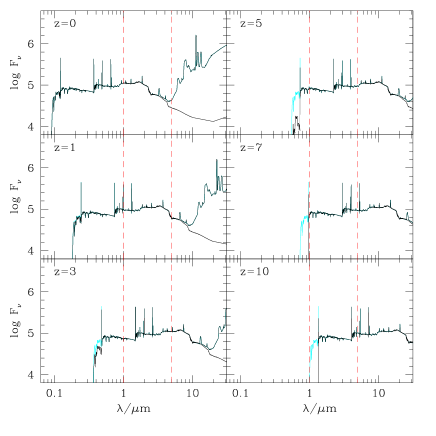
Figure 5 shows that accurate SFR estimates will be possible with NGST for galaxies out to based on P and H flux measurements. At larger redshifts, one must appeal to higher-order Balmer lines or to the ultraviolet emission from young stars to estimate SFRs within the available m spectral window. As noted above, however, these alternative estimators suffer from larger uncertainties than the P and H lines. Figure 5 also shows that direct measurement of the rest-frame near-IR emission will lead to accurate stellar mass estimates for galaxies out to . At higher redshifts the potential 5m redward boundary of the NGST observational window falls into the rest-frame optical. As argued in §3, this might not have a dramatic impact on mass estimates since the accuracy of optical estimators is expected to increase with redshift. In particular, at , when the universe is only a few yr old, mass estimates from the rest-frame -band emission should still be fairly reliable provided that the galaxies are not heavily obscured by dust.
Widening the observational window of NGST toward larger wavelengths would help to improve SFR and mass estimates of galaxies at redshifts . An extension toward shorter wavelengths, however, presents other advantages. Specifically, with a short-wavelength cutoff at m it will be difficult to single out distant galaxies from more nearby ones using photometric redshift techniques. The reason for this is that photometric redshift techniques rely on the identification of strong spectral features, such as the Lyman continuum break and the 4000 Å break, in galaxy spectra. As described in §1, however, at wavelengths m the spectral energy distribution of galaxies is still poorly understood in the models. Even if the particular model presented in Figure 5 exhibits strong features in this range of wavelengths, it would be premature to establish photometric redshift criteria based on these features before they are better determined. Until then, assigning photometric redshifts to galaxies at redshifts , i.e., for which the 4000 Å break lies blueward of the m spectral window, will be difficult. This may be of primary concern since a galaxy like the one in Figure 5 forming stars at a rate of yr-1 at is predicted to have an apparent magnitude , i.e., brighter than that of a dwarf spheroidal galaxy of total stellar mass at . We note, however, that so long as the Hubble Space Telescope remains operational, it will be possible to complement NGST observations with space-based UV to optical observations.
Another advantage of extending NGST’s observational window further into the optical would be the local calibration of spectral models of galaxies by means of Hertzsprung-Russell diagram studies of nearby stellar populations. This is all the more important in that even if SFRs and stellar masses are determined for large samples of galaxies in a wide range of redshifts, evolutionary links between galaxy populations at different redshifts will not necessarily be readily identifiable (e.g., merging history, possibility of vanishing populations, top-heavy IMF, etc.). Therefore, a complete understanding of the formation and evolution of galaxies relies ultimately on our ability to relate nearby stellar populations to the most distant galaxies. NGST represents a milestone in the achievement of this challenge.
ACKNOWLEDGEMENTS
I gratefully acknowledge financial support from the organizers of this meeting. I also thank Yannick Mellier for many useful discussions.
References
- \astroncite Bernasconi, P.N., & Maeder, A. 1996, A&A, 307, 829
- \astroncite Boselli, A., et al. 1998, A&A, 335, 53
- \astroncite Bruzual A., G., & Charlot, S. 1993, ApJ, 405, 538
- \astroncite Bruzual A., G., & Charlot, S. 1998, in preparation
- \astroncite Charlot, S. 1996a, in the Universe at High Reshift, ed. E. Martínez-Gonzalez & J.L. Sanz (Springer: Lecture Notes in Physics 470), 53
- \astroncite Charlot, S. 1996b, in From Stars to Galaxies, ed. C. Leitherer, U. Fritze, & J. Huchra (ASP Conf. Series 98), 275
- \astroncite Charlot, S., & Fall, S.M. 1993, ApJ, 415, 580
- \astroncite Charlot, S., & Longhetti, M. 1998, in preparation
- \astroncite Charlot, S., Worthey, G., & Bressan, A. 1996, ApJ, 457, 625
- \astroncite Ferland, G.J. 1996, Hazy, a Brief Introduction to Cloudy, Univ. of Kentucky Dept. of Physics & Astronomy Int. Rep.
- \astroncite Habing, H.J. 1996, A&AR, 7, 97
- \astroncite Kennicutt, R.C. 1992, ApJ, 388, 310
- \astroncite Lançon, A., & Wood, P.R. 1997, in Fundamental Stellar Properties, ed. T.R. Bedding (Poster Proceedings of the 189th IAU Symposium), 168
- \astroncite Leitherer, C. et al. 1996, PASP, 108, 996
- \astroncite Leitherer, C., & Heckman, T.M. 1995, ApJS, 96, 9
- \astroncite Lilly, S.J., Le Fèvre, O., Hammer, F., & Crampton, D. 1996, ApJ, 460, 1L
- \astroncite Madau, P., 1995, ApJ, 441, 18
- \astroncite Madau, P. et al. 1996, MNRAS, 283,, 1388
- \astroncite Maeder, A. 1996, in From Stars to Galaxies, ed. C. Leitherer, U. Fritze, & J. Huchra (ASP Conf. Series 98), 141
- \astroncite McCall, M.L., Rybski, P.M., & Shields, G.A. 1985, ApJS, 57, 1
- \astroncite Meurer, G.R., et al. 1995, AJ, 110, 2665
- \astroncite Palla, F., & Stahler, S.W. 1993, ApJ, 418, 414
- \astroncite Pettini, M., et al. 1998, ApJ, in press (astro-ph/9806219)
- \astroncite Porter, J.M., Drew, J.E., & Lumsden, S.L. 1998, A&A, 332, 999
- \astroncite Scalo, J. 1997, in The Stellar Initial Mass Function, ed. G. Gilmore, I. Parry & S. Ryan (Proceedings of the 38th Herstmonceux Conference), in press (astro-ph/9712317)
- \astroncite Stasińska, G., & Leitherer, C. 1996, ApJS, 107, 661
- \astroncite Tresse, L., et al. 1996, MNRAS, 281, 847