Two multiple-imaged galaxies in the cluster-lens Abell 2390 ††thanks: Based on observations collected with the Canada-France-Hawaii Telescope (CFHT), the William Herschel Telescope (WHT) and the Hubble Space Telescope (HST).
Abstract
We present the first results on the identification and study of very distant field galaxies in the core of cluster-lenses, using a selection criterium based on both lens modelling and photometric redshifts. We concentrate on two multiple-imaged sources at in the cluster Abell 2390. The two objects presented in this paper, namely H3 (cusp arc) and H5 (fold arc), were identified through lens modelling as multiple images of high-redshift sources at (Kneib et al. 1999). We confirm the excellent agreement between this identification and both their photometric redshifts and morphologies. Our CFHT/WHT program for a systematic redshift survey of arcs in clusters has allowed to obtain a set of spectra on three different images at : the brightest image of H3, whose redshift was already confirmed by Frye & Broadhurst (1998), and the two brightest images of H5. The later is then confirmed spectroscopically as a multiple image, giving a strong support to the lens model. The main feature in each of these spectra is a strong emission line, identified as Ly , leading to for both H3 and H5. The spectrophotometric properties of these galaxies are studied, in particular the degeneracy in the parameter-space defined by the SFR type, age, metallicity and reddening. H3 and H5 are intrinsically bright and clumpy galaxies ( to -2 magnitudes), located kpc apart on the source plane, with mean metallicities compatible with a fraction of solar or even solar values. These results seem to favour a hierarchical merging scenario, where we are seeing a relatively evolved phase in these two objects, with stars forming locally and efficiently.
Key words: Galaxies: clustering – evolution – – Cosmology: observations – gravitational lensing
1 Introduction
The identification and study of very high-redshift galaxies () is probably one of the most direct methods to constrain the scenarios of galaxy formation and evolution. The observation of such galaxies presents a major challenge complementing the statistical studies of lower redshift galaxies (CFRS: Lilly et al. 1996; Hawaii Deep Fields: Cowie et al. 1996; HDF: Sawicki et al. 1997; Lowenthal et al. 1997; Steidel et al. 1996b). The key information to retrieve is the star formation history in the universe and the evolution of the different morphological types of galaxies. The main problems are the identification of high-z galaxies and the construction of a sample as bias-free as possible. Steidel et al. (1992, 1993, 1996a, 1997) first used the Lyman dropout technique to photometrically identify galaxies in empty fields, and they succeeded in confirming spectroscopically a large sample of them with the Keck telescope. A similar technique has been used on the HDF to identify galaxies (Steidel et al. 1996b; Lowenthal et al. 1997) also confirmed with the Keck telescope. The number of massive star-forming galaxies at high redshift can be used to constrain the cosmological models (see Baugh et al. 1998). All these galaxies are in general very compact in their restframe UV, with the bulk of their star formation located on high surface-brightness regions. Their morphologies might give some hints on the physical processes involved in galaxy evolution. In particular, they might provide useful constraints on the formation of the different systems (spheroids, bulges, disks), and its close relation with metal enrichment timescales (see Trager et al. 1997 for a detailed discussion). At 3 to 4, the corresponding lookback time is 13.7 to 14.4 Gyr, 15 Gyr being the present age of galaxies ( km s-1 Mpc-1, and ). Thus, such high redshift systems provide a direct measure of the early star-formation processes.
The photometric technique based on the identification of Lyman dropouts in the U-band has shown to be a useful tool to select galaxies, and it has been successfully extended to the B-band to locate candidates (Steidel et al. 1998). Nevertheless, two major biases will appear in all such selection techniques: one towards intrinsically luminous galaxies because the sample is limited in apparent magnitude, and another towards galaxies with strong star-formation activity, because the rest-frame UV will be seen at the visible wavelengths. When high-redshift galaxies are selected through photometric redshift techniques based on a large wavelength domain, including near-IR, and close to critical-lines of cluster-lenses, the resulting sample is less sensitive to these biases. This paper presents the first results on this original method to build-up and study an independent sample of galaxies, by combining photometric redshifts (visible and near-IR) and lens modelling. One of the first examples of such a technique on lensed galaxies is the star-forming object in A2218 (Ebbels et al. 1996), and a number of recent discoveries of lensed-galaxies in clusters, sometimes serendipituous, strongly encourages this approach (Yee et al. 1996a; Trager et al. 1997; Franx et al. 1997; Soifer et al. 1998; Seitz et al. 1998; Frye & Broadhurst 1998; Bunker et al. 1998).
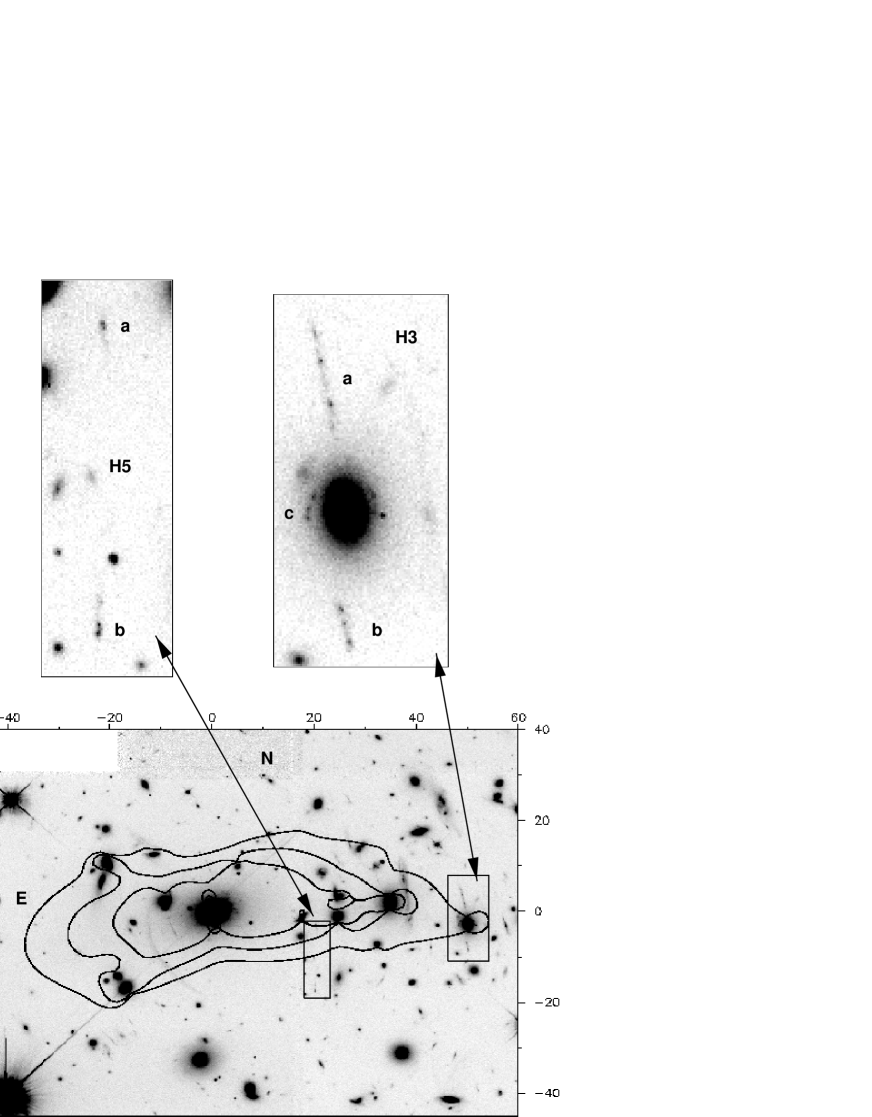
The two lensed galaxies discussed in this paper were identified in the cluster Abell 2390 (), a gravitational lens which has been extensively studied. The first detailed photometric and spectroscopic surveys on this target were performed by Le Borgne et al. (1991), and recently enlarged by the CNOC group (Yee et al. 1996b; Abraham et al. 1996; Carlberg et al. 1996). This cluster, which is known as a strong X-ray emitter (Ulmer et al. 1986; Pierre et al. 1996), has an elongated shape (, based on the luminosity map of the photometrically selected cluster-galaxies, Pelló et al. 1991) and a high velocity-dispersion (km/s, Abraham et al. 1996). A near-IR photometric survey is also available (Miralles et al. 1999, in preparation). We will focus here on two multiple images at , namely H3 and H5, according to the nomenclature by Kneib et al. (1999, see also Figure 1). The redshift of the former had already been confirmed by Frye & Broadhurst (1998) at the Keck telescope.
A plan of the paper follows. First, we give a summary of the spectroscopic and photometric data in Section 2. Section 3 is devoted to the study of the main properties of H3 and H5, namely the spectroscopic and photometric redshifts, the lensing properties and the morphology of these objects. The stellar population of these objects is characterized in Section 4. In Section 5 these results are discussed, with a special attention to the implications for galaxy formation and evolution. Throughout this paper, we assume km s-1 Mpc-1 and .
2 Observational data
2.1 Photometry
The photometric data were obtained during a number of runs since 1988, at the 3.6m Canada-France-Hawaii Telescope, the 3.5m telescope of Calar Alto (CAHA, Spain) and the 2.5m Isaac Newton Telescope (Spain). We have selected the images obtained under photometric conditions. The total number of filter bands considered is 10 when we add the two F555W () and F814W () WFPC2 images from our HST program (PI. B. Fort), although the two B bands have very similar central wavelengths (but different widths). Table 1 provides with the central wavelengths and widths of the different filters. In the case of the 2 pairs (R and r, I and ), the difference between the central wavelengths is of the order of , and the filter widths are different. We use all these data as complementary information in the following discussion, and we consider different independent sets of filters to constrain the properties of the stellar population (see Sect. 4). All magnitudes are given in the Vega system, and we use the SED of Vega and the detailed filter and detector responses to set the zero points when converting magnitudes into fluxes. As most of these data have been published elsewhere, we give only a summary of the main characteristics of the images in Table 1, including the detection levels and references. The magnitude is defined here as the magnitude of an object with 4 connected pixels above the sky level.
| pix | Ref. | ||||||
|---|---|---|---|---|---|---|---|
| (ksec) | (′′) | (′′) | (nm) | (nm) | |||
| B | 5.4 | 0.88 | 0.21 | 436 | 70 | 26.7 | a, 1 |
| 2.7 | 0.68 | 0.21 | 437 | 107 | 26.8 | 1 | |
| g | 2.1 | 1.0 | 0.74 | 486 | 40 | 24.7 | b, 2 |
| 8.4 | 0.13 | 0.10 | 545 | 105 | 28.5 | c, 3 | |
| R | 2.7 | 0.74 | 0.21 | 641 | 141 | 25.2 | a,1 |
| r | 5.4 | 0.80 | 0.25 | 669 | 64 | 25.8 | 4 |
| 10.5 | 0.13 | 0.10 | 799 | 137 | 27.7 | c, 3 | |
| I | 4.2 | 1.0 | 0.42 | 832 | 113 | 23.8 | 1 |
| J | 5.3 | 1.1 | 0.50 | 1237 | 147 | 23.0 | d, 1 |
| K’ | 4.1 | 1.1 | 0.50 | 2103 | 272 | 21.4 | d, 1 |
| a) Pelló et al. 1991 |
| b) Le Borgne et al. 1991 |
| c) Kneib et al. 1999 |
| d) Miralles et al. 1999, in preparation. |
2.2 Spectroscopy
The spectroscopic data set used in this paper comes from three different runs: one at the CFHT and two at the 4.2m William Herschel Telescope (WHT). H3 was one of the targets of the spectroscopic survey performed by Bézecourt and Soucail (1997) at CFHT in August 1995. The spectrograph used was MOS/SIS (Le Fèvre et al., 1994), with the V150 grism, providing a low dispersion of Å/pixel. H5a and H5b were observed during two separate runs at the WHT, in September and June 1996 respectively, with the LDSS-2 multiobject spectrograph (Allington-Smith et al. 1992). The grism used was the medium blue, with a dispersion of Å/pixel. The total exposure times were 6.7 ksec ( sec 1700 sec) on H5b and 9.9 ksec ( sec 2700 sec) on H5a. The reduction was performed using standard IRAF procedures as well as our own software packages.
3 Photometric and spectroscopic study of H3 and H5
3.1 Lensing properties, spectral energy distribution and morphology of the sources
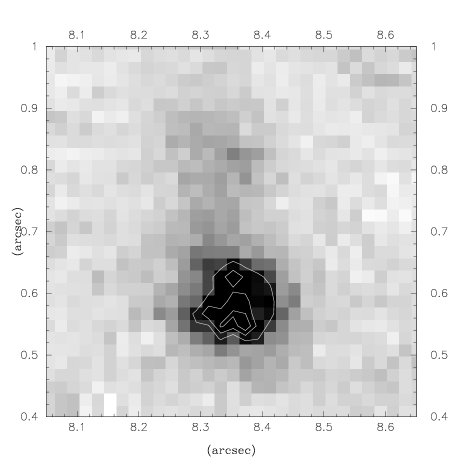
Hereafter we use the new lens model of A2390 by Kneib et al. (1999), which is a refined version of the earlier model presented in Pierre et al. (1996), based on lensing and X-ray data, taking into account the new constraints given by the HST images. According to this lens modelling, H3 and H5 are multiple images of two high-redshift sources at . This redshift estimate has been confirmed through photometric redshift techniques (filters from B to K) and spectroscopy. Figure 1 displays a zoom on the different components of H3 and H5, as well as their location in the cluster. H3a-b-c is an impressive cusp arc showing several bright knots which are identifiable in each different image. H5 is a fold arc with the two radial components showing similar morphologies. A third faint image is predicted for this source, but unfortunately it lies on the edge of the Planetary Camera, where the exposures have a poor S/N. Table 2 summarizes the photometry of all these components except H3c, which is too close to the bright cluster galaxy. The different colors have been obtained through aperture magnitudes computed within the same region in all the filters, correcting for sampling and seeing effects. The averaged colors of a bright E/S0 cluster galaxy are also given for comparison. The surface brightnesses and colors are compatible with the multiple-image hypothesis within the photometric errors ( typically, and in the near-IR). The faint images H5a and H3b are surrounded by bright objects (see Fig. 1), and they are hardly detected in the near-IR and g where the sampling ( 05 per pixel) and/or the seeing conditions are poor. Moreover H5a and H5b are hardly detected in B. In these particular cases, photometric errors are at least , and these magnitudes are indicated by ”:” in Table 2. It is worth noting that the identification of multiple images based on the similarity of the spectral energy distributions (SED) is more easily obtained with extended wavelength coverage.
| Filter | H3a | H3b | H5a | H5b | ||
|---|---|---|---|---|---|---|
| B | - | - | - | 27.1 | 25.6 | - |
| 25.5 | - | - | 29.2 | 27.0 | - | |
| g | 24.4 | 25.3: | 0.9: | 25 | 25.2 | 0.2 |
| 23.8 | 24.1 | 0.3 | 25.2 | 24.4 | 0.8 | |
| R | 22.8 | 23.0 | 0.2 | 23.5 | 23.1 | 0.4 |
| r | 22.9 | 23.4 | 0.5 | 23.9 | 23.1 | 0.8 |
| 22.1 | 22.5 | 0.4 | 23.7 | 23.0 | 0.7 | |
| I | 22.1 | 22.3 | 0.3 | 23.3 | 22.5 | 0.8 |
| J | 21.0 | 21.6 | 0.6 | 23.0: | 22.3 | 0.7: |
| K’ | 19.7 | 20.2 | 0.5 | 21.9 | 21.1 | 0.8 |
| g-r | -R | I - J | J - K | ||
|---|---|---|---|---|---|
| H3a | 1.5 | 1.5 | 2.1 | 1.0 | 1.3 |
| H3b | 1.9: | 1.8 | 2.4 | 0.7 | 1.4 |
| H5a | 1.1 | 1.7 | 1.5 | 0.3 | 1.1 |
| H5b | 2.1 | 1.3 | 1.4 | 0.2 | 1.2 |
| cluster | 1.3 | 0.8 | 1.7 | 1.3 | 1.1 |
The first spectrum of H3 obtained by Bézecourt and Soucail (1997) shows a single emission line which was assigned to [O II] Å, giving , a value which is in fact incompatible with both the lens modelling and the photometric redshift. On the contrary, when it is correctly assigned to the rest-frame Ly, it gives . Subsequent observations of H3 by Frye & Broadhurst (1998) at the Keck Telescope obtained a redshift of through a higher quality spectrum. This time, the redshift is based on several absorption lines, the Ly centroid being slightly shifted redwards with respect to the absorption system, in good agreement with the position of the line found by Bézecourt and Soucail (1997).
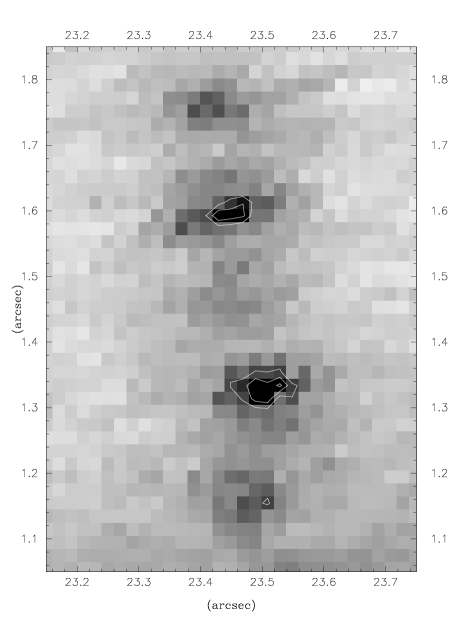
In the case of H5a and H5b, both spectra show a strong emission line (Fig. 2). When this line is identified as Ly, the corresponding redshifts are and for the a and b components respectively. Thus, this result confirms that H5a and H5b are two images of the same source, in perfect agreement with the lens model. When taking the Ly centroid to compute the redshift, the two multiple images H3 and H5 are at the same redshift within the errors. Hereafter we take the Ly-based redshift of for both sources, because we have no estimate based on absorption lines for H5. The measured equivalent width of Ly is relatively high for H5, Å for the brightest image, corresponding to a rest frame value of Å. We obtain a rest frame upper limit of Å for the faintest image, where the continuum is hardly detected. These values are similar to the ones observed by Hu et al. (1998) in their sample of emission-line galaxies at to 6. The equivalent width of H3 is smaller, the upper limit obtained from the CFHT spectrum being Å.
The gravitational amplification computed for the brightest images H3a and H5b is magnitudes in both cases, and the predicted difference between the two images are = 0.4 and 0.8 magnitudes for H3 and H5 respectively. The corresponding measured differences (Table 2) are also consistent with this model, and . These amplification factors are surface-averaged values computed with the Kneib et al. (1999) lens model.
We have applied a lens inversion procedure to restore the morphology of these sources on the source plane at . This method is close to the LensClean algorithm (Kochanek & Narayan 1992; Kneib et al. 1994). Figure 3 displays the resulting morphology and location of the two objects on their source plane. The true separation between H3 and H5 in the source plane would be , corresponding to a linear separation of kpc with . Note that these sources are not resolved in their width, the lens inversion being limited by the resolution of the composite HST images ( in and ). Both sources are extremely clumpy. H5 consists of an alignment of two compact and bright blobs, less than apart ( kpc), and a faint extended component of ( kpc), the total length being ( kpc). H3 is more elongated than H5, and it displays four small and bright subclumps. Each one of these subclumps has less than of diameter, and the total length of the structure is about ( kpc). The orientation of the two sources is similar (see Fig. 3). Compared to the morphologies and sizes of the sample by Steidel et al. (1996a), typically - for the resolved cores ( to kpc with ; see also Giavalisco et al. 1996), the bright subclumps of H3 and H5 are more compact, but the total length of the emitting region is of the same order. From the morphological point of view, H3 and H5 are similar to the lensed sources found behind Cl0939+4713 (Trager et al. 1997).

3.2 The photometric redshift approach
H3 and H5 are the first two high-redshift objects spectroscopically confirmed in our sample of photometrically selected candidates at in this cluster. A photometric redshift method has been used to identify such candidates in the cluster core, close to the critical lines. Photometric redshifts were derived according to the standard minimization method described by Miralles, Pelló & Roukema (1999) and Miralles (1998). The observed SED of each galaxy, as obtained from its multicolor photometry, is compared to a set of template spectra. The new Bruzual & Charlot evolutionary code (GISSEL98, Bruzual & Charlot, 1993, 1998) was used to build 5 different synthetic star-formation histories, each with solar metallicity (): a burst of 0.1 Gyr, a constant star-formation rate, and 3 models (exponential-decaying SFR) with characteristic time-decays matching the present-day sequence of colors for E, Sa and Sc galaxies. The template database includes 255 synthetic spectra. The intergalactic absorption in the Lyman forest is modelled using the average flux decrements and , according to the original definition by Oke & Korycansky (1982). and correspond respectively to the continuum depression between Ly and Ly, and between Ly and the emission Lyman limit. The prescriptions for the redshift distribution of and are taken from Giallongo & Cristiani (1990), and they are in good agreement with those given by Madau (1995) in the common redshift domain . When applied to our data, the photometric redshift method identifies sources at in this field, most of them too faint to be confirmed spectroscopically using 4m telescopes. The high gravitational amplification of H3 and H5, and their strong Ly emission makes it possible in these two particular cases. The results obtained on the whole field of A2390 and two other cluster-lenses will be discussed in more details elsewhere (see a preliminary version in Pelló et al., 1998).
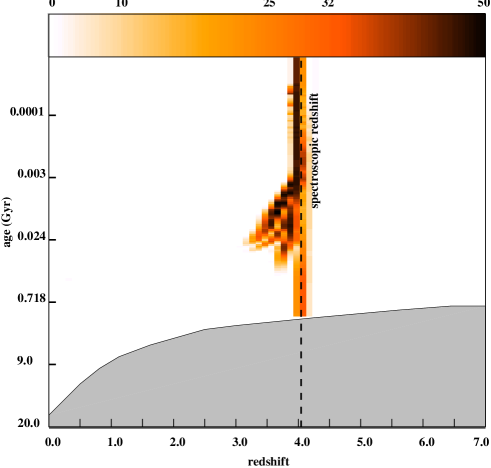
In the case of H3 and H5, we have examined the sensitivity of our photometric redshift estimate as a function of the relevant parameters, namely SFR, age and metallicity of the stellar population. This exercise is especially important for H5, because the spectroscopic redshift is based on a single line. Figure 4 presents a likelihood map for this object, showing a good agreement between the spectroscopic () and the photometric redshift (, where the error bar corresponds to a level). This map was obtained using the set of 10 different SFRs presented in the next section, representing templates with a range of metallicities. Each point on the redshift-age map corresponds to the best fit of the SED obtained across the SFR-metallicity space. The dark regions in Figure 4 (above confidence level) result from the overlap of the 5 metallicities considered (age vs. metallicity degeneracy). The redshift region around appears as the most likely solution for this object. The map obtained when using the solar-metallicity set above mentioned is qualitatively the same. In the case of H3, we obtain a photometric redshift of using the same procedure, thus in good agreement with the spectroscopic value, but with a larger error bar.
4 Constraining the stellar population in H3 and H5
We use the SEDs of H3 and H5, determined from broad-band photometry, to infer the relevant parameters for the stellar population, in particular the total SFR. The SEDs of these objects can be fitted by different synthetic stellar populations, and there is a degeneracy to consider in the SFR-age-metallicity-reddening space. Figure 5 displays a comparison between the SEDs of H3 and H5. The wavelength interval sampled by the broad-band filters in the restframe of H3 and H5 goes from the Lyman 912Å break to Å. The region at 1500Å is sampled by the band, and the bands from R to J give the slope of the UV continuum, whereas the K’ band is sensitive to the Balmer and 4000Å breaks (roughly the restframe B). Thus, we have in principle a good database to roughly constrain the stellar population in these objects. When the IMF and the upper mass limit for star-formation are fixed, the allowed parameter space can be roughly constrained. The presence of Ly in emission points towards a star-forming system. Again, we used the GISSEL98 code for this exercise, taking into account that the two galaxies are necessarily dominated by massive OB stars at the wavelengths seen in the visible bands. Two kinds of SFRs were considered: a single stellar population (instantaneous burst), and a continuous star-forming system, both with the Salpeter (1955) IMF, with upper and lower mass-cutoff of , and an extinction law of SMC type given by Prévot et al. (1984). When computing quantities related to the stellar mass involved in one of these regions, we take the above mass limits for star-formation, but only of the stellar mass corresponds to stars with with this particular IMF.
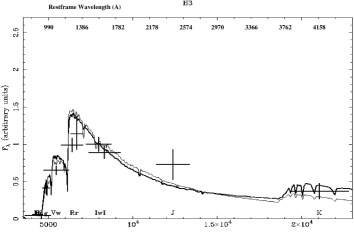
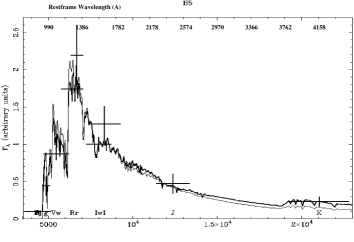
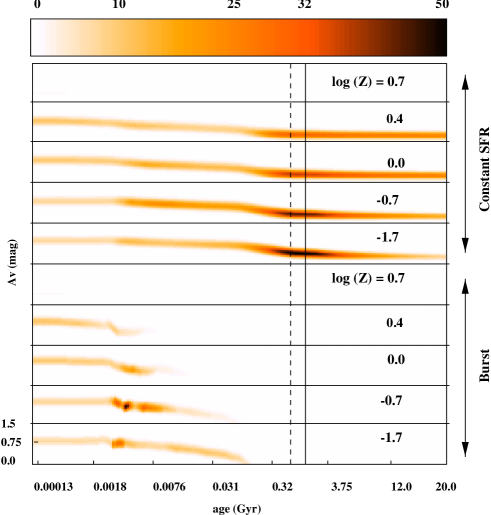
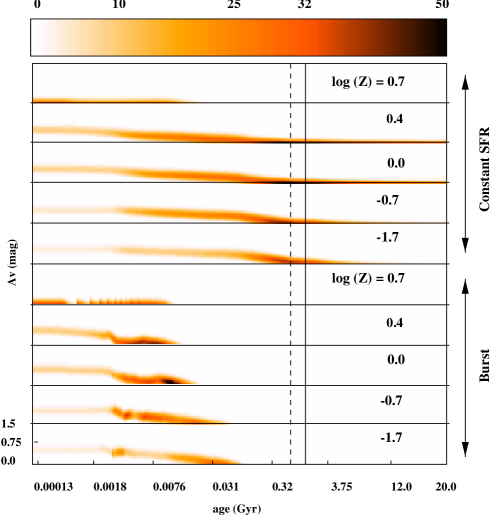
Figures 6a and 6b show the likelihood maps corresponding to H3 and H5 respectively, at z=4.05. For each SFR model, we have computed a reduced for 220 different ages of the stellar population, 61 extinction values (ranging between and 3.0 magnitudes), and 5 different metallicities (, , , and ). The most probable regions in this parameter-space are displayed in dark (permitted regions). The scaling directly corresponds to the confidence level as derived from the value. The shaded regions enclose the contours (confidence level of ). The likelihood maps were computed using two independent sets of filters: g,,R,,J,K and g,,r,,J,K, and the averaged intergalactic absorption in the Lyman forest (see Sect. 3.2). In all the cases we use instead of I because the seeing and sampling are better in this filter. The results obtained with each independent set of filters are qualitatively the same, and the two regions in the parameter space coincide. Each point on the likelihood maps presented in Figures 6a and 6b corresponds to the most restrictive value obtained from the two independent sets (i.e. the lowest likelihood value). We also discuss in each particular case the results obtained when using only the spectral region redwards of Ly (hereafter redSED), a region which is not affected by uncertainties on the intergalactic absorption. In order to retain good resolution at short time scales, a logarithmic scale is used to display the age of the stellar population.
According to Figures 6a and 6b, the stellar population in H5 is better constrained than in H3 in terms of . The reason for this is probably the relatively redder spectrum of H3 compared to H5. The weight of the old stellar population is more important in H3 than in H5 and, as a consequence, we expect an enlarged set of permitted regions on the reddening-age plane. In a short-burst model without reddening, H3 should be older than H5. Figures 6a and 6b also display the degeneracy in metallicity versus reddening for the two objects. H3 and H5 do not seem to be highly reddened: the maximum restframe ever attained at a level is magnitudes for H3, and it remains below magnitudes at . This is not surprising given the redshift of these objects and the photometric selection. The age of the stellar population in the constant star-formation models is unconstrained at level in all the cases. Table 3 summarizes the permitted domains in the parameter space for H3 and H5.
| Model | |||||||
|---|---|---|---|---|---|---|---|
| Age (Gyr) | (mags) | Metallicity ( | Age (Gyr) | (mags) | Metallicity () | ||
| H3 | Burst | 0.003 - 0.007 | 0.5 - 0.8 | 0.02 - 0.2 | 0.0 - 0.10 | 0.0 - 1.1 | 0.02 - 2.5 |
| H3 | Constant SFR | 0.18 - 1.17(2.16) | 0.2 - 0.6 | 0.02 - 1.0 | 0.0 - 1.17(2.16) | 0.1 - 1.1 | 0.02 - 2.5 |
| H5 | Burst | 0.003 - 0.016 | 0.0 - 0.25 | 0.2 - 5.0 | 0.0 - 0.07 | 0.0 - 0.7 | all |
| H5 | Constant SFR | 0.0001- 1.17(2.16) | 0.0 - 0.15 | all | 0.0 - 1.17(2.16) | 0.0 - 0.6 | all |
H3 is well fitted by both the burst and the constant star-formation models. Within the confidence level, the metallicity is excluded, whatever the star-formation model, the reddening or the age of the stellar population. All the solutions are compatible at with a moderate 0.4 to 0.6 magnitudes. The best fit at with a burst model is obtained for metallicities below solar: 0.2 metallicity, and age 0.004 Gyr () At , the maximum age for the burst model is 0.1 Gyr, and the maximum value for is 1.1 magnitudes. When we use only the redSED, the domain is enlarged, and the maximum age and permitted for a burst model are 0.29 Gyr and 1.6 magnitudes respectively. The best fits of H3 are given by a constant star-formation model, 0.02 metallicity, with and age 2.4 Gyr (), but this age is in fact incompatible with the age of the universe (1.17(2.16) Gyr with the adopted cosmology and =0.5(0.1)). This is not a problem because the domain for this model encloses solutions up to metallicity, with ages starting at 0.18 Gyr and limited by the age of the universe. ranges between 0.1 and 1.1 magnitudes at , and it increases up to 1.6 magnitudes when using the redSED.
H5 is well fitted by the burst and the constant star-formation models, provided that the value keeps below 0.15 magnitudes typically. The best fit of H5 is given by a constant star-formation model of , age 0.51 Gyr and (). The best fit by the burst model has , age 0.012 Gyr and (). For the burst model, the age and the reddening are well constrained. All the solutions within are compatible with very small values of (), whatever the model or the age of the stellar population. This result is also found when fitting only the redSED. At , the maximum age of the burst is 0.07 Gyr, and up to 0.14 Gyr whith the redSED. The best fit models have solar metallicities or higher than solar. For the constant star-formation model, the reddening is well constrained. The ages are also well constrained (between 0.07 and the age of the universe), provided that we can exclude the highest metallicity.
The best-fit SEDs were used to compute the SFR values and the absolute magnitudes involved in the bursts from the observed magnitudes and mean fluxes. The lens-corrected luminosity observed within the band is erg s-1 for H3, and erg s-1 for H5, with , assuming . In the case of H3, the best fit model has , thus the corrected luminosity in this filter (restframe 1450 - 1700 Å) is in fact 2.8 times higher. When using the best-fit models to scale the fluxes (Fig. 5), we obtain L(1500 Å)= 1.24 (3.5) erg s-1 Å-1 for H3 (corrected for ), with , and L(1500 Å)= 1.9 (5.4) erg s-1 Å-1 for H5 (). These values are not strongly dependent on the model SED used for the scaling. The SFRs derived from the best-fit star-forming models, scaled to the observed L(1500 Å), are for H3 (corrected for ) and for H5 (), and only of these values correspond to stars with . The main uncertainty is the for H3, which could set the SFR to values times lower or higher than the best solution quoted above. The absolute B magnitudes were derived from the observed K magnitudes (restframe 3900 - 4430 Å), using the best-fit models for a detailed scaling: and for H3 and H5 respectively, with . In the case of H5, this result is almost independent on the model SED because is always small; in the case of H3, the uncertainties in translate into magnitudes of uncertainty in .
The shape of the continuum at wavelengths shorter than Å (restframe Å), up to the I band, is relatively insensitive to the metallicity for metallicities higher than solar. The likelihood map is almost insensitive to age for ages below years, as expected given the sampling in stellar masses in the evolutionary tracks used by GISSEL98. Nevertheless, such time-scales seem irrelevant here, the best solutions being older than this limit. These results also are generally insensitive to the choice of the IMF. Nevertheless, the permitted regions in the likelihood maps show some dependency on the upper mass limit assumed for star-formation. In particular, when this limit is set to a value as low as , the permitted region for burst models is shifted towards younger age values for the stellar population, irrespective of the metallicity. This change on model details has very small influence on the SFRs derived above.
5 Discussion and conclusions
The two sources H3 and H5 are at the same redshift, but their stellar populations are noticeably different. Both of them are well fitted by burst or continuous star-formation models. Metallicities much higher than seem to be excluded by the photometric data in the case of H3, and they have a lower probability in H5. Both galaxies are roughly compatible with solar metallicities within the confidence level: for H3 and for H5. The stellar population seen in H5 is younger than in H3, on the basis of a burst model with . The main source of uncertainty when deriving the restframe properties of these objects is the value of , and this is clearly shown in the case of H3 where the uncertainties are magnitudes. The two sources are intrinsically bright: roughly for H5 and () magnitudes for H3 (here is the local value, from Loveday et al. 1992). This, combined with the high gravitational amplification and the presence of relatively strong emission lines, has allowed us to obtain a spectroscopic redshift for these sources using a 4m telescope. Among the high redshift candidates in our sample behind A2390, 4 additional ones are at the same photometric redshift. A subsequent spectroscopic survey using a 8m class telescope is needed to go further on this study, especially to estimate more precisely the metallicities from UV absorption lines.
When comparing our results on H3 to those by Frye & Broadhurst (1998) and Bunker et al. (1998), we find them in fairly good agreement, after correction for the difference in the amplification factor, which is 3 times higher in their lens model. The age of the system and the reddening value given by Bunker et al. for H3 are included within our best solution region, which is a remarkable result taking into account that both the photometric data (HST excepted) and the analysis are completely independent. The high amplification factor obtained by Frye & Broadhurst (1998) corresponds to the maximum value attained in our model for H3, on the region neighbouring the critical line, but the surface-averaged value in our case is 3 times lower.
Compared to other known galaxies, H3 and H5 belong to the bright end of the field population (Lowenthal et al. 1997; Steidel et al. 1996a and 1996b). They are slightly brighter than the objects found by Trager et al. (1997) in the cluster lens Cl0939+4713, although the amplification factor is poorly known in this case. They are also intrinsically brighter than the galaxy found by Dey et al. (1998). These sources are not resolved in their width, where the lens inversion is limited by the resolution of the WFPC2 images (about , kpc with ), but they are resolved on their length. H3 and H5 are splitted into several small, compact and bright subclumps, all aligned towards the same direction. The total length of these emitting regions is similar to that of the compact cores of the field sample by Steidel et al. (1996a). H3 is more elongated than H5, and probably more dusty. The linear separation between H3 and H5 ( with ) and their peculiar morphologies strongly point towards a hierarchical merging process as a likely scenario for the formation of the brightest spheroids. Their photometric SEDs are compatible with a wide range of metallicities at a level, all with . Nevertheless, as shown in Section 4, broad band photometry does not allow a precise estimate of the metallicity. A spectroscopic study using UV restframe absorption lines, or near-IR spectroscopy, is urgently needed for these purposes. A relatively high metallicity for the bright subclumps would imply that we are actually seeing an advanced step in this merging process, where stars are forming from a metal enriched gas (see also Trager et al. 1997; Lowenthal et al. 1997, Baugh et al 1997; Moscardini et al. 1997). It is worth noting that we are dealing with local conditions in these star forming systems. The light detected is mainly emitted in very small and compact regions ( kpc), which could be highly enriched compared to the remainder of the source. This is fully compatible with the best fit metallicities being in these systems, because in this case the star formation becomes a local and efficient process, where the cooling rate is enhanced by metallic atoms allowing the formation of molecules and increasing the dust opacity. Such a process is discussed in details in a recent paper by Spaans & Carollo (1998).
The uncertainty in the amplification factor for H3 and H5 is 0.3 magnitudes. This means that the intrinsic luminosities and SFRs are known with an accuracy of . This source of error has the same importance than the model uncertainties for a relatively well constrained SED (i.e., the uncertainty of magnitudes in for H3). It is worth noting that H3 and H5 are multiple images, well modelled compared to other images in this or other cluster lenses. This gives an idea of the limitation arising from lens modelling when using clusters as gravitational telescopes to access the background sources. Only the well constrained clusters are actually useful for this programme.
H3 and H5 are the first spectroscopically confirmed images of sources at in this cluster, a redshift domain which is well constrained by the set of filters used here. The selection of high-redshift candidates using a photometric redshift approach, including the near-IR bands, is strongly supported by the present results. For most statistical purposes, photometric redshifts should be accurate enough to discuss the properties of these extremely distant galaxies. Conversely, the spectroscopic confirmation of the redshifts of such gravitationally amplified sources could help on the calibration and improvement of the photometric redshifts techniques up to much fainter limits in magnitude compared to field surveys.
-
Acknowledgements.
We thank Y. Mellier, G. Mathez, B. Fort, J.P. Picat and E. Hatziminaoglou for useful discussions about this particular program, and R.S. Ellis for a careful reading of the manuscript. We are grateful to M. Breare and all the La Palma staff for their support during the LDSS-2 runs. Part of this work was supported by the French Centre National de la Recherche Scientifique, by the French Programme National de Cosmologie (PNC), and the TMR Lensnet ERBFMRXCT97-0172 (http://www.ast.cam.ac.uk/IoA/lensnet). G. Bruzual thanks the OMP for its hospitality, and the MENRT and the EEC program No. CHRX-CT92-0033 for support. We also acknowledge the DGICYT (Ministerio de Educación y Ciencia. Spain) (IT).
References
- 1 Abraham, R.G., Smecker-Hane, T.A., Hutchings, J.B., Carlberg, R.G., Yee, H.K.C., Ellingson, E., Morris, S., Oke, J.B., Rigler, M. 1996, ApJ 471, 694
- 2 Allington-Smith J., Breare M., Ellis R.S., Gellatly D., Glazebrook K., Jorden P., Maclean J., Oates P., Shaw G., Tanvir N., 1994, PASP 106, 983
- 3 Baugh, C.M., Cole, S., Frenk, C.S., Lacey, C.G., 1997, ApJ , submitted (astro-ph/9703111)
- 4 Bézecourt J. and Soucail G., 1997, A&A 317, 661.
- 5 Bruzual, G., Charlot, S., 1993, ApJ , 405, 538
- 6 Bunker, A. J., Moustakas, L. A., Davis, M., Frye, B. L., Broadhurst, T. J., Spinrad, H., 1998, to appear in ”The Young Universe: Galaxy Formation and Evolution at Intermediate and High Redshift” , eds. S. D’Odorico, A. Fontana and E. Giallongo, A.S.P. Conf. Ser
- 7 Carlberg R.G., Yee, H.K.C., Ellingson, E., Abraham, R.G., Gravel P., Morris, S., Pritchett C.J., 1996, ApJ 462, 32
- 8 Cowie, L.L., Songaila, A., Hu, E., Cohen, J.G., 1996, AJ 112, 839
- 9 Dey, A. Spinrad, H., Stern D., Graham, J.R., Chaffee, F.H., 1998, ApJ 498, 93
- 10 Ebbels, T.M.D., Le Borgne J.F., Pelló R., Ellis R.S., Kneib J.P., Smail I., Sanahuja B., 1996, MNRAS 281, L75
- 11 Fort, B., Mellier, Y., 1994, Astron. Astr. Rev., 5, 239.
- 12 Franx M., Illingworth G.D., Kelson D.D., van Dokkum P.G., Tran K.-V., 1997, ApJ 486, L75
- 13 Frye B., Broadhurst T., 1998, ApJ 499, L115.
- 14 Giallongo E., Cristiani S., 1990, MNRAS 247, 696.
- 15 Giavalisco, M., Steidel, C. C., Macchetto, F. D., 1996, ApJ 470, 189.
- 16 Hu, E. M., Cowie, L. L., McMahon, R. G., 1998, ApJ 502, L99
- 17 Kneib, J.-P., Melnick, J., Gopal-Krishna, 1994, A&A 290, 25.
- 18 Kneib, J.-P., Ellis, R.S., Smail, I.R., Couch, W.J., Sharples, R., 1996, ApJ 471, 643.
- 19 Kochanek C.S., Narayan, R., 1992, ApJ 401, 461.
- 20 Le Borgne J.F., Mathez G., Mellier Y., Pelló R., Sanahuja B., Soucail G., 1991, A&AS 88, 133
- 21 Le Fèvre O., Crampton D., Felenbok P., Monnet G., 1994, A&A 282, 325
- 22 Lilly, S., Le Fèvre O., Hammer F., Crampton D., 1996, ApJ 460, L1
- 23 Loveday J., Peterson B.A., Efstathiou, G., Maddox, S.J., 1992, ApJ 390, 338.
- 24 Lowenthal J.D., Koo D.K., Guzmán R., Gallego J., Phillips A.C., Faber S.M., Vogt N.P., Illingworth G.D., 1997, ApJ 481, 673
- 25 Madau P., 1995, ApJ 441, 18.
- 26 Miralles, J.M., 1998, PhD. U. Paul Sabatier.
- 27 Miralles, J.M., Pelló R., 1998, ApJ submitted, (astro-ph/9801062).
- 28 Moscardini, L., Coles, P., Lucchin, F., Matarrese, S., 1997, MNRAS 299, 95.
- 29 Oke J.B., Korycansky, D.G., 1982, ApJ 255, 11.
- 30 Pelló R., Le Borgne J.F., Soucail G., Mellier Y., Sanahuja B., 1991, ApJ 366, 405
- 31 Pelló R., Kneib, J.P., Bruzual, G., Miralles J.M., 1998, in Proceedings of the Xèmes Rencontres de Blois: ”The Birth of Galaxies”, 28th june to 4th July 1998, (astro-ph/9809151).
- 32 Pierre, M., Le Borgne J.F., Soucail G., Kneib J.-P., 1996, A&A 311, 413
- 33 Prévot, M. L., Lequeux, J., Prévot, L., Maurice, E.; Rocca-Volmerange, B. 1984, A&A 132, 389
- 34 Ulmer et al. 1986,
- 35 Salpeter E.E., 1955, ApJ 121, 161
- 36 Sawicki, M.J., Lin, H., Yee, H.K.C., 1997, AJ, 113, 1
- 37 Seitz, S., Saglia, R. P., Bender, R., Hopp, U., Belloni, P., Ziegler, B. 1998, MNRAS 298, 945
- 38 Soifer, B.T., Neugebauer, G., Franx, M., Matthews, K., Illingworth G.D., 1998, ApJ 501, 171
- 39 Spaans M., Carollo C. M., 1998, ApJ 502, 640
- 40 Steidel C.C., Hamilton, D., 1992, AJ 104, 941
- 41 Steidel C.C., Hamilton, D., 1993, AJ 105, 2017
- 42 Steidel C.C., Giavalisco M., Pettini M., Dickinson M., Adelberger K., 1996a, ApJ 462, L17
- 43 Steidel C.C., Giavalisco M., Dickinson M., Adelberger K., 1996b, AJ 112, 352
- 44 Steidel C.C., Adelberger K., Dickinson M., Giavalisco M., Pettini M., Kellogg, M., 1998, ApJ 492, 428
- 45 Trager S. C., Faber S. M., Dressler A., Oemler A., 1997, ApJ 485, 92.
- 46 Yee, H.K.C., Ellingson, E., Bechtold J., Carlberg, R.G., Cuillandre J.-C. 1996a, AJ 111, 1783
- 47 Yee, H.K.C., Ellingson, E., Abraham, R.G., Gravel, P., Carlberg, R.G., Smecker-Hane, T.A., Schade, D., Rigler, M. 1996b, ApJ Supp.102, 289