ROSAT HRI Detection of the 16 ms Pulsar PSR J0537-6910 Inside SNR N157B
Abstract
Based on a deep ROSAT HRI observation, we have detected a pulsed signal in the 0.1-2 keV band from PSR J0537-6910 — the recently discovered pulsar associated with the supernova remnant N157B in the Large Magellanic Cloud. The measured pulse period 0.01611548182 ms 0.02(ns), Epoch MJD 50540.5, gives a revised linear spin-down rate of , slightly greater than the previously derived value. The narrow pulse shape (FWHM duty cycle) in the ROSAT band resembles those seen in both RXTE and ASCA data ( keV), but there is also marginal evidence for an interpulse. This ROSAT detection enables us to locate the pulsar at R.A., Dec (J2000) = . With its uncertainty , this position coincides with the centroid of a compact X-ray source. But the pulsed emission accounts for only of the source luminosity in the 0.1-2 keV band. These results support our previous suggestions: (1) The pulsar is moving at a high velocity (); (2) A bow shock, formed around the pulsar, is responsible for most of the X-ray emission from the source; (3) A collimated outflow from the bow shock region powers a pulsar wind nebula that accounts for an elongated non-thermal radio and X-ray feature to the northwest of the pulsar.
keywords:
pulsars: general — pulsars: individual (PSR J0537-6910) — X-rays: general — supernova remnantWang & Gotthelf \rightheadThe X-ray Pulsar in N157B
1 Introduction
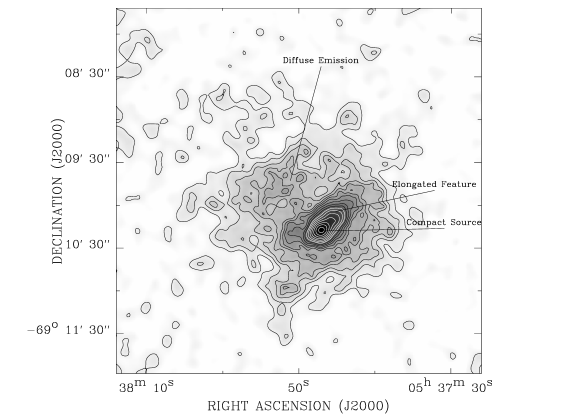
PSR J0537-6910 is the most rapidly rotating young pulsar known. It was detected serendipitously by Marshall et al. (1998) while searching for a pulsed signal from nearby SN 1987A with the Rossi X-ray Timing Explorer (RXTE). Using archival data of the region acquired with the Advanced Satellite for Cosmology and Astrophysics (ASCA), they further located the pulsed emission to within the radius of the supernova remnant (SNR) N157B in the Large Magellanic Cloud (LMC). This SNR is a moderately bright X-ray source in the 30 Doradus star formation region and is clearly imaged with the ROSAT High Resolution Imager (RHRI) as isolated diffuse emission (Fig. 1), east of SN 1987A, and northwest of the PSR B054069.
Before the discovery of PSR J0537-6910, Wang & Gotthelf (1998) showed that the SNR N157B contains a bright, elongated, and non-thermal X-ray feature, which dominates the SNR emission and is most likely a pulsar wind nebula. Near the southeast end of the feature is a compact X-ray source with a spatial extent of . They suggested that this source represents the pulsar and its interaction with the surrounding medium. The predicted SNR age yrs agrees with the characteristic spin-down age of PSR J0537-6910 (Marshall et al. 1998). These studies have established N157B as the latest addition to the rare class of Crab-like remnants (e.g., Seward 1989), of which only three confirmed examples were known previously: the Crab Nebula, the MSH 15–52 nebula, and LMC SNR B0540693.
We report in this Letter the detection of pulsed soft X-ray emission from PSR J0537-6910, using a deep RHRI observation recently acquired. This detection is the first in the energy band below 2 keV. This band-pass is not available to X-ray detectors with poor spatial resolution, because of the overwhelming soft X-ray emission from both the pulsar wind nebula and the diffuse thermal hot gas of N157B. Pulse phase-resolved high resolution imaging capability of the RHRI further enables us to locate the pulsar with a linear position accuracy of , a factor of better than the previous measurements. The pulsar location confirms our early suggestion of the compact X-ray source as the site of the pulsed emission. The accuracy of the location may also allow for identification of pulsar counterparts in other wavelength bands.
2 Observation and Data Reduction
The new RHRI observation was taken as part of our ongoing X-ray investigation of the 30 Dor region. The high resolution X-ray image of N157B as shown in Fig. 1 is a co-add of the data from ROSAT observation Sequence No. rh600228n00 (30 ks exposure taken between Dec. 12, 1992 - Jun. 14, 1993; Wang 1995; Wang & Gotthelf 1998), rh400779n00 (26 ks between Aug. 21, 1996 - Jan. 27, 1997) and rh400779a01 (79 ks between April 3-29, 1997). The first two exposures are, however, too short to be effective for detecting the pulsar. Our timing analysis was thus based exclusively on the latest observation. During the observation, the satellite was wobbled, and PSR J0537-6910 was located very close () to the time-averaged optical axis. The expected Point Spread Function (PSF) is about 6′′ (FWHM).
We processed the data to optimize their timing and positioning accuracy. First, we deleted time intervals with unstable detector roll angles and/or with fewer than 3 guide stars for position tracking, and shifted counts in individual observing segments (typically about 1 ks long) to have a common centroid position of the compact source (Fig. 1). This process improved the photon position accuracy by about 1′′ in terms of the FWHM of the PSF. The source is not strong enough, however, to allow for a wobble phase-resolved centroid correction; thus significant wobble phase-dependent pointing errors may still be present in the data. Second, we corrected the absolute astrometry of the data by matching the X-ray and optical positions of three identified objects (the foreground stars cal 69 and cal 71 as well as the LMC 50 ms pulsar B0540-69; Wang 1995). After this correction, the residual differences between the X-ray and optical positions of these three objects are all less than . Third, to reduce the non-cosmic contamination we selected data only within the pulse height channel 2-10. Fourth, we converted the arrival time of each photon to the solar system barycenter using the JPL DE200 ephemeris.
3 Data Analysis and Results
For the timing analysis, we extracted counts within a circle of 7′′ radius around the centroid of the compact source — the suspected location of the pulsar (Wang & Gotthelf 1998). These counts were to be used to search for the periodic signal around the pulse frequency () extrapolated from the previously measured values and the mean frequency derivative (Marshall et al. 1998). However, we found that a small uncertainty in could cause a significant phase shift over the observation’s total duration of 2234676 s, during which individual observing segments were separated by various data gaps resulting from the satellite passage through the South Atlantic Anomaly, Earth occultation, etc. Based on the scatter of measured pulse frequencies around the linear spindown relation (Marshall et al. 1998), we estimated that the uncertainty is , which could cause a phase shift of 0.2 cycle. Thus we removed several small observing segments (total 266 counts) that were largely separated from the main middle portion of the observation. The remaining 1288 counts are all within MJD 50545.0-50554.8 (849270 s). Over this time interval the phase shift of 0.03 cycle is sufficiently small, compared to the pulse width of cycle (FWHM).
We then constructed a frequency-gram ( vs. ) of the selected counts to search for the periodic signal. For each trial frequency, we folded the counts into 10 phase bins to optimize the signal in the counting noise-dominated data and calculated the statistic of the resultant profile to test against the null hypothesis of no signal. A significant signal with () is clearly present in the frequency-gram. Due to the presence of noise in the data, the peak with the maximum value, however, is not necessarily the optimal measurement of the signal period. In fact, the exact peak period depends slightly on the frequency step used to construct the frequency-gram. Both the noise and the frequency step dependency can be suppressed by convolving the frequency-gram with an appropriate filter. We generated such a filter directly with the smoothed signal peak in the frequency-gram with the smallest frequency step. Because the shape of the peak depends primarily on the pulse profile and on the total observing duration, the filter can be re-binned for frequency-grams with larger steps. We adopted the signal peak centroid of the filtered frequency-gram as our period measurement (Table 1), which is nearly independent of its chosen frequency step and is insensitive to the exact shape of the filter. An analog of this approach is the position centroid determination of a source in a 2-D X-ray image convolved with its PSF, or simply with a Gaussian filter.
The uncertainty in our period measurement of the pulsar is determined through Monte Carlo simulations, based on the measured pulse profile before the binning and on the actual observing segments. Each of our 1000 simulated data sets had the same number of counts as in the observed data, and were analyzed in the exactly same way. The dispersion in the obtained period distribution was adopted as an estimate of the uncertainty in our measurement of the pulsar period (Table 1).
| Table 1: Pulsar Parameters | |
|---|---|
| R.A. (J2000) | |
| Dec. (J2000) | |
| Frequency (MJD 50540.5) | |
| Mean (1993-1997) | |
| or Mean | |
| Pulse Width (FWHM) | ms |
| RHRI Count Rate | |
| Pulsed Flux (0.1-2 keV)a | |
a Assuming a power law spectrum of energy slope and an absorption of (40% solar abundance; Marshall et al. 1998.; Wang & Gotthelf 1998).

Fig. 2 shows the pulse profile. The pulse profile is narrow (FWHM duty cycle) and resembles the ones seen in the previous detections (§1), all of which are in energy bands keV. The pulsed intensity is about 30% of the total intensity during the full-width duty cycle of , or about 10% if averaged over the full cycle. Fig. 2 also indicates the presence of a possible weak interpulse, about 0.5 phase-shifted from the main pulse; but the significance of the detection is low ().

There is little doubt that the pulsar is indeed within our adopted count collecting aperture. We find that the pulsed signal diminishes with the increase of the aperture radius, apparently due to the proportional increase of unpulsed emission from the remnant. To determine the pulsar position accurately, we produced an image corresponding to the pulsed emission only. The insert of Fig. 3 includes an on-pulse intensity image with the off-pulse data subtracted. The intensity was calculated within the phase interval between 0.55 and 0.80. The average radial intensity distribution around the source centroid in the image is consistent with the PSF (Fig. 3). We thus adopt the source centroid as the position of the pulsar. The statistical uncertainty in the position is . But we could not rule out a systematic error up to , introduced by such effects as the asymmetric shape of off-axis PSF, which may affect the accuracy of our astrometry correction (§2). Fig. 3 also includes an off-pulsed intensity image which clearly shows a strong intensity peak, probably barely resolved, and an elongated feature that extends at least to the northwest.
4 Discussions and Conclusions
The above results, as summarized in Table 1, provide an accurate position of PSR J0537-6910 inside the SNR N157B, represent the first detection of the pulsar in the 0.1-2 keV band, and extend the period measurement of the pulsar to Epoch 1997. This latest measurement, together with the earliest ASCA observation (June 13, 1993; Marshall et al. 1998), gives an average period derivative (Table 1) that is slightly greater than as derived from the ASCA and 1996 RXTE observations (Marshall et al. 1998). This discrepancy is consistent with the presence of a giant pulsar glitch () occurred between the latter pair of observations. The pulsed emission accounts for only of the total luminosity of SNR N157B in the RHRI 0.1-2 keV band (Wang & Gotthelf 1998). This pulsed contribution is substantially smaller than in the ASCA ( keV) band, but is consistent with the extrapolated 0.1-2 keV flux from the high energy band (Table 1). The pulsed emission spectrum (power law energy slope ) is significantly harder than the mean remnant spectrum (; Wang & Gotthelf 1998). The 0.1-10 keV luminosity of the pulsed emission (into 4) is , or of the pulsar’s spin-down luminosity.
These new results are fully consistent with our early suggestion about the dynamic relationship between the pulsar and the Crab-like remnant N157B (Wang & Gotthelf 1998). First, as indicated by a separation of between the X-ray and radio emission peaks of the remnant, the pulsar is likely moving at a high velocity (). Second, this motion has led to the formation of a bow shock around the pulsar. The enhanced synchrotron radiation of relativistic particles in the shocked pulsar wind accounts for the unpulsed component of the compact source. Third, a collimated outflow, driven by the pressure difference between the bow shock and the ambient medium (Wang & Gotthelf 1998; see also Wang et al. 1993), powers an extended pulsar wind nebula where most of the pulsar spindown energy has been dumped. The separation between the pulsar and the main pulsar wind nebula explains the elongated feature seen in both radio and X-ray. While both the pulsar position and the small pulsed contribution to the compact source are confirmed here, we continue to study the relationship between PSR J0537-6910 and N157B using archival data in various energy bands and with upcoming AXAF observations.
Acknowledgements.
Acknowledgments — We thank J. Halpern for suggesting the use of IRAF/PROS for the barycenter correction and J. Finley, the referee, for communicating his comments directly to us. Q.D.W. is supported partly by NASA LTSA grant NAG5-6413. E.V.G. is supported by USRA under NASA contract NAS5-32490.References
- [1] Marshall, F. E., Gotthelf, E. V., Zhang, W., Middleditch, J., & Wang, Q. D. 1998, ApJL, 499, 179
- [2] Seward, F. D. 1989, SSR, 49, 385
- [3] Wang, Q. D. 1995, ApJ, 453, 783
- [4] Wang, Q. D., & Gotthelf, E. V. 1998, ApJ, 494, 623
- [5] Wang, Q. D., Li, Z.-Y., & Begelman, M. C. 1993, Nature, 364, 127