e-mail: jura@haemimont.bg 22institutetext: NASA Goddard Space Flight Center, Code 681, Greenbelt, MD 20771, USA
e-mail: catelan@stars.gsfc.nasa.gov, sweigart@bach.gsfc.nasa.gov 33institutetext: Osservatorio Astronomico di Bologna, via Zamboni 33, I-10126 Bologna, Italy
e-mail: ferraro@astbo3.bo.astro.it 44institutetext: Osservatorio Astronomico di Roma, I-00040 Monte Porzio Catone, Italy
e-mail: buonanno@astrmp.mporzio.astro.it, iannicola@coma.mporzio.astro.it 55institutetext: Sternwarte der Universität Bonn, Auf dem Hügel 71, D-53121 Bonn, Germany
e-mail: richtler@astro.uni-bonn.de
The outer-halo globular cluster NGC 6229.
III. Deep CCD photometry
Abstract
Deep photometry for a large field covering the outer-halo globular cluster NGC 6229 is presented. For the first time, a colour-magnitude diagram (CMD) reaching below the main sequence turnoff has been obtained for this cluster. Previous results regarding the overall morphology of the horizontal and giant branches are confirmed. In addition, nine possible extreme horizontal-branch stars have been identified in our deep images, as well as thirty-three candidate blue stragglers. We also find the latter to be more centrally concentrated than subgiant branch stars covering the same range in magnitude.
A comparison of the cluster CMD with the M 5 (NGC 5904) ridgeline from Sandquist et al. (1996) reveals that:
i) NGC 6229 and M 5 have essentially identical metallicities;
ii) NGC 6229 and M 5 have the same ages within the errors in spite of their different horizontal-branch morphologies.
Key Words.:
Stars: blue stragglers – Stars: Population II – Stars: Hertzsprung-Russell (HR) diagram – Galaxy: globular clusters: individual: NGC 6229 – Galaxy: globular clusters: individual: M 51 Introduction
NGC 6229 (C1645+476) is one of the most remote globular clusters (GCs) associated with the Galaxy, lying about 30 kpc from the Galactic center (Harris 1996). This outer-halo GC was studied photometrically by Cohen (1986) and Carney et al. (1991) and, more recently, by Borissova et al. (1997, hereafter BCSS97), who presented CCD photometry of the central part of this mildly concentrated GC (). In none of these studies, however, was the turnoff (TO) point of the cluster clearly reached, so that no conclusions regarding its age could be made.
As discussed extensively in the two previous papers of this series (BCSS97; Catelan et al. 1998), NGC 6229 shows both a “gap” on the blue horizontal branch (HB) and HB bimodality – unique characteristics among outer-halo GCs. As argued by many authors, an understanding of the nature of the detected peculiarities in “bimodal” and “gap” clusters would be of paramount importance for clarifying the nature of the so-called second-parameter phenomenon (e.g., Buonanno et al. 1985; Catelan et al. 1998; Ferraro et al. 1998; Rood et al. 1993; Stetson et al. 1996; Sweigart 1999; Sweigart & Catelan 1998). Since age is one of the most prominent second-parameter candidates (e.g., Chaboyer et al. 1996b), and since it has been suggested that the outer-halo GC system is younger than the inner-halo one, obtaining deep photometry below the turnoff in NGC 6229 is clearly of considerable interest. For recent discussions on the ages of outer-halo GCs – specifically, NGC 2419, Palomar 3, Palomar 4, Palomar 14, and Eridanus – the reader is referred to Harris et al. (1997), Sarajedini (1997), Stetson et al. (1999), Catelan (1999), and VandenBerg (1999a, 1999b).
In this paper we present, for the first time, deep photometry reaching below the NGC 6229 TO level. Our observational material and data reduction techniques are described in Sect. 2 together with our analysis of the photometric errors and completeness corrections. Several aspects of the colour-magnitude diagram (CMD) of NGC 6229 including candidate blue straggler and extreme HB stars are described in Sect. 3. The metallicity of NGC 6229, as determined from various photometric indicators, and its age relative to M 5, as derived from a differential application of both the “vertical” and “horizontal” methods, are then discussed in Sects. 4 and 5, respectively. In Sect. 6 we summarize the most important results of the present investigation.
In the next paper of this series, a detailed investigation of the RR Lyrae population in NGC 6229 will be provided.
2 Observations
2.1 CCD photometry
Our analysis is based on the following observational material:
1. A large set of CCD frames obtained on the nights of August 25-26 1987, at the Calar Alto observatory (Spain) of the Max-Plank Institute für Astronomie (Heidelberg), using the 3.5m telescope equipped with a RCA chip (hereafter “CA dataset”). The array scale was , giving a field of view of about . Only the nine frames with the best seeing (FWHM better than ) were used to obtain the deep photometry down to mag presented in this paper. Three partially overlapping fields, covering a total area of around the cluster center, were observed during the run. However, only short exposures () were obtained in the field centered on the cluster center, while long exposures (ranging from up to ) were secured only in the two more external fields placed at North-West and South-West with respect to the cluster center.
2. Fifty-four frames obtained on June 28-30 1997, plus six frames obtained on October 6-8 1997 at the 2m Ritchey-Chrétien telescope of the Bulgarian National Astronomical Observatory “Rozhen” with a Photometrics CCD camera (hereafter “Rozhen dataset”). The seeing during these observations was with stable and very good photometric conditions. The scale at the Cassegrain-focus CCD was and the observing area was , centered on the cluster center. Ten and 10 frames obtained under the best photometric conditions were added up, resulting in total exposure times of and , respectively. Two standard fields of M 67 (Christian et al. 1985) were taken before and after the observations, for calibration purposes.
2.2 Data reduction
The stellar photometry of the frames was carried out independently using ROMAFOT (Buonanno et al. 1983) for the CA dataset and DAOPHOT/ALLSTAR (Stetson 1993) for all other frames. Instrumental magnitudes were determined for 1500 – 5000 stars on each frame.
The instrumental values of all the “Rozhen” frames were transformed to the standard system using the standard field in M 67 (Christian et al. 1985). Due to unfavorable weather conditions during the CA run, no independent photometric calibration was possible for the CA dataset. For this reason, the magnitudes of this sample were originally referred to the Johnson system using a large set of stars in common with Carney et al. (1991). In order to check the compatibility of the magnitude systems of the two datasets, we adopted the following procedure: we first transformed the Rozhen coordinate system to the CA local system and then searched for stars in common between the two datasets – resulting in a sample of more than 900 stars. The residuals in magnitude and colour for the stars in common do not show any systematic difference or trend so we can conclude that the two datasets are homogeneous in magnitude within the errors. This result also suggests that the calibration obtained for the Rozhen dataset and adopted for the whole dataset presented in this paper nicely agrees with the Carney et al. (1991) zero point.
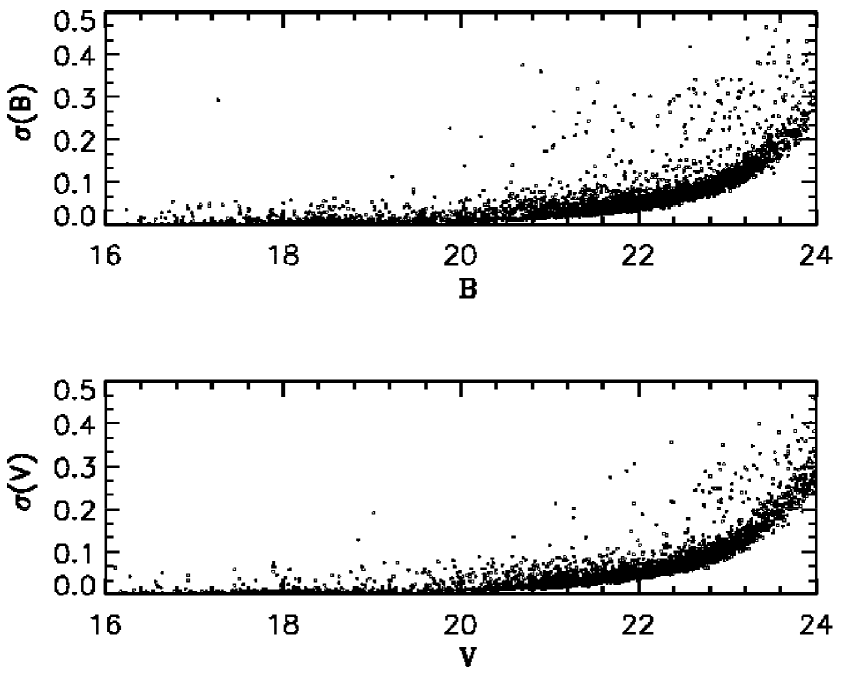
2.3 Photometric errors
In order to estimate the internal accuracy of our CCD measurements for the Rozhen dataset, we used the formal errors from the DAOPHOT package and the rms frame-to-frame scatter of the instrumental magnitudes. The formal errors for all stars vs. their magnitudes are displayed in Figure 1. As can be seen, we have large errors ( mag) for mag and mag, which therefore define the faint limit of the Rozhen photometry ( mag fainter than the TO point in ).

Following the method described in Ferraro & Paresce (1993), we calculated the rms frame-to-frame scatter of the instrumental magnitudes of the 15 and frames from the Rozhen dataset obtained in the same seeing and FWHM. The plot of the rms scatter vs. the mean magnitudes in the and filters is given in Figure 2. The mean rms scatter in both filters over the whole magnitude interval is 0.02 mag.
The errors in the CA case, given in Table 1, were determined as the rms scatter of multiple measures of stars observed in the overlapping regions of adjacent fields. Also given in Table 1 are the errors obtained for the Rozhen dataset.
| range | ||||
|---|---|---|---|---|
| 0.02 | 0.02 | 0.02 | 0.01 | |
| 0.06 | 0.06 | 0.04 | 0.03 | |
| 0.10 | 0.10 | 0.12 | 0.15 |
The final photometric accuracy for the Rozhen and CA datasets should include all of these error estimates. From the errors given in Figures 1 and 2 and Table 1 we conclude that the total uncertainty is mag for mag and mag and between 0.05 mag and 0.1 mag for the fainter magnitudes.
| range | ||
|---|---|---|
| 1.00 | 1.00 | |
| 1.00 | 1.00 | |
| 1.00 | 1.00 | |
| 1.00 | 1.00 | |
| 1.00 | 1.00 | |
| 1.00 | 1.00 | |
| 1.00 | 1.00 | |
| 0.99 | 1.00 | |
| 0.96 | 0.97 | |
| 0.92 | 0.94 | |
| 0.86 | 0.88 | |
| 0.69 | 0.74 | |
| 0.55 | 0.61 | |
| 0.38 | 0.44 | |
| 0.18 | 0.24 | |
| 0.06 | 0.10 |
2.4 Completeness corrections
The last step in our data reduction was to determine the completeness functions in the and filters. We used the artificial star technique (Stetson & Harris 1988; Stetson 1991a, 1991b) to create a series of artificial frames by means of the ADDSTAR routine in DAOPHOT II. These artificial frames were then re-reduced in the same manner as the original frames to obtain the completeness functions and , defined as the ratio of recovered to added artificial stars. The completeness functions for the Rozhen dataset are listed in Table 2.
| Branch | CA sample | Rozhen sample | |
|---|---|---|---|
| MS | 234 | 225 | 1.04 |
| SGB | 236 | 278 | 0.85 |
| RGB | 31 | 26 | 1.19 |
| Red HB | 6 | 7 | 0.86 |
| RR Lyraes | 4 | 5 | 0.80 |
| Blue HB | 14 | 10 | 1.40 |
| AGB | 6 | 6 | 1.00 |
| BSS | 8 | 7 | 1.14 |
| Field stars | 13 | 14 | 0.93 |
Since no specific artificial star test has been performed on the CA sample, we can compare the relative completeness degree of the two samples from a direct comparison of the star counts found in each evolutionary branch. In doing this we selected an area common to both datasets relatively far from the cluster center (). Then we derived the CMDs over this area for the two samples and counted the number of stars in each branch (with mag) uncorrected for completeness. The number of stars for the cluster branches and the ratio between the numbers found in the CA and Rozhen datasets are given in Table 3. As can be seen, the two samples have very closely the same overall degree of completeness.
3 The Colour-Magnitude Diagram
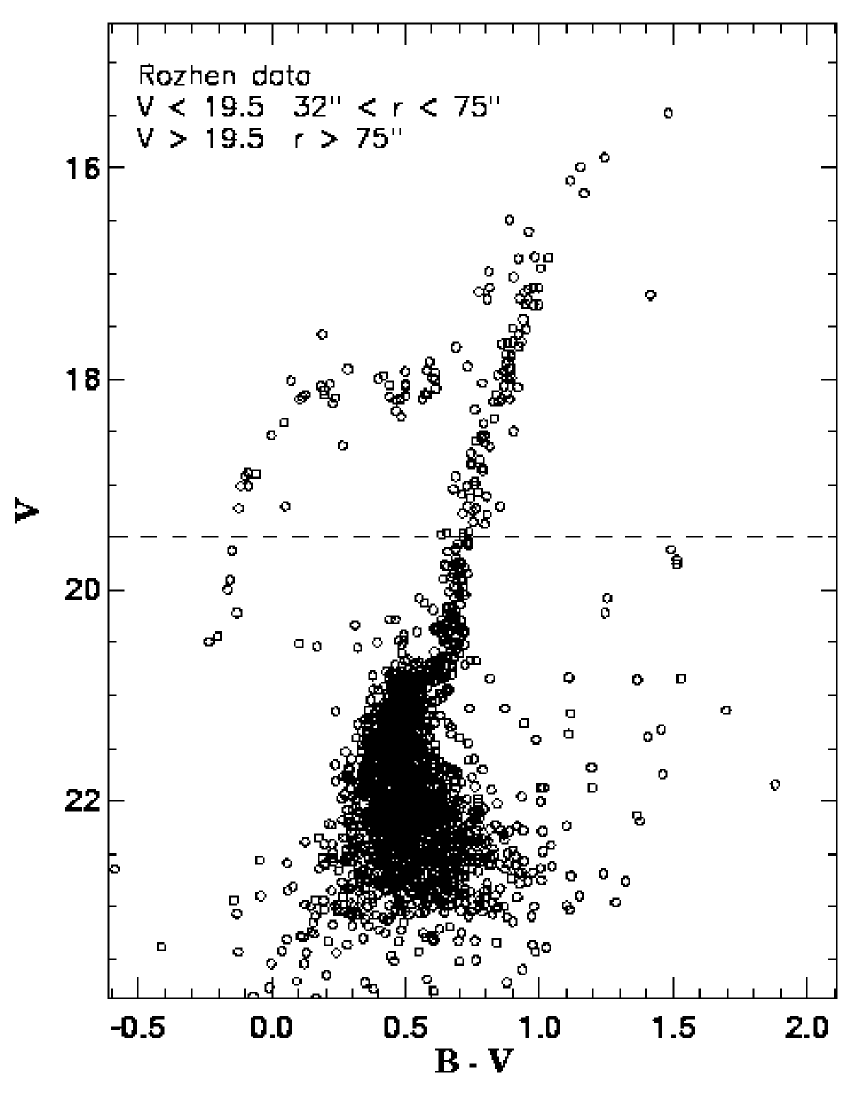
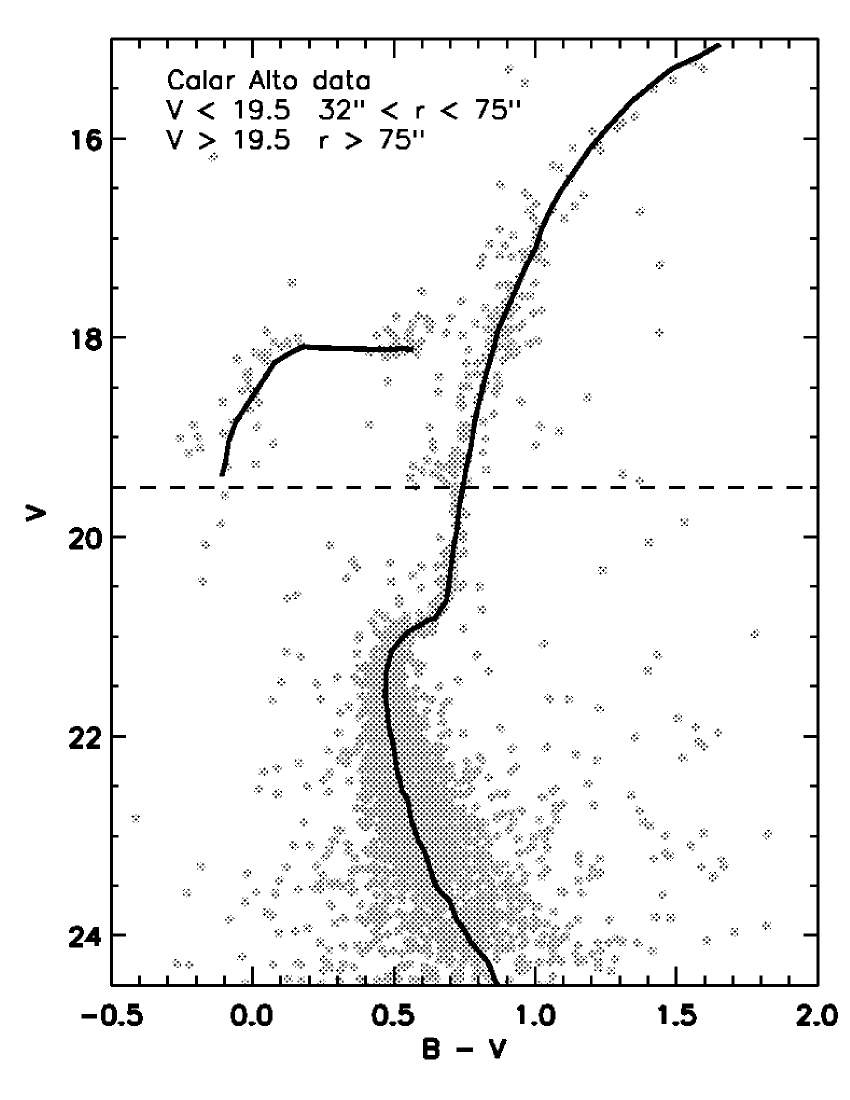
3.1 Overall CMD morphology
The , CMDs for the Rozhen and CA datasets are presented in Figures 3 and 4, respectively. The following selection criteria were adopted in order to have the best definitions of the CMD branches: for mag, only stars with from the cluster center were plotted [we find the subgiant branch (SGB)-TO region to be better defined in this region]; for stars with mag, the annular region with was employed (thus avoiding the crowding in the innermost regions while minimizing field star contamination). In Figure 4 the M 5 (NGC 5904) ridgeline from Sandquist et al. (1996) is overplotted. Vertical and horizontal shifts of mag and mag, respectively, have been applied to the M 5 mean ridgelines. The magnitude shift was determined in order to have a good match to the red HB of NGC 6229, while the colour shift was derived by matching the lower RGBs ( mag; see Figure 4 and Figure 9a).
The , CMD for 818 stars in common between the Rozhen and CA datasets is presented in Figure 5. To avoid crowding in the innermost regions only stars with and mag have been plotted. Blue straggler stars (BSS) and extreme HB (EHB) candidates (see Sects. 3.3 and 3.4) are plotted as asterisks and filled squares, respectively. From the comparison of Figure 5 with Figures 3 and 4 it is evident that most of these stars are located in the innermost regions ().
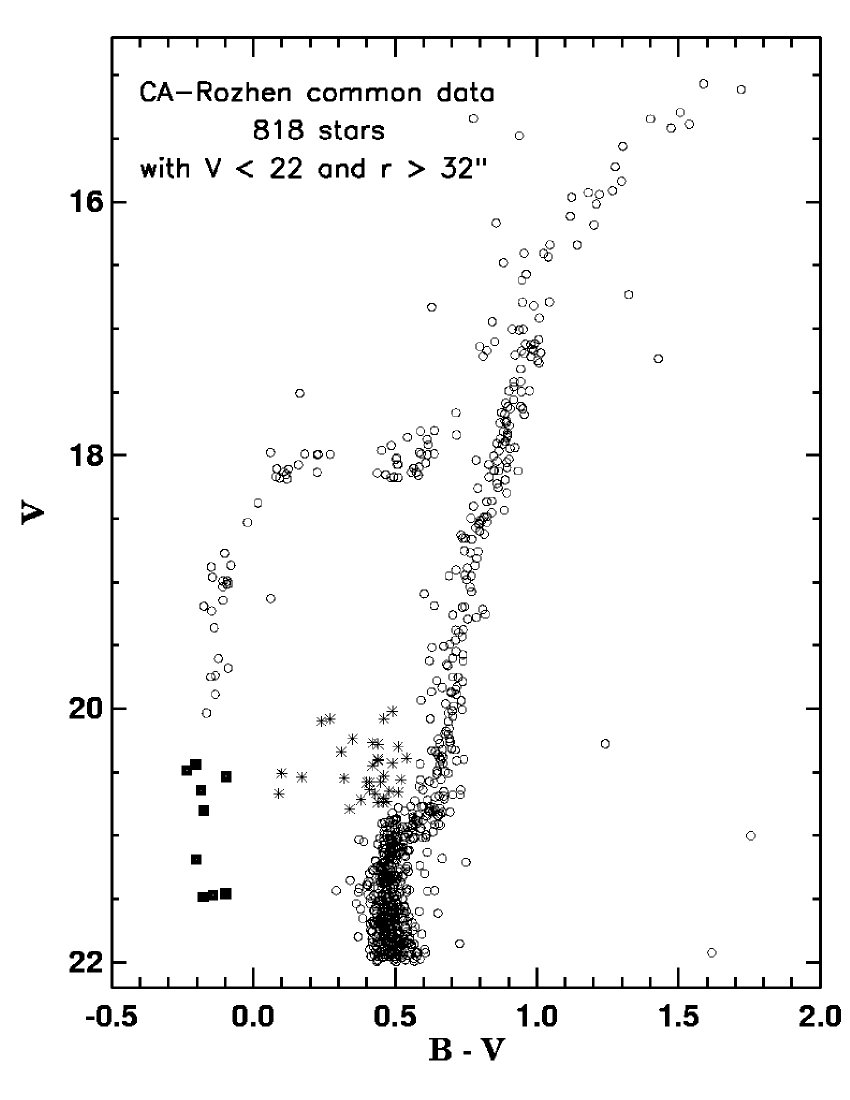
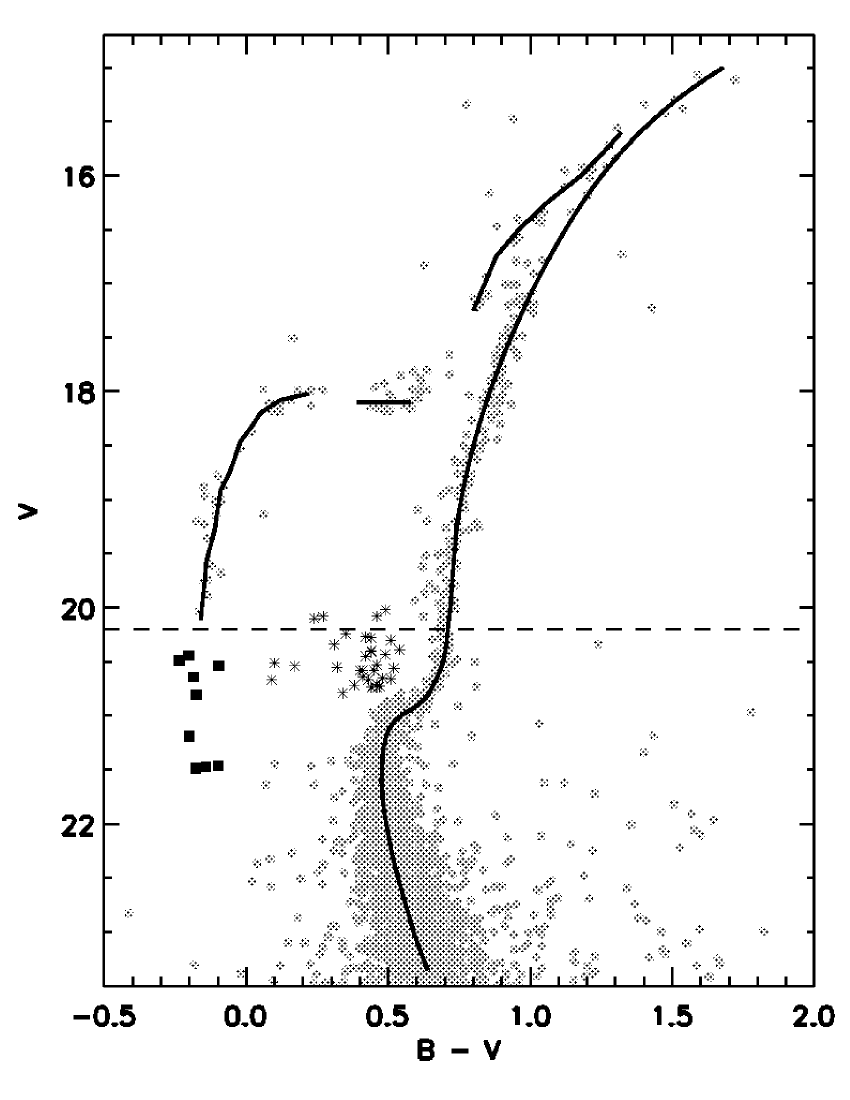
Our new CMD generally confirms the previous photometric results of BCSS97. In particular, we can clearly see the presence of both a red giant branch (RGB) and an asymptotic giant branch (AGB) population, besides the bimodal HB with a long blue tail and a “gap” at mag extensively discussed by BCSS97 and Catelan et al. (1998). There is a hint of a second gap, located at mag, as previously noted by Carney et al. (1991). Importantly, however, we have for the first time clearly identified the main-sequence (MS) TO point as well as a population of BSS only hinted at in previous photometric results (see Figure 3 in Carney et al. 1991, and Figure 2 in BCSS97) and a possible extension of the blue-HB tail to the EHB region. Each of these new features will be discussed in the subsections below.
The CMD in Figure 5, augmented by data from the CA dataset for mag, was used to determine the fiducial lines of the main branches of NGC 6229 by means of a least-squares fit. The best fit of the upper part of the RGB ( mag) was obtained with an equation of the form:
| (1) |
where . In determining the free parameters in eq. (1) we rejected stars lying far from the mean branches and suspected field stars during the several iterations. The std. error of the resulting fit is 0.09 mag. The mean ridgelines of the fainter RGB ( mag), SGB, MS and BHB were determined by dividing these branches into bins and computing in each bin the mode of the distribution in colour. Only the CA dataset was used to define the fiducial line of the MS region. Ten stars in common with the Rozhen dataset for which the DAOPHOT parameters SHARP and CHI indicated possible blends were discarded. Table 4 presents the adopted normal points for each branch. The resulting ridgeline is plotted in Figure 6, along with the stars from both the Rozhen and CA datasets employed to obtain such a ridgeline. The 10 possible blends noted above have not been removed from the plot; they all have mag, mag, and can be recognized as a “clumpy” structure immediately below the BSS region in the CMD.
The MS TO point is found to be at mag and mag. The quoted errors are the errors of the fitting procedure. The magnitude level of the HB, determined as the lower boundary of the red HB “clump”, is mag. This implies a magnitude difference between the HB and the TO of mag.
3.2 Number ratios
| MS+SGB+RGB | Red HB | ||||
| 15.00 | 1.680 | 18.70 | 0.781 | 18.10 | 0.58 |
| 15.10 | 1.620 | 18.80 | 0.772 | 18.10 | 0.48 |
| 15.20 | 1.566 | 18.90 | 0.764 | 18.10 | 0.39 |
| 15.30 | 1.515 | 19.00 | 0.757 | Blue HB | |
| 15.40 | 1.469 | 19.10 | 0.750 | 18.02 | 0.22 |
| 15.50 | 1.426 | 19.20 | 0.744 | 18.08 | 0.12 |
| 15.60 | 1.386 | 19.28 | 0.740 | 18.13 | 0.09 |
| 15.70 | 1.349 | 19.43 | 0.735 | 18.20 | 0.05 |
| 15.80 | 1.315 | 19.70 | 0.727 | 18.32 | 0.02 |
| 15.90 | 1.283 | 19.96 | 0.720 | 18.46 | |
| 16.00 | 1.253 | 20.21 | 0.709 | 18.61 | |
| 16.10 | 1.224 | 20.39 | 0.702 | 18.76 | |
| 16.20 | 1.197 | 20.52 | 0.691 | 18.91 | |
| 16.30 | 1.172 | 20.63 | 0.675 | 19.08 | |
| 16.40 | 1.147 | 20.77 | 0.648 | 19.27 | |
| 16.50 | 1.124 | 20.84 | 0.630 | 19.57 | |
| 16.60 | 1.102 | 20.90 | 0.606 | 19.85 | |
| 16.70 | 1.080 | 20.95 | 0.575 | 20.11 | |
| 16.80 | 1.059 | 21.00 | 0.544 | AGB | |
| 16.90 | 1.039 | 21.05 | 0.522 | 15.60 | 1.32 |
| 17.00 | 1.020 | 21.13 | 0.502 | 15.75 | 1.27 |
| 17.10 | 1.001 | 21.20 | 0.491 | 16.00 | 1.18 |
| 17.20 | 0.983 | 21.25 | 0.488 | 16.25 | 1.06 |
| 17.30 | 0.966 | 21.31 | 0.482 | 16.50 | 0.96 |
| 17.40 | 0.949 | 21.42 | 0.479 | 16.75 | 0.88 |
| 17.50 | 0.932 | 21.52 | 0.478 | 17.00 | 0.84 |
| 17.60 | 0.916 | 21.60 | 0.477 | 17.25 | 0.80 |
| 17.70 | 0.901 | 21.70 | 0.478 | ||
| 17.80 | 0.886 | 21.80 | 0.482 | ||
| 17.90 | 0.872 | 21.94 | 0.489 | ||
| 18.00 | 0.858 | 22.08 | 0.499 | ||
| 18.10 | 0.845 | 22.23 | 0.510 | ||
| 18.20 | 0.833 | 22.36 | 0.521 | ||
| 18.30 | 0.821 | 22.63 | 0.549 | ||
| 18.40 | 0.810 | 23.02 | 0.592 | ||
| 18.50 | 0.800 | 23.35 | 0.638 | ||
| 18.60 | 0.790 | ||||
The conclusions from BCSS97 regarding the ratio (Iben 1968) between HB stars and RGB stars brighter than the HB are confirmed. Using all the available data (BCSS97, CA and Rozhen), we find the following number counts: (including 9 candidate EHB stars; cf. Sect. 3.4 below), , and . It thus follows that ( excluding the suspected EHB stars). For , the values are and , respectively. Note that the BCSS97 number counts have been corrected for completeness as described therein. We have assumed a differential bolometric correction between the HB and the RGB of 0.15 mag (Buzzoni et al. 1983). As emphasized by Carney et al. (1991) and BCSS97, these and values for NGC 6229 indicate either a low cluster helium abundance () or the presence of a substantial, but as yet undetected, population of EHB stars (see BCSS97 for more details).
As noted by BCSS97, a low helium abundance for NGC 6229 would lead to a red HB morphology, as opposed to what is observed (Figure 5). In fact, there is even a hint of an (extremely hot) EHB population in NGC 6229 (see Sect. 3.4).
Since in Sect. 5 the age of NGC 6229 will be compared with that of M 5, it is important to investigate any possible differences in the chemical composition which could invalidate the comparison.111Note that the “horizontal” method of relative-age determination is essentially helium abundance-independent (e.g., Bolte 1990). The “vertical” method of age derivation is also weekly dependent on , provided the adopted GC distance scale is model-independent – coming, for instance, from the Baade-Wesselink method applied to RR Lyrae variables. It is only in those instances where the helium abundance is consistently used to estimate the HB (and TO) luminosity by means of evolutionary models that the “vertical” method becomes substantially dependent on . This topic is discussed at some length in Sect. 4 of Catelan & de Freitas Pacheco (1996). While the discussion of the metal content of the two clusters is presented in Sect. 4, we here compare the -ratios in NGC 6229 and M 5. In doing this comparison we shall adopt (in order to be fully consistent with Sandquist et al. 1996) their differential bolometric correction between the HB and the RGB, which turns out to be 0.265 mag for the filter. In this case, we have and the ratios: (), (). These ratios are fully consistent with those obtained by Sandquist et al. for M 5 (, – see their Table 7). From this comparison, it follows that there is no significant difference in or between the two clusters, and that the difference in between them is unlikely to be higher than .
The consistency of the -ratios derived above would not exclude, however, phenomena such as helium mixing amongst NGC 6229 red giants, which as pointed out by Sweigart (1997) would not affect – to a first approximation – the number ratios.
3.3 Blue straggler stars
None of the previous photometric investigations of NGC 6229 (Cohen 1986; Carney et al. 1991; BCSS97) addressed the BSS in the cluster. Fusi Pecci et al. (1992), on the basis of Figure 3 in Carney et al (1991), discussed 13 BSS candidates and accordingly put NGC 6229 in their group “BS3”, alongside M 3 (NGC 5272). (For a much more detailed discussion of the special BSS population in the latter cluster, see Ferraro et al. 1997.)
In order to identify possible BSS candidates in NGC 6229, we followed the guidelines from Fusi Pecci et al. (1992, 1993). Accordingly, we checked the status of all stars forming an extension of the MS up to about 1.5 mag brighter than the TO point in , and also the stars located mag redder than the TO. This yielded the thirty-three possible BSS plotted in Figures 5 and 6. All these stars were measured in both the Rozhen and CA datasets. Careful checks were made to ensure that the internal errors of the BSS candidates are the same as those of the subgiants at the same level. The DAOPHOT parameters SHARP and CHI were checked for each BSS candidate, in order to ensure that most are unlikely to be the result of spurious photometric blends (e.g., Ferraro et al. 1992). Follow-up observations are needed to confirm their evolutionary status though.
| No. | Distance () | ||||
|---|---|---|---|---|---|
| 1 | 624.90 | 75.997 | 20.27 | 0.42 | 0.53 |
| 2 | 355.73 | 322.37 | 20.79 | 0.34 | 0.64 |
| 3 | 388.20 | 101.47 | 20.45 | 0.42 | 0.66 |
| 4 | 498.71 | 176.58 | 20.67 | 0.43 | 0.71 |
| 5 | 384.89 | 132.75 | 20.56 | 0.52 | 0.75 |
| 6 | 516.62 | 192.28 | 20.41 | 0.44 | 0.77 |
| 7 | 95.32 | 291.92 | 20.02 | 0.49 | 0.77 |
| 8 | 510.12 | 207.09 | 20.58 | 0.45 | 0.83 |
| 9 | 583.30 | 211.97 | 20.64 | 0.41 | 0.89 |
| 10 | 283.93 | 351.55 | 20.08 | 0.46 | 0.90 |
| 11 | 498.31 | 224.24 | 20.72 | 0.38 | 0.90 |
| 12 | 609.89 | 206.05 | 20.30 | 0.51 | 0.91 |
| 13 | 322.69 | 122.20 | 20.74 | 0.46 | 0.93 |
| 14 | 482.62 | 233.90 | 20.58 | 0.41 | 0.95 |
| 15 | 428.56 | 224.84 | 20.73 | 0.47 | 0.97 |
| c659 | 276.73 | 389.97 | 20.40 | 0.44 | 0.88 |
| c420 | 752.60 | 66.27 | 20.74 | 0.44 | 1.00 |
| c412 | 421.42 | 245.32 | 20.53 | 0.46 | 1.11 |
| c378 | 239.43 | 196.50 | 20.28 | 0.44 | 1.39 |
| c481 | 834.96 | 131.28 | 20.71 | 0.46 | 1.41 |
| c416 | 266.20 | 244.98 | 20.66 | 0.51 | 1.43 |
| c376 | 202.99 | 362.55 | 20.08 | 0.27 | 1.43 |
| c460 | 882.81 | 49.51 | 20.51 | 0.10 | 1.52 |
| c429 | 225.37 | 299.61 | 20.43 | 0.49 | 1.71 |
| c436 | 93.29 | 156.11 | 20.39 | 0.54 | 1.86 |
| c478 | 79.88 | 257.66 | 20.54 | 0.17 | 2.08 |
| c356 | 1088.71 | 99.30 | 20.34 | 0.31 | 2.39 |
| c329 | 675.01 | 204.75 | 20.10 | 0.24 | 1.10 |
| c358 | 452.31 | 20.65 | 0.48 | 0.66 | |
| c425 | 601.18 | 20.55 | 0.32 | 0.81 | |
| c499 | 454.45 | 312.57 | 20.67 | 0.09 | 0.74 |
| c327 | 345.06 | 241.18 | 20.24 | 0.35 | 1.38 |
| c426 | 283.54 | 336.03 | 20.58 | 0.40 | 0.95 |
According to the Galaxy model of Ratnatunga & Bahcall (1985), the predicted number of field stars in our fields [2 stars at and mag] is not sufficient to explain this population.
Data for the BSS candidates in NGC 6229 – magnitudes, colours and distance from the cluster center – are listed in Table 5. Their and coordinates are in the CA coordinate system. Eighteen of these candidates are found in the Carney et al. (1991) photometry list, although only seven (labeled c425, c359, c426, c358, c460, c376 and c478 in Table 5) were selected by Fusi Pecci et al. (1992, 1993). We were unable to identify their remaining candidates, possibly due to the large errors reported by Carney et al. (1991). Our BSS candidates are shown in Figures 5 and 6.
The implied “specific frequency” of BSS in NGC 6229 (at ) is
| (2) |
This should be compared with the overall frequencies recently obtained with HST for a series of GCs: for M 13 (NGC 6205); for M 3; and for M 80 (NGC 6093) (Ferraro et al. 1999b). This would suggest a similar specific frequency of BSS between NGC 6229 and M13. Note that both M 13 and NGC 6229 are not dynamically evolved (e.g., Trager et al. 1995), as opposed to what is likely to be the case for M 80 – whose core is indeed trying to collapse and stellar interactions may be preventing this from happening. The extremely large specific frequency of BSS in M 80 is likely to be due to this effect (Ferraro et al. 1999b).

We mention, however, several caveats in comparing the above HST values with our ground-based value for NGC 6229 (see also Ferraro et al. 1995). In particular, the samples employed to obtain the NGC 6229 and the HST specific frequencies are:
a) Heterogeneous in sampling: the HST surveys are obtained in the very central region of each cluster, whereas the NGC 6229 value has been derived for its external region ();
b) Heterogeneous in photometric filters and accuracy: the BSS samples in HST surveys are based on ultraviolet filters which are much more efficient than and (as used here) for obtaining complete BSS samples;
c) Heterogeneous in defining the “lower edge” of the BSS sample: due to the different filter systems, it is unclear whether the (somewhat arbitrary) lower edges coincide in the HST ultraviolet and ground-based studies, possibly introducing an important systematic bias.
We thus caution that the above comparison among HST values and NGC 6229’s might be substantially modified once high-accuracy HST data in the ultraviolet are available for NGC 6229.
Systematic differences in the radial distribution of BSS with respect to SGB stars spanning the same magnitude range have been detected in many GCs (I. Ferraro et al. 1995). The radial distribution of the 33 BSS listed in Table 5 was compared with the one for 97 SGB stars lying within mag in from the cluster fiducial line over the magnitude range . The cumulative radial distributions for both samples are plotted in Figure 7 as a function of the projected distance from the cluster center (). It is evident from this plot that the candidate BSS (solid line) are more centrally concentrated than the SGB stars (dashed line). A Kolmogorov-Smirnov test applied to the two distributions shows that the possible BSS population in NGC 6229 is more centrally concentrated than the SGB population in the same magnitude interval with confidence.
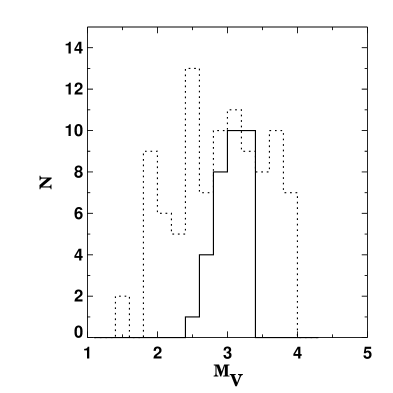
Figure 8 presents the NGC 6229 BSS luminosity function (LF). This LF seems consistent with the total LF presented by Fusi Pecci et al. (1992, 1993) for 625 BSS in 25 GCs, displaying a peak at mag. It is not possible to tell, on the basis of our data alone, whether NGC 6229’s BSS LF is fully compatible with the “global” LF for GCs with , which appears to differ from the one for GCs of lower central density (cf. Figure VIII in Fusi Pecci et al. 1993). For comparison purposes, we display in Figure 8 the overall LF for BSS in a set of seven GCs with from Fusi Pecci et al. (1993) (dashed line), after removing NGC 6229 and M 3 from their sample. For NGC 6229, . Note that, for consistency, the distance modulus [ mag and mag] and metallicity scales adopted when producing Figure 8 were the same as in Fusi Pecci et al. (1993).
Since NGC 6229 is a crowded, mildly concentrated outer-halo GC, HST imaging will definitely be necessary in order for a likely centrally concentrated BSS population to be positively identified in its innermost regions.
3.4 Extreme HB stars
The putative extreme HB (EHB) population suggested by BCSS97 could not be unquestionably identified in the present study, although we found strong hints that it may indeed be present. The implications of the presence (or otherwise) of an EHB population in NGC 6229 have been discussed at length by BCSS97 and Catelan et al. (1998).
There are nine stars (marked by filled squares in Figures 5 and 6) reaching as faint as mag, and having mag, which resemble an EHB extension to the long blue HB tail of NGC 6229. Magnitudes, colours and distances from the cluster center for these stars are listed in Table 6. Unfortunately, most of these stars are identified only on the CA dataset in the high crowding region and have relatively large photometric errors. Two of them, however (No. 5 and c397 in Table 6), were also measured in the Rozhen dataset, their photometric parameters being in very good agreement between the two datasets. We identify star No. 397 in the Carney et al. (1991) photometry list as an EHB candidate. Accurate photometry extending to even fainter magnitudes is necessary to confirm their nature. In particular, in order to identify a possible prominent EHB population in NGC 6229 (see BCSS97), HST photometry reaching the very crowded cluster core will be required. We recall that the conspicuous EHB population in the core of NGC 2808, a much closer GC ( kpc, compared to kpc for NGC 6229 – data from Harris 1996), was only discovered using HST (Sosin et al. 1997), notwithstanding the fact that deep ground-based CCD photometry had already been published for the outer regions of NGC 2808 (Ferraro et al. 1990).
| No. | Distance () | ||||
|---|---|---|---|---|---|
| 1 | 562.545 | 86.141 | 20.642 | 0.382 | |
| 2 | 458.270 | 100.294 | 20.535 | 0.459 | |
| 3 | 389.157 | 59.478 | 21.192 | 0.572 | |
| 4 | 458.255 | 141.58 | 20.803 | 0.611 | |
| 5 | 322.760 | 304.384 | 20.490 | 0.880 | |
| 6 | 621.255 | 179.482 | 21.462 | 0.839 | |
| 7 | 473.597 | 223.595 | 21.485 | 0.919 | |
| 8 | 279.580 | 344.230 | 21.471 | 0.951 | |
| c397 | 675.420 | 309.552 | 20.441 | 2.077 |
4 Metallicity
We can derive a photometric estimate of the cluster metallicity from the absolute location in colour of the RGB and from its overall morphology. Many observational photometric indicators have been proposed and calibrated for this purpose. In the following we will use:
, defined by Sandage & Smith (1966) as the RGB dereddened colour at the HB luminosity level;
, defined by Sandage & Wallerstein (1960) as the magnitude of the RGB at mag with respect to the HB level. Similar parameters and , measured at mag and mag, respectively, have been recently defined by Sarajedini & Layden (1997);
, defined by Sarajedini & Layden (1997) as the RGB colour at mag;
, defined by Hartwick (1968) as the slope of the RGB measured between two points along the RGB: the first at and the second at ;
, the location of the RGB “bump” in the CMD relative to the HB level. A recalibration of this indicator as a function of cluster metallicity has been recently provided by Sarajedini & Forrester (1995), expanding on the dataset used in the original calibration (Fusi Pecci et al. 1990).
In order to measure these parameters for NGC 6229, we first need to adopt values for the interstellar reddening, distance modulus and . For consistency with the values used in the previous sections (except for Sect. 3.2), we will adopt: mag, mag and mag (Harris 1996). From these values, the mean ridgeline listed in Table 4, and the location of the RGB “bump” from BCSS97, we derive: mag, mag, mag, mag, mag, , and mag.
An additional estimate of the cluster metallicity can be derived by the so-called “simultaneous reddening and metallicity (SRM) method” (Sarajedini 1994; Sarajedini & Layden 1997). This method was created to derive the reddening and metallicity of a GC simultaneously from its RGB and HB photometric properties.
From each of these observables we can obtain an independent photometric estimate of the cluster metallicity by using the corresponding calibration in terms of reported in the literature. Most of the available calibrations are based on the Zinn & West (1984, hereafter ZW84) metallicity scale, although some recent papers (Carretta & Bragaglia 1998; Ferraro et al. 1999a) have presented recalibrations in terms of the new scale by Carretta & Gratton (1997, hereafter CG97), based on direct high-resolution spectroscopy for RGB stars in a set of 24 GCs.
Results based on each available metallicity indicator on the two metallicity scales are summarized in Table 7.
We note that the reddening obtained from the SRM method based on the Sarajedini & Layden (1997) calibration, mag, is fully consistent with the values commonly found in the literature (e.g., Harris 1996).
On the Zinn & West (1984) scale, the weighted mean photometrically-inferred NGC 6229 metallicity is:
| (3) |
Instead, on the Carretta & Gratton (1997) scale the NGC 6229 metallicity is:
| (4) |
Note that the quoted uncertainties in the metallicity estimates provided in Table 7 are derived only from the formal propagation of the errors in the photometric indicators. However, in the final values we assume a conservative global error of 0.1 dex.
It is important to note that a substantially lower metallicity () than provided in the CG97 scale (eq. 4) has recently been obtained for NGC 6229 from direct medium-resolution spectroscopy of bright cluster giants (Wachter et al. 1998).
However, particular care is required in comparing different metallicty scales, since most of them are found not to be mutually consistent. Carretta & Gratton (1998) noted that in the Wachter et al. (1998) scale Galactic GCs turn out to be systematically more metal poor with respect to the CG97 scale. In fact, considering two clusters (namely, M 13 and NGC 7006) examined with both the Wachter et al. and CG97 techniques, they found:
Taking into account this offset, the metallicity found by Wachter et al. (1998) for NGC 6229 translates into a value
in the CG97 scale, which is fully compatible with the photometric estimate we found above (see eq. 4). Note that Pilachowski et al. (1983) derived from echelle spectroscopy of a red giant (IV-12) in NGC 6229; in their scale, however, 47 Tuc (NGC 104) had a surprisingly low metallicity (), thus indicating that the “true” NGC 6229 metallicity should be higher than implied by the ZW84 scale.
Since the CMDs of NGC 6229 and M 5 agree remarkably well at the level of the RGB, the two clusters must have essentially identical (photometric) metallicities. This conclusion does not depend upon (possible) deep mixing effects among NGC 6229’s and/or M 5’s giants, since mixing affects only marginally the RGB locus and shape (Sweigart 1997).
Thus we can conclude that both spectroscopic and photometric measurements suggest that M 5’s (and thus NGC 6229’s) metallicity is indeed quite high: (see also Sneden et al. 1992).222It is interesting to note that, according to the latest isochrones computed by VandenBerg (1998), it is not possible to fit M5’s CMD unless (even including the observed enhancement in the -elements; Sneden et al. 1992), thus favoring the ZW84 scale. On the other hand, assuming the “global metallicity” [M/H] and adopting the latest models by Chieffi et al. (1998), Ferraro et al. (1999a) have been able to remove the disagreement between theory and observations in regard to the location of the RGB luminosity function “bump” (e.g., Fusi Pecci et al. 1990) in a sample of 47 Galactic GCs – favoring instead the CG97 scale. Possible explanations for the discrepancy between theory and observations, as far as the “bump” location goes, have been summarized by Catelan & de Freitas Pacheco (1996; see their Sect. 5).
| Parameter | [Fe/H] | Reference |
| Zinn & West (1984) metallicity scale | ||
| Zinn & West (1984) | ||
| Gratton (1987) | ||
| Costar & Smith (1988) | ||
| Gratton & Ortolani (1989) | ||
| Sarajedini & Layden (1997) | ||
| Weighted mean | ||
| Zinn & West (1984) | ||
| Costar & Smith (1988) | ||
| Gratton & Ortolani (1989) | ||
| Weighted mean | ||
| Sarajedini & Layden (1997) | ||
| Sarajedini & Layden (1997) | ||
| Sarajedini & Layden (1997) | ||
| Gratton & Ortolani (1989) | ||
| Sarajedini & Forrester (1997) | ||
| “SRM method” | Sarajedini & Layden (1997) | |
| Carretta & Gratton (1997) metallicity scale | ||
| Carretta & Bragaglia (1998) | ||
| Carretta & Bragaglia (1998) | ||
| Carretta & Bragaglia (1998) | ||
5 Age determination
As already stated, our photometric material allowed us to obtain, for the first time, a CMD for NGC 6229 reaching below the cluster TO point and suitable for an age determination. In Figure 4, the cluster CMD obtained from the CA dataset is displayed together with the M 5 ridgeline from Sandquist et al. (1996). Note that a comparison between the outer-halo GC NGC 6229 and M 5 appears especially interesting in light of the discovery that M 5’s orbital parameters imply that it too is an outer-halo GC, which just happens to be currently close to its perigalacticon (Cudworth 1997 and references therein).
Comparing the NGC 6229 CMD with the one for M 5, we reach the following conclusions.
Assuming that M 5 and NGC 6229 have the same metallicity (see Sect. 4) and using the remarkable fit of the M 5 ridgeline to the NGC 6229 CMD in the SGB-TO region (see Figure 4), it immediately follows that M 5 and NGC 6229 have very similar ages (VandenBerg et al. 1990). A similar conclusion follows from a comparison with the NGC 1851 ridgeline (Walker 1992; see also Figure 7 in Walker 1998). Figure 4 shows, however, that the match between the HBs is not very good at the red end of the blue HB, which appears brighter in NGC 6229 than in M 5. The red-HB loci agree quite well, though. (A comparison between the RR Lyrae properties is deferred to Paper IV in our series.) This is similar to what has been claimed by Stetson et al. (1996) for the bimodal-HB cluster NGC 1851. BCSS97 had already hinted that the red end of the blue HB of NGC 6229 might be brighter than the red HB of the cluster (see also Figure 6). Figure 9a shows a more detailed comparison between the NGC 6229 and M 5 CMDs around the TO and HB regions. That the blue HB of NGC 6229 is brighter than M 5’s is quite evident in this plot. The same is not true when a comparison is made between NGC 6229 and NGC 1851, however (Figure 9b). This may shed light on the nature of the second-parameter effect (Stetson et al. 1996; Catelan et al. 1998; Sweigart 1999; Sweigart & Catelan 1998; Walker 1998).


To confirm quantitatively that NGC 6229 and M 5 are essentially coeval, we have applied both “vertical” and “horizontal” methods for determining relative ages from the magnitude difference between the HB and the TO and the color difference between the RGB and the TO. In order to overcome the problems related to the calibration and use of absolute quantities, we have applied these age parameters in a strictly differential sense by referring NGC 6229 to our reference GC M 5, following the approach of Buonanno et al. (1993) and I. Ferraro et al. (1995).
On the basis of the VandenBerg & Bell (1985) models, Buonanno et al. (1993) obtained the following “vertical” relation between the differential age parameter and the age in Gyr:
where subscript “1” stands for NGC 6229, and “2” for M 5. Assuming for both GCs and using the value of derived in Sect. 3.1 for NGC 6229, we obtained: mag, implying and thus
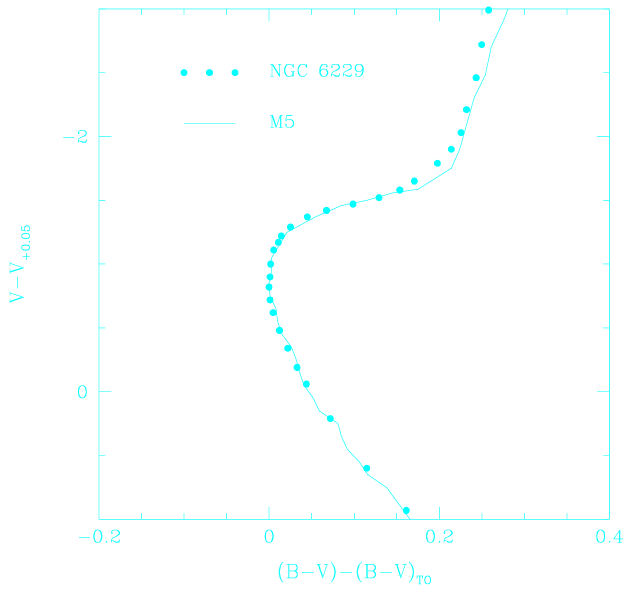
The “horizontal” method has been applied following the procedure described by VandenBerg et al. (1990). In Figure 10 we compare the M 5 and NGC 6229 fiducial lines after registering them as recommended by VandenBerg et al. According to that paper the colour difference is computed at the point along the RGB where mag. Here is the MS magnitude at which is 0.05 mag redder than the TO. From Figure 10 we derive a value of for the differential age parameter , defined by Buonanno et al. (1993). Using the calibration of given by VandenBerg & Stetson (1991), namely,
we obtain an age difference between NGC 6229 and M 5 of
A new age parameter has been recently defined by Buonanno et al. (1998): , which is the magnitude difference between the HB and the point on the upper MS, where is 0.05 mag redder than the TO (see Figure 1 in Buonanno et al.). For M 5 and NGC 6229, we find that: mag and mag, respectively. This implies an age difference
between these two GCs.
In summary, all the employed methods agree within the errors that NGC 6229 and M 5 are essentially coeval.333In the present paper, we have chosen not to employ the recently-proposed relative-age indicator from Chaboyer et al. (1996a), which relies on the region of the CMD which is brighter than the TO and redder by 0.05 mag in . We find that this region is particularly subject to spurious photometric blends (Sect. 3.1), and thus – unlike what is claimed by Chaboyer et al. – is subject to potentially large observational errors.
The weighted mean age difference between NGC 6229 and M 5 from the three determinations is:
| (5) |
For a comparison of the age of M 5 with those of other GCs of comparable metallicity, we refer the reader to VandenBerg et al. (1990) and VandenBerg (1999b).
6 Summary and concluding remarks
In the present paper we have presented the first deep CMD for the outer-halo globular cluster NGC 6229 from data obtained at the Calar Alto and Rozhen observatories. The combined CMD reaches mag below the main-sequence turnoff of the cluster.
Our detailed analysis of the CMD properties reveals that:
1. The perfect alignment of the upper RGBs in NGC 6229 and M 5 suggests that they must have the same metallicity. This is confirmed by our photometric estimate of NGC 6229’s metallicity ( dex), which fully agrees with the spectroscopic measurements obtained by CG97 and Sneden et al. (1992) for M 5 ( dex, dex).
Our photometric estimate of the NGC 6229 metallicity has been indirectly confirmed by the recent spectroscopic measurements carried out by Wachter et al. (1998), who found dex. Once the offset between the Wachter et al. and CG97 metallicity scales found for GCs in common between the two studies is properly taken into account (Carretta & Gratton 1998), this corresponds to dex;
2. The CMD of NGC 6229 is entirely compatible with the one for M 5 (Sandquist et al. 1996), implying that the two clusters have nearly identical ages. Indeed, a quantitative measurement of the age difference between the two GCs using three different methods shows them to have the same ages to within Gyr. However, the HB morphologies of the two clusters do differ in detail, NGC 6229’s extending to bluer colours than M 5’s (with a likely extreme HB population present) and showing a “dip” in the number counts at the RR Lyrae level (see the Appendix in Catelan et al. 1998 for a discussion);
3. Thirty-three candidate blue straggler stars have been identified;
4. Nine possible extreme HB stars have been detected. If confirmed, this will be the first known case of an outer-halo GC with an extreme HB population. Associated with this population, we find a hint of a (second) “gap” at the faint end of the blue HB. NGC 6229 is the only known outer-halo globular with HB gap(s) and a bimodal HB (BCSS97; Catelan et al. 1998);
5. Confirmation of the BSS and EHB populations, as well as a detailed analysis of the radial population gradients discussed by BCSS97 and in Sect. 5.2, must await deep HST photometry of the crowded central regions of this remote and quite concentrated globular cluster.
Acknowledgements.
The authors are grateful to E. Carretta, R. Gratton, F. Grundahl, D. A. VandenBerg and the referee, B. Carney, for very helpful remarks. This research was supported in part by the Bulgarian National Science Foundation grant under contract No. F-604/1996 with the Bulgarian Ministry of Education and Sciences. Support for M.C. was provided by NASA through Hubble Fellowship grant HF–01105.01–98A awarded by the Space Telescope Science Institute, which is operated by the Association of Universities for Research in Astronomy, Inc., for NASA under contract NAS 5-26555.References
- (1) Bolte M., 1990, JRASC 84, 137
- (2) Borissova J., Catelan M., Spassova N., Sweigart A. V., 1997, AJ 113, 692 (BCSS97)
- (3) Buonanno R., Buscema G., Corsi C. E., Ferraro I., Iannicola G., 1983, A&A 126, 278
- (4) Buonanno R., Corsi C. E., Fusi Pecci F., 1985, A&A 145, 97
- (5) Buonanno R., Corsi C. E., Fusi Pecci F., Richer H. B., Fahlman G. G., 1993, AJ 105, 184
- (6) Buonanno R., Corsi C. E., Pulone L., Fusi Pecci F., Bellazzini M., 1998, A&A 333, 505
- (7) Buzzoni A., Fusi Pecci F., Buonanno R., Corsi C. E., 1983, A&A 128, 94
- (8) Carney B., Fullton L., Trammell S., 1991, AJ 101, 1699
- (9) Carretta E., Bragaglia A., 1998, A&A 329, 937
- (10) Carretta E., Gratton R., 1997, A&AS 121, 95 (CG97)
- (11) Carretta E., Gratton R., 1998, private communication
- (12) Catelan M., 1999, in preparation
- (13) Catelan M., Borissova J., Sweigart A. V., Spassova, N., 1998, ApJ 494, 265
- (14) Catelan M., de Freitas Pacheco J. A., 1996, PASP 108, 166
- (15) Chaboyer B., Demarque P., Kernan P. J., Krauss L. M., Sarajedini A., 1996a, MNRAS 283, 683
- (16) Chaboyer B., Demarque P., Sarajedini A., 1996b, ApJ 459, 558
- (17) Chieffi A., Limongi M., Straniero O., 1998, in preparation
- (18) Christian C., Adams M., Barnes J. V. Hayes, D. S., Siegel M., Butcher H., Mould J. R., 1985, PASP 97, 363
- (19) Cohen J. G., 1986, AJ 90, 2254
- (20) Costar D., Smith H. A., 1988, AJ, 96, 1925
- (21) Cudworth K. M., 1997, in Proper Motions and Galactic Astronomy, ASP Conf. Ser. Vol. 127, ed. R. M. Humphreys, ASP, San Francisco, 91
- (22) Ferraro F. R., Clementini, G., Fusi Pecci, F., Buonanno, R., Alcaino, G. 1990, A&AS 84, 59
- (23) Ferraro F. R., Fusi Pecci F., Buonanno R. 1992, MNRAS 256, 376
- (24) Ferraro F. R., Fusi Pecci F., Bellazzini M., 1995, A&A 294, 80
- (25) Ferraro F. R., Messineo M., Fusi Pecci F., De Palo M. A., Straniero O., Chieffi A., 1999a, AJ, submitted
- (26) Ferraro F. R., Paltrinieri B., Fusi Pecci F., et al., 1997, A&A 324, 915
- (27) Ferraro F. R., Paltrinieri B., Fusi Pecci F., Rood R. T., Dorman B., 1998, ApJ 500, 311
- (28) Ferraro F. R., Paltrinieri B., Rood R. T., Dorman B., 1999b, ApJ (Letters), submitted
- (29) Ferraro F. R., Paresce F., 1993, AJ 106, 154
- (30) Ferraro I., Ferraro F. R., Fusi Pecci F., Corsi C. E., Buonanno R., 1995, MNRAS 275, 1057
- (31) Fusi Pecci F., Ferraro F. R., Cacciari C., 1993, in Blue Stragglers, ASP Conf. Ser. Vol. 53, ed. R. E. Saffer, ASP, San Francisco, 97
- (32) Fusi Pecci F., Ferraro F. R., Corsi C. E., Cacciari C., Buonanno R., 1992, AJ 104, 1831
- (33) Fusi Pecci F., Ferraro F. R., Crocker D. A., Rood R. T., Buonanno R., 1990, A&A 238, 95
- (34) Gratton R. G., 1987, A&A 179, 181
- (35) Gratton R. G., Ortolani S., 1989, A&A 211, 41
- (36) Harris W. E., 1996, AJ 112, 1487
- (37) Harris W. E., et al., 1997, AJ 114, 1043
- (38) Hartwick F. D. A., 1968, ApJ 154, 475
- (39) Iben I., Jr., 1968, Nature 220, 143
- (40) Pilachowski C. A., Bothun G. D., Olszewski E. W., Odell A., 1983, ApJ 273, 187
- (41) Ratnatunga K., Bahcall J., 1985, ApJS 58, 63
- (42) Rood R. T., Crocker D. A., Fusi Pecci F., Ferraro F. R., Clementini G., Buonanno R., 1993, in The Globular Cluster-Galaxy Connection, ASP Conf. Ser. Vol. 48, eds. G. H. Smith & J. P. Brodie, ASP, San Francisco, 218
- (43) Sandage A. R., Wallerstein G., 1960, ApJ 131, 598
- (44) Sandage A. R., Smith L. L., 1966, ApJ 144, 886
- (45) Sandquist E. L., Bolte M., Stetson P. B., Hesser J. E., 1996, ApJ 470, 910
- (46) Sarajedini A., 1994, AJ 107, 618
- (47) Sarajedini A., 1997, AJ, 113, 682
- (48) Sarajedini A., Forrester W. L., 1995, AJ 109, 1112
- (49) Sarajedini A., Layden A., 1997, AJ 113, 264
- (50) Sneden C., Kraft R. P., Prosser C. F., Langer G. E., 1992, AJ 104, 2121
- (51) Sosin C., et al., 1997, ApJ 480, L35
- (52) Stetson P. B., 1991a, in The Formation and Evolution of Star Clusters, ASP Conf. Ser. Vol. 13, ed. K. A. Janes, ASP, San Francisco, 88
- (53) Stetson P. B., 1991b, in Precision Photometry: Astrophysics of the Galaxy, eds. A. G. D. Philip, A. R. Upgren, & K. A. Janes, L. Davis Press, Schenectady, 69
- (54) Stetson P. B., 1993, User’s Manual for DAOPHOT II
- (55) Stetson P. B., et al., 1999, AJ, in press (astro-ph/9809176)
- (56) Stetson P. B., Harris W. E., 1988, AJ 96, 909
- (57) Sweigart A. V., 1997, ApJ 474, L23
- (58) Sweigart A. V., 1999, in The Third Conference on Faint Blue Stars, eds. A. G. D. Philip, J. Liebert, & R. A. Saffer, Cambridge University Press, Cambridge, 3
- (59) Sweigart A. V., Catelan M., 1998, ApJ 501, L63
- (60) Trager S. C., King I. R., Djorgovski S., 1995, AJ 109, 218
- (61) VandenBerg D. A., 1998, private communication
- (62) VandenBerg D. A., 1999a, in The Third Stromlo Symposium: The Galactic Halo, ASP Conf. Ser., eds. B. K. Gibson, T. S. Axelrod, & M. E. Putman, ASP, San Francisco, in press
- (63) VandenBerg D. A., 1999b, in preparation
- (64) VandenBerg D. A., Bell R. A., 1985, ApJS 58, 561
- (65) VandenBerg D. A., Bolte M., Stetson P. B., 1990, AJ 100, 445
- (66) VandenBerg D. A., Stetson P. B., 1991, AJ 102, 1043
- (67) Wachter S., Wallerstein G., Brown J. A., Oke J. B., 1998, PASP 110, 821
- (68) Walker A. R., 1992, PASP 104, 1063
- (69) Walker A. R., 1998, AJ 116, 220
- (70) Zinn R., West M., 1984, ApJ 55, 45 (ZW84)