High-resolution UKIRT observations of circumnuclear star formation in M100
Abstract
We present high-resolution, near-infrared imaging of the circumnuclear region of the barred spiral galaxy M100 (=NGC 4321), accompanied by near-infrared spectroscopy. We identify a total of 43 distinct regions in the -band image, and determine magnitudes and colours for 41 of them. By comparison with other near-infrared maps we also derive colour excesses and -band extinctions for the knots. Combining the imaging and spectroscopic results, we conclude that the knots are the result of bursts of star formation within the last 15–25 Myr. We discuss the implications of these new results for our dynamical and evolutionary understanding of this galaxy.
keywords:
galaxies: evolution – galaxies: individual (M100, NGC 4321) – galaxies: kinematics and dynamics – galaxies: structure – infrared: galaxies.1 Introduction
The circumnuclear regions (CNRs) of barred spiral galaxies, with or without an active galactic nucleus, often show significant star forming activity, frequently organized into ring-like structures (e.g., Morgan 1958; Sérsic & Pastoriza 1967; Pogge 1989a, b; Buta & Combes 1996). The massive star formation (SF) is usually observed by imaging in the H emission line, and is understood to occur as a result of orbit crowding and gas accumulation between a pair of dynamical Inner Lindblad Resonances (ILRs) in the disc. Although the SF in the circumnuclear ‘rings’ can be explained by gravitational instabilities there (Elmegreen 1994), spiral structure is almost always present, either in the SF itself (e.g., M100: Pogge 1989a; Cepa & Beckman 1990; Knapen et al. 1995a, hereafter Paper I), or in dust lanes associated with the CNR (e.g., NGC 5248: Laine et al. 1998), indicating that the SF is organized, e.g., by density waves. Near-infrared (NIR) imaging of CNRs gives important clues on the distribution of obscuring dust (Paper I), and can also be used to derive the distribution of stellar mass, which in turn is used as input for dynamical modelling (e.g., Quillen, Frogel & Gonzalez 1994; Wada, Sakamoto & Minezaki 1998; García-Burillo et al. 1998). The NIR light distribution is not used as input to models by e.g., Knapen et al. (1995b; hereafter Paper II), Wada et al. (1998), and Yuan & Kuo (1998), but these authors do compare the output of their models with the observed NIR morphology. In Paper II, we estimated the value of the -band mass-to-luminosity ratio () in the CNR of M100, concluding that is not constant, and is strongly affected by SF. Wada et al. (1998) subsequently confirmed this from a comparison of their two models.
The main interpretational issue in this respect is what fraction of the NIR emission traces the stellar mass distribution, and what fraction is from dynamically young stars? In Paper II this issue was discussed qualitatively in detail, concluding that in the CNR of M100 the latter fraction was significant. Whereas the light is distributed smoothly as compared to blue light or H in M100 (cf. e.g. NGC 4303: Elmegreen et al. 1997), Knapen et al. (1995b) drew attention to two -band ‘hot spots’, named K1 and K2, which were identified as starburst regions at the loci where a pair of trailing and leading shocks interact in the vicinity of the inner ILR. Wozniak et al. (1998) subsequently showed that at 6.75 and 15 m, K1 and K2 emit similarly, as expected in such a scenario. Knapen et al. also reported the detection of ‘leading arms’ in , in the inner bar region, predicted theoretically.
In this paper, we quantitatively confirm previous suspicions concerning the stellar populations in the CNR of M100, based on an analysis of high-resolution NIR imaging of the CNR, and of NIR spectroscopy of K1, K2, and the nucleus. After describing the observations (Sect. 2) and results (Sect. 3), we discuss the ages of the compact knots discovered from the NIR imaging, and the stellar populations within them. In Sect. 4, we also discuss how the new results fit in with previous work on the CNRs in M100 and other galaxies. We conclude briefly in Sect. 5.
2 Observations
2.1 High-resolution imaging
The nuclear region of M100 was imaged with IRCAM3 on the upgraded 3.8-m United Kingdom Infrared Telescope (UKIRT) and a (warm) magnifier, which yielded a pixel scale of arcsec and a 36 arcsec square field of view. Images in , , and were obtained on the night of 1998 February 14 UT; bracketing observations of PSF stars yielded seeing FWHM of 0.34 arcsec at and 0.39 arcsec at . For each filter, a mosaic of overlapping frames spaced 4 arcsec apart was obtained on M100, together with a matching mosaic on the sky 10 arcmin away. The integration time per frame was 60 sec. After alignment, the frames in each mosaic were combined, excluding known bad pixels, and the sky mosaics were used to flatfield the object mosaics. Owing to their small field coverage, the image mosaics had to be flux calibrated using aperture photometry from the literature (Devereux 1989; Recillas-Cruz et al. 1991).
2.2 Near-infrared spectroscopy
Longslit and band spectra were obtained separately on the night of 1998 February 12 UT using CGS4 on UKIRT. A slit width of 1.2 arcsec was used with the 40 line mm-1 grating in first order, yielding resolving powers (after smoothing) at and of 285 and 360, respectively. The slit position angle was set to , allowing us to capture both the -band hotspots K1 and K2 identified in Paper I, as well as the nucleus in the same observation. Since the infrared-emitting central region of M100 fills a sizable fraction of the 90 arcsec slit length, sky spectra were taken with the object positioned well off the slit, rather than simply displaced along the slit. Total on-source integration times were 1920 sec and 2400 sec at and , respectively. Observations of the A4 V star BS 4632 and the F0 V star BS 4531 were used to divide out atmospheric absorption features in the M100 spectra, after first having their own Brackett and Paschen lines removed. Preliminary image processing (subtraction of object–sky pairs and flatfielding) was performed using the on-line reduction software cgs4dr, while object extraction, wavelength calibration, and division by the standard were done with iraf111IRAF is distributed by the National Optical Astronomy Observatories, which are operated by the Association of Universities for Research in Astronomy, Inc., under cooperative agreement with the National Science Foundation..
3 Results
3.1 Photometry
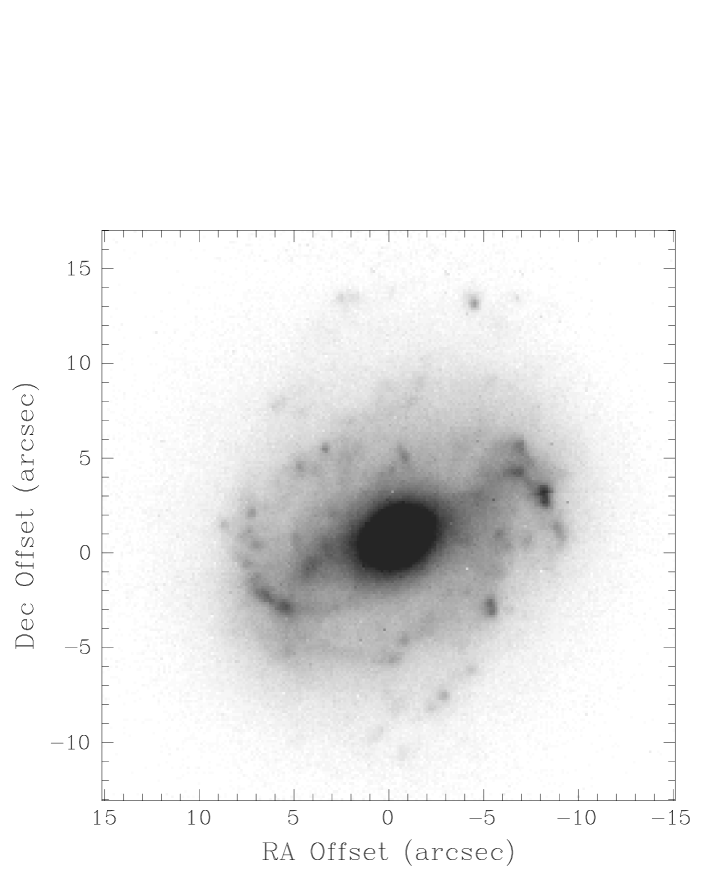
Figure 1 shows the reduced -band image. A total of 43 compact ‘knots’ were identified by a comparison of this image with an unsharp-masked version (cf. Mighell & Rich 1995). The improvement in delivered image quality as a result of the UKIRT Upgrades Program (which includes active control of the primary mirror figure and telescope focus, a tip-tilt Fast Guider, and dome ventilation louvres; Hawarden et al. 1998) can be clearly seen by comparing this image with the pre-upgrade UKIRT image of Paper I (their fig. 2). What were previously just broad maxima in the -band light have now been resolved into a host of individual regions. For example, both the maxima K1 and K2 identified in Paper I at 0.8 arcsec resolution turn out to consist of 3 or 4 sub-clumps at 0.4 arcsec resolution. The detection of leading arms within the SF ‘ring’ (Paper I) is confirmed on the new images.
Photometry of each of these knots in all 3 bands was performed using the ccdcap digital circular aperture photometry code developed by Mighell to analyze HST WF/PC and WFPC2 observations (Mighell 1997, and references therein). The local (sky + unresolved bulge light) background was determined from a robust estimate of the mean intensity value of all pixels between 15 and 20 pixels of the aperture centre. To minimise the effects of crowding, magnitudes were determined by summing the flux within a radius of 5 pixels (0.7 arcsec), then corrected to an aperture radius of 15 pixels based on similar measurements of the PSF stars. The positions, -magnitudes, and NIR colours (uncorrected for reddening), colour excesses and inferred -band extinctions (see below) for the 41 knots that could be reliably measured are tabulated in Table 1.
As is readily apparent from a comparison of Fig. 1 with fig. 4 of Paper I, many of these knots could be severely reddened by their proximity to the dust lanes. We have made a first-order correction for this in the following way. Using the isochrone synthesis models of Bruzual & Charlot (1993), we find that from an initial colour of 1.48 at 20 Myr, a given population will become bluer by mag at 1 Gyr, then finish up redder by about the same amount after 10 Gyr. We have therefore used the map from Paper I in order to calculate the colour excess (relative to 1.48) of the unresolved stellar background around each of the knots, together with the interstellar extinction curve of Rieke & Lebofsky (1985), to derive appropriate corrections for reddening and extinction at the location of each of the knots, as given in Table 1.
The distribution of knot NIR colours, after correcting for reddening as above, is shown in Fig. 2. The bulk of the knots cluster around a point slightly bluer than the mean colours for an old stellar population, i.e., 0.71–0.76 in , and 0.25–0.30 in (Griersmith, Hyland & Jones 1982). Some of the knots are redder in and bluer in than can be accounted for by their photometric errors, or by any amount of internal reddening, warm dust, or scattered light (see, e.g., Israel et al. 1998). These are all diffuse, outlying regions. The three bluest knots (33, 34, and 42 in Table 1) are all located along the inner edge of the southwest dust lane.
The -band Luminosity Function (LF), corrected for extinction using the values in Table 1, is presented in Fig. 3. A distance to M100 of 16.1 Mpc (Ferrarese et al. 1996) has been assumed. The LF peaks at , and has a steep bright-end cutoff compared with the faint-end tail. We have overlaid on Fig. 3 the characteristic LF for extragalactic globular cluster systems, a Gaussian having and (Harris 1991). It is possible to fit the peak and the faint-end, provided (which would require the stellar content to be totally dominated by dwarfs or giants of type M6 or later), but there is then a clear deficiency of bright objects if, indeed, these knots are globular clusters.
3.2 Spectroscopy
Continuum fitting and equivalent width measurements were carried out using the splot task in iraf. The results are given in Table 2. The 1- measurement errors are nm for the emission lines. In the case where no line feature was apparent at the expected (redshifted by 1571 ) wavelength, the nearest positive peak was measured and used as an upper limit. For the CO measurements, we have used the wavelength range W2 of Puxley, Doyon & Ward (1997; hereafter PDW), equivalent to that used by Kleinmann & Hall (1986) and by Origlia, Moorwood & Oliva (1993). In the last column of Table 2, we give the spectroscopic CO index (COsp) as defined by Doyon, Joseph & Wright (1994; hereafter DJW). The use of a broader wavelength window here is important, since our resolution is at least a factor of 2 poorer than results published elsewhere. K1 and K2 have quite similar CO line strengths, and both are stronger than the nucleus.
The values observed ( nm) are similar to those in M83 (PDW), and galaxies in general (Oliva et al. 1995). We note in passing that according to the diagnostic diagram of Moorwood & Oliva (1988), the ratios of H2 1–0 S(1) to Br, together with the upper limits on [Fe ii], would tend to suggest that the nucleus of M100 has some Seyfert 2 activity, while K1 and K2 would be classed as ‘Composite’-like (i.e., their optical spectra would have indications of Seyfert and H ii activity). However, we feel that many of the line detections are too marginal for the ratios to have much meaning.
4 Discussion
4.1 Old stellar clusters or recent massive star formation?
Having resolved these compact, NIR emission knots, we now attempt to draw some inferences about their nature. In particular, are these knots globular clusters, dominated by an old stellar population? Or are they much more recent, perhaps formed in a single burst, or triggered sequentially by some dynamical process?
On the basis of the photometry alone, we might be tempted to conclude that these knots are a few Gyr old. They are only slightly bluer than the characteristic colours of an old stellar population. The -band LF can be approximated by the Gaussian globular cluster LF, aside from a deficiency of bright objects. It is the addition of the spectroscopy, however, that provides the decisive argument in favour of these knots being the result of recent star formation. The mere presence of Br in emission, coupled with the deep CO absorption features attributable to young supergiants, argues strongly that (at least for the knots associated with K1 and K2), massive star formation has taken place within the last 100 Myr or so.
We can use our knowledge of the colours, together with the starburst models of Leitherer & Heckman (1995; hereafter LH95) to place some constraints on the ages of these knots. To begin with, we have tracked the time evolution of and in the LH95 models for an instantaneous burst, and for continuous star formation, using solar metallicity, a Salpeter-type IMF, and a mass range of 1–100 M⊙. The end-points of these two models after 300 Myr of evolution are shown as the large diamond and cross, respectively, in Fig. 2. It can clearly be seen that the knot colours on the whole are more consistent with a recent burst of star formation, than with either continuous or ancient star formation. However, as Satyapal et al. (1997) point out, extinction-corrected colours alone do not provide good constraints on stellar population models.
A more precise determination of the age of the burst requires spectroscopic information, which is only available for the regions K1 and K2 (and in fact, the narrow slit encompasses knots 29 and 19 only). These two regions have quite similar colours, emission line equivalent widths, and CO spectroscopic indices. Their similarity at mid-IR wavelengths has been noted by Wozniak et al. (1998), and indeed, the main difference between them seems to be the degree of obscuration by dust (Paper II). Using Br equivalent widths only, the instantaneous burst models of LH95 imply an age of 8-13 Myr for these two regions. Even with a steeper (Miller-Scalo type) IMF, the LH95 models with continuous star formation require Myr for the Br emission to drop this low.
Devost & Origlia (1998) have combined the LH95 models with equivalent width calculations, isochrones, and evolutionary tracks from the literature to forecast the time evolution of the CO (6–3) 1.62 m and CO (2–0) 2.29 m equivalent widths. Using their fig. 1, we derive ages of either 5 or 15 Myr, though the weakness of Br in emission makes the latter more likely. The DJW models predict the time evolution of both Br and CO, and by plotting COsp versus Br line strengths in Fig. 4 (adapted from fig. 3 of PDW), we find that both K1 and K2 lie close to the locus traced by a starburst evolutionary model having an exponential decay time-scale of 5 Myr. The ages of K1 and K2 implied by these models are between 15 and 25 Myr. In Paper I, Knapen et al. reached similar conclusions regarding the ages of the knots K1 and K2 on the basis of colours and the models of Charlot & Bruzual (1991).
From modelling and observations, we know that the CNR hosts two small-scale but relatively strong density wave spiral arms (Paper II; Knapen 1996; Knapen et al., in preparation). Starbursts can occur in the spiral armlets, induced by the concentration and compression of abundant gaseous material by the density wave amplified by the gas self-gravity, and show up first as H ii regions, and after Myr, start emitting strongly in (LH95; Knapen 1996). The distribution of SF regions in the CNR is compatible with and fully explained by the interaction of disk gas with the non-axisymmetric (barred) potential in M100 (Paper II). Our results also confirm that the individual knots of SF in the core of M100 have been created in short 15–25 Myr bursts by the global density wave pattern.
4.2 Stellar populations in the knots
The mean de-reddened colours of the 41 measurable knots (, ) are consistent with the stellar population being dominated by giants of type K3-4, or M0 supergiants [dwarf stars being too blue in ]. Similarly, the COsp values for K1 and K2 in Table 2 are also typical of M0 supergiants, or of M4 giants (again, dwarfs do not have COsp this high; DJW). As Oliva et al. (1995) and PDW have shown, even the use of CO spectral features at 1.59, 1.62, and 2.29 m is still not sufficient to distinguish giants from supergiants. The LH95 and DJW models both predict the supergiant production rate to peak at Myr after the onset of the burst, so a supergiant-dominated population is perhaps more likely for this reason. In any case, we note that a single knot with would require up to 25000 K4 giants, or as few as just 70 M0 supergiants, to account for the observed luminosity. Emission lines are not expected to contribute much to the knot luminosities, as a 15 Myr old cluster will have a main sequence turn-off near spectral type B0 (Whitmore & Schweizer 1995), and such stars can no longer ionise the gas around them.
A difference in the stellar populations of the knots relative to the unresolved nuclear light also has implications for the dynamical analyses. Our results confirm the variations in over the CNR in M100 derived in Paper II and quantified by the dynamical modelling of Wada et al. (1998).
By comparing the -band luminosities of the LH95 models 20 Myr after a burst with Fig. 3, we estimate that between 0.1 and M⊙ of gas went into forming each of these knots, and that the total mass of gas involved in forming these knots was M⊙. Since most of these knots have been resolved by our observations ( pixels), we are able to deconvolve the images, and derive physical sizes for the knots of between 30 and 70 pc.
Finally, we note that these circumnuclear knots in M100 are somewhat different from the class of ‘super star clusters’ identified in HST images of nearby starburst galaxies (e.g., O’Connell, Gallagher & Hunter 1994; Meurer et al. 1995), and which have been postulated to be the progenitors of globular clusters. The knots are not only larger in size, but also much redder than the ‘super star clusters’, even though both types of object are thought to be Myr old. Since the nucleus of M100 is not currently undergoing an intense starburst, these differences could reflect the different types of environment in which they formed.
5 Conclusions
Recent improvements in the delivered image quality at UKIRT have allowed us to resolve a number of compact circumnuclear ‘knots’ in M100. NIR colours and luminosities, corrected for extinction, are consistent with a recent burst (or bursts) of massive star formation as the origin of these knots, but the possibility of an older population of objects (e.g., globular clusters) cannot be ruled out using this data alone. The addition of NIR spectroscopy for two of these knots either side of the nucleus provides conclusive evidence of recent star formation. By comparing Br and CO 2.29 m line equivalent widths to various starburst models in the literature, we infer ages for these knots of between 15 and 25 Myr, and a stellar population most likely dominated by M0 supergiants. Future NIR spectroscopy for the remainder of the knots should enable us to generalize this conclusion and refine our interpretation of the formation and evolution of the SF regions in the presence of the small-scale spiral density wave.
Acknowledgments
We are grateful to Tom Geballe and Sandy Leggett for generously making time available on UKIRT for this project, to Ken Mighell for offering us the use of his software, and to René Doyon for allowing us to make use of the models and figure from the PDW paper. We are indebted to Isaac Shlosman, Tim Hawarden, and the referee for constructive criticism on an earlier version of the manuscript.
References
- [1] Bruzual A. G., Charlot S., 1993, ApJ, 405, 538
- [2] Buta R. J., Combes F., 1996, Fund. Cosmic Phys., 17, 95
- [3] Cepa J., Beckman J. E., 1990, A&AS, 83, 211
- [4] Charlot S., Bruzual A. G., 1991, ApJ, 367, 126
- [5] Devereux N. A., 1989, ApJ, 346, 126
- [6] Devost D., Origlia L., 1998, in Friedli D., Edmunds M., Robert C., Drissen L., eds, ASP Conf. Ser. Vol. 147, Abundance Profiles: Diagnostic Tools for Galaxy History. Astron. Soc. Pac., San Francisco, p. 201
- [7] Doyon R., Joseph R. D., Wright G. S., 1994, ApJ, 421, 101 (DJW)
- [8] Elmegreen B. G., 1994, ApJ, 425, L73
- [9] Elmegreen D. M., Chromey F. R., Santos M., Marshall D. 1997, AJ, 114, 1850
- [10] Ferrarese L., et al., 1996, ApJ, 464, 568
- [11] García-Burillo S., Sempere M. J., Combes F., Neri R., 1998, A&A, 333, 864
- [12] Griersmith D., Hyland A. R., Jones T. J., 1982, AJ, 87, 1106
- [13] Harris W. E., 1991, ARA&A, 29, 543
- [14] Hawarden T. G., et al., 1998, SPIE, in press
- [15] Israel F. P., van der Werf P. P., Hawarden T. G., Aspin C., 1998, A&A, 336, 433
- [16] Kleinmann S. G., Hall D. N. B., 1986, ApJS, 62, 501
- [17] Knapen J. H., 1996, in Sandqvist A., Lindblad P. O., eds, Nobel Symposium 98: Barred Galaxies and Circumnuclear Activity. Springer, New York, p. 233
- [18] Knapen J. H., Beckman J. E., Heller C. H., Shlosman I., de Jong R. S., 1995b, ApJ, 454, 623 (Paper II)
- [19] Knapen J. H., Beckman J. E., Shlosman I., Peletier R. F., Heller C. H., de Jong R. S., 1995a, ApJ, 443, L73 (Paper I)
- [20] Laine S., Knapen J. H., Pérez-Ramírez D., Doyon R., Nadeau D., 1998, MNRAS, submitted
- [21] Leitherer C., Heckman T. M., 1995, ApJS, 96, 9
- [22] Meurer G., Heckman T., Leitherer C., Kinney A., Robert C., Garnett D., 1995, AJ, 110, 2665
- [23] Mighell K. J., 1997, AJ, 114, 1458
- [24] Mighell K. J., Rich R. M., 1995, AJ, 110, 1649
- [25] Moorwood A. F. M., Oliva E., 1988, A&A, 203, 278
- [26] Morgan W. W., 1958, PASP, 70, 364
- [27] O’Connell R., Gallagher J., Hunter D., 1994, ApJ, 433, 65
- [28] Oliva E., Origlia L., Kotilainen J. K., Moorwood A F M., 1995, A&A, 301, 55
- [29] Origlia L., Moorwood A. F. M., Oliva E., 1993, A&A, 280, 536
- [30] Pogge R. W., 1989a, ApJS, 71, 433
- [31] Pogge R. W., 1989b, ApJ, 345, 730
- [32] Puxley P. J., Doyon R., Ward M. J., 1997, ApJ, 476, 120 (PDW)
- [33] Quillen A. C., Frogel J. A., Gonzalez R. A., 1994, ApJ, 437, 162
- [34] Recillas-Cruz E., Carrasco L., Serrano A., Cruz-González I., 1991, A&A, 249, 312
- [35] Rieke G. H., Lebofsky M. J., 1985, ApJ, 288, 618
- [36] Satyapal S., Watson D. M., Pipher J. L., Forrest W. J., Greenhouse M. A., Smith H. A., Fischer J., Woodward C. E., 1997, ApJ, 483, 148
- [37] Sérsic J. L., Pastoriza M., 1967, PASP, 79, 152
- [38] Wada K., Sakamoto K., Minezaki T., 1998, ApJ, 494, 236
- [39] Whitmore B. C., Schweizer F., 1995, AJ, 109, 960
- [40] Wozniak H., Friedli D., Martinet L., Pfenniger D., 1998, A&A, 330, L5
- [41] Yuan C., Kuo C.-L., 1998, ApJ 497, 689
| No. | |||||||
| (arcsec)a | (arcsec)a | ||||||
| 1 | -6.3 | 12.6 | 18.47 (0.10) | 2.16 (0.95) | -0.07 (0.19) | 1.18 | 0.35 |
| 2 | -4.1 | 12.3 | 16.13 (0.03) | 1.43 (0.12) | 0.50 (0.07) | 1.39 | 0.42 |
| 3 | 0.3 | 12.9 | 19.32 (0.22) | 1.98 (0.90) | -0.79 (0.34) | 0.30 | 0.09 |
| 4 | 2.8 | 12.6 | 16.85 (0.05) | 0.97 (0.11) | 0.07 (0.09) | 0.66 | 0.20 |
| 5 | 6.2 | 7.0 | 16.95 (0.08) | 0.75 (0.16) | 0.15 (0.15) | 0.57 | 0.17 |
| 6 | 5.0 | 6.6 | 17.40 (0.14) | 1.85 (1.03) | 0.78 (0.36) | 0.55 | 0.17 |
| 7 | -1.2 | 8.0 | 17.16 (0.14) | 0.37 (0.24) | 0.22 (0.28) | 0.03 | 0.01 |
| 8 | -0.7 | 7.1 | 17.22 (0.16) | 0.25 (0.33) | 0.45 (0.36) | 0.03 | 0.01 |
| 9 | 2.4 | 6.0 | 18.62 (0.80) | 1.08 (2.38) | 0.36 (1.75) | 0.71 | 0.21 |
| 10 | 3.8 | 4.6 | 16.63 (0.10) | 0.56 (0.19) | 0.24 (0.20) | 0.36 | 0.11 |
| 11 | 5.1 | 3.6 | 16.26 (0.08) | 1.36 (0.35) | 0.87 (0.21) | 1.15 | 0.35 |
| 12 | 4.2 | 3.5 | 16.98 (0.16) | 0.50 (0.26) | 0.21 (0.30) | 0.53 | 0.16 |
| 13 | 7.6 | 1.3 | 16.34 (0.09) | 0.63 (0.15) | 0.23 (0.17) | 0.30 | 0.09 |
| 14 | 9.2 | 0.7 | 16.88 (0.12) | 0.92 (0.23) | 0.26 (0.23) | 0.57 | 0.17 |
| 15 | 8.2 | 0.2 | 16.09 (0.07) | 0.60 (0.13) | 0.30 (0.14) | 0.42 | 0.13 |
| 16 | 7.4 | -0.4 | 16.31 (0.10) | 0.71 (0.19) | 0.33 (0.20) | 0.43 | 0.13 |
| 17 | 7.8 | -1.4 | 16.29 (0.09) | 0.64 (0.15) | 0.17 (0.17) | 0.38 | 0.11 |
| 18 | 7.5 | -2.2 | 15.88 (0.07) | 0.66 (0.12) | 0.28 (0.13) | 0.34 | 0.10 |
| 19 | 6.8 | -3.2 | 15.47 (0.05) | 0.70 (0.10) | 0.38 (0.10) | 0.25 | 0.08 |
| 20 | 5.9 | -3.7 | 15.31 (0.04) | 1.15 (0.13) | 0.59 (0.09) | 0.79 | 0.24 |
| 21 | 5.8 | -6.0 | 16.00 (0.06) | 0.77 (0.13) | 0.32 (0.12) | 0.67 | 0.20 |
| 22b | 5.4 | 0.0 | 0.81 | 0.24 | |||
| 23 | 4.5 | -1.5 | 15.66 (0.06) | 0.89 (0.12) | 0.26 (0.11) | 0.90 | 0.27 |
| 24 | 3.8 | -0.5 | 15.48 (0.05) | 0.74 (0.11) | 0.21 (0.10) | 0.41 | 0.12 |
| 25 | 3.3 | 1.2 | 17.19 (0.31) | 1.72 (1.39) | 0.17 (0.60) | 0.42 | 0.13 |
| 26 | -0.4 | 4.0 | 16.23 (0.09) | 0.64 (0.16) | 0.09 (0.17) | 0.16 | 0.03 |
| 27 | -4.3 | 2.1 | 16.24 (0.10) | 1.15 (0.28) | 0.35 (0.20) | 0.74 | 0.22 |
| 28 | -6.5 | 4.6 | 15.39 (0.04) | 0.66 (0.08) | 0.22 (0.08) | 0.40 | 0.12 |
| 29 | -6.4 | 3.4 | 15.14 (0.03) | 0.74 (0.07) | 0.29 (0.06) | 0.37 | 0.11 |
| 30 | -7.8 | 2.4 | 14.87 (0.03) | 0.87 (0.07) | 0.40 (0.06) | 0.66 | 0.20 |
| 31 | -8.5 | 0.5 | 15.65 (0.05) | 0.79 (0.11) | 0.31 (0.10) | 0.32 | 0.10 |
| 32b | -6.8 | -0.1 | 0.88 | 0.26 | |||
| 33 | -5.8 | -0.6 | 18.43 (0.88) | 0.42 (0.66) | -0.47 (1.23) | 0.40 | 0.12 |
| 34 | -5.4 | 0.2 | 17.95 (0.54) | 0.25 (0.33) | -0.69 (0.73) | 0.31 | 0.09 |
| 35 | -5.0 | -3.7 | 15.47 (0.04) | 0.77 (0.11) | 0.32 (0.09) | 0.34 | 0.10 |
| 36 | -0.4 | -5.4 | 17.00 (0.15) | 0.66 (0.28) | 0.16 (0.28) | 0.28 | 0.08 |
| 37 | 0.3 | -6.4 | 16.33 (0.08) | 0.53 (0.14) | 0.23 (0.15) | 0.20 | 0.06 |
| 38 | -3.8 | -7.0 | 17.42 (0.17) | 0.68 (0.53) | 0.60 (0.41) | 0.38 | 0.11 |
| 39 | -2.5 | -8.4 | 16.52 (0.07) | 0.64 (0.15) | 0.24 (0.14) | 0.01 | 0.00 |
| 40 | -1.7 | -9.1 | 17.08 (0.10) | 0.68 (0.27) | 0.43 (0.22) | 0.36 | 0.13 |
| 41 | 0.1 | -9.1 | 18.25 (0.33) | 0.65 (0.72) | 0.23 (0.65) | 0.25 | 0.08 |
| 42 | 1.0 | -10.2 | 18.29 (0.26) | 0.19 (0.25) | -0.39 (0.40) | 0.00 | 0.00 |
| 43 | -0.3 | -11.5 | 17.62 (0.09) | 1.76 (0.42) | 0.10 (0.18) | 0.82 | 0.25 |
aOffset relative to -band nuclear position.
bInsufficient signal-to-noise for centering and photometry.
| Region | –EW([Fe ii]) | –EW(H2 1–0 S(1)) | –EW(Br) | –EW(H2 2–1 S(1)) | EW(CO 2–0) | COsp |
|---|---|---|---|---|---|---|
| (nm) | (nm) | (nm) | (nm) | (nm) | ||
| Nucleus | 0.3 | 0.88 | ||||
| K1 | 0.3 | 0.4 | 1.01 | |||
| K2 | 0.2 | 0.3 | 0.1 | 0.93 |