The ROSAT Deep Survey
Abstract
An unusual double-lobed extended X-ray source (RX J105343+5735) is detected in the ROSAT ultra-deep HRI image of the Lockman Hole. The angular size of the source is arcmin2 and its X-ray flux is erg cm-2 s-1. R-band imaging from the Keck telescope revealed a marginal excess of galaxies brighter than R=24.5, but Keck LRIS spectroscopy of 24 objects around the X-ray centroid did not yield a significant number of concordant redshifts. The brightest galaxy close to the centre of the eastern emission peak appears to be a gravitationally lensed arc at z=2.570, suggesting that the X-ray object is associated with the lens, most likely a cluster of galaxies. Based on a comparison of lensing surface mass density, X-ray luminosity, morphology and galaxy magnitudes with clusters of known distance, we argue that RX J105343+5735 is a cluster at a redshift around 1. Future X-ray, ground-based optical/NIR and high resolution HST observations of the system will be able to clarify the nature of the object.
Key words: Galaxies: intergalactic medium; Cosmology: dark matter, gravitational lensing; X-rays: galaxies
1 Introduction
X-ray surveys efficiently select cosmic X-ray sources at distances ranging from our immediate neighbourhood to the edge of the observable universe. By studying their properties as a function of redshift we can probe the formation and the evolution of structures in the universe. Surveys at the faintest X-ray fluxes (e.g. Hasinger et al. 1998, hereafter paper I) predominantly find active galactic nuclei (Schmidt et al. 1998, hereafter paper II) often in conjunction with starburst regions, which might also be responsible for the absorption observed in the sources of the X-ray background (Fabian et al. 1998).
Clusters of galaxies are the second most abundant class of objects in deep X-ray surveys. They are the largest bound structures in the universe, composed of dark matter condensations, hot X-ray emitting gas and galaxies. X-ray radiation is an efficient means to select clusters of galaxies, because the X-ray flux is proportional to the square of the electron density. The highest observed redshifts of X-ray selected clusters to date are 0.8-0.9 (Henry et al., 1997; Rosati et al., 1998) and extended X-ray emission of clusters selected by other techniques has been reported out to z=1.27 (Stanford et al., 1997; Hattori et al., 1997).
In this letter we report on the discovery of a faint double-lobed X-ray source, RX J105343+5735, detected in the ROSAT ultra-deep HRI image of the Lockman Hole (paper I). In section 2 and 3 we present the X-ray and optical observations, and in section 4 we discuss the properties of the object in the context of what we know about other galaxy clusters. We use a Hubble constant and a deceleration parameter throughout this paper.
2 X-ray observations
The ROSAT Deep Survey (RDS) project is described in paper I. The RDS consists of a series of deep pointings of 207 ksec with the ROSAT PSPC and 1.31 Msec with the ROSAT HRI in the direction of the “Lockman Hole”, a line of sight with exceptionally low HI column density. A catalogue of 50 X-ray sources with fluxes brighter than has been published in paper I; the spectroscopic optical identifications are presented in paper II. The ultra-deep HRI pointing covers a solid angle of inside the RDS.
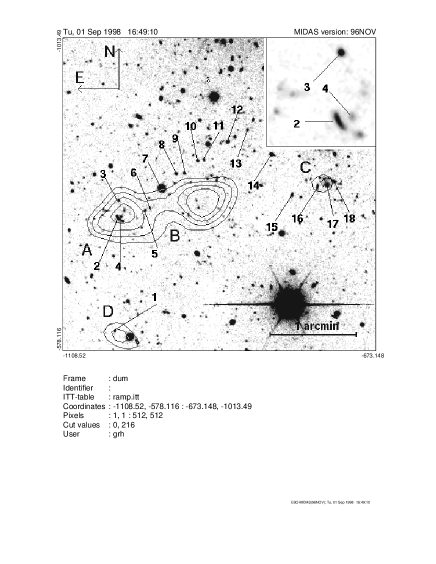
In the north-east quadrant of the HRI image (see paper I) is RX J105343+5735, a clearly extended X-ray source with a double-lobed structure. In Fig.1 we show X-ray contours of this source and its surroundings, superposed on an optical image. The extension of the source is about 1.7 and 0.6 arcmin in the E-W and N-S direction, respectively. We denote the Eastern lobe (A) and the Western lobe (B); both components are significantly extended. Two more X-ray sources are detected at a significance of : a possible group of galaxies at z=0.7 (C) and a QSO at z=2.572 (D). Details for the detected X-ray sources are given in Table 1. None of them appears in the previously published source list, because either their off-axis angle is too large (A, B) or their X-ray flux too low (C, D) for the selection criteria applied in paper I.
| Source | RA (2000) | DEC (2000) | Fluxa | Type |
|---|---|---|---|---|
| A+B | 10h53m43.4s | 57d35m21s | 2 | cluster |
| A | 10h53m46.6s | 57d35m17s | ||
| B | 10h53m40.1s | 57d35m25s | ||
| C | 10h53m29.5s | 57d35m38s | 0.18 | group |
| D | 10h53m48.2s | 57d33m55s | 0.17 | QSO |
The extended source is detected in the PSPC pointing at an off-axis angle of and therefore is not well resolved. With about 590 net photons detected in the PSPC a coarse spectrum could be obtained. We fixed the NH value to , consistent with the independent determination of NH from a fit to the summed spectrum of all resolved sources in the Lockman Hole (Hasinger et al. 1993). Using a Raymond-Smith model with solar abundances (Z=1) we obtain acceptable fits (see in Table 3) to the data assuming various redshifts for the source. The results are not significantly different for Z=0.3. The flux observed in the 0.5-2.0 keV band is for all these fits. The derived temperatures range between 1.8 and 3.5 keV, the luminosities (0.5-2 keV) between and for redshifts between 0.3 and 1.2 (see Table 3).
3 Optical observations
An R-band image of the field of RX J105343+5735 was obtained on 1996 April 13 with the Low Resolution Imaging Spectrometer (LRIS; Oke et al. 1995) on the KeckI telescope. The exposure time was 300s and the seeing (FWHM) was 0.75”. The image scale on the back-illuminated Tektronix CCD is . The CCD image was de-biased and flatfielded in the standard fashion using IRAF routines. A flatfield was generated by performing a median of 8 different R images, all of which lacked bright stars and were taken over the course of the night. We were able to flatten the resultant images to better than . Detection and photometric analysis of the galaxies and stars present in the program field was done using the SExtractor package (Bertin and Arnouts 1996). The faintest detections () have .
Fig. 1 shows a section of the LRIS image underlying the HRI X-ray contours of the field. Close to the centroid of lobe A is an arc-like feature (#2). It has a length of along the major axis and is not resolved along the minor axis. The arc has an integrated magnitude of R=21.4, a maximum surface brightness of mag arcsec-2 and some asymmetry along the major axis. There is diffuse emission around it with a surface brightness of mag arcsec-2 as well as some faint galaxies.
Spectra of 24 objects in this field were acquired with a multislit mask using LRIS on KeckII on 1998 March 19. The conditions were photometric, the seeing was and the exposure time 3600s. The slits were all 1.4” wide and some of them tilted to maximize the number of galaxies observed. The 300 line/mm grating produced spectra in the range 3800 to 8200 Å with a resolution of Å. Spectra were processed using standard MIDAS procedures for bias subtraction, flat-field correction, optimal extraction and wavelength calibration. Relative flux correction and atmospheric absorption correction was done using the spectrophotometric standard BD +26 2606.
Table 2 gives details about the observed galaxies using the numbering scheme given in Fig. 1 (#19-24 are outside the area covered by Fig. 1): coordinates, R magnitudes, redshifts and absolute R magnitudes calculated using K-corrections for the LRIS R-filter computed assuming the spectral energy distribution for a giant elliptical galaxy for objects with and an assumed K-correction of 0 for the two high-redshift objects (#1 and #2). Apart from four concordant redshifts around 0.7 (#13,16,17,18), three of which are coincident with a discrete X-ray source (C in Fig. 1), possibly a group of galaxies, three galaxies at z=0.308 (#7,11,19), scattered throughout the image, and two galaxies at z=0.782 (#5,8), there is no obvious clustering of redshifts in this sample.
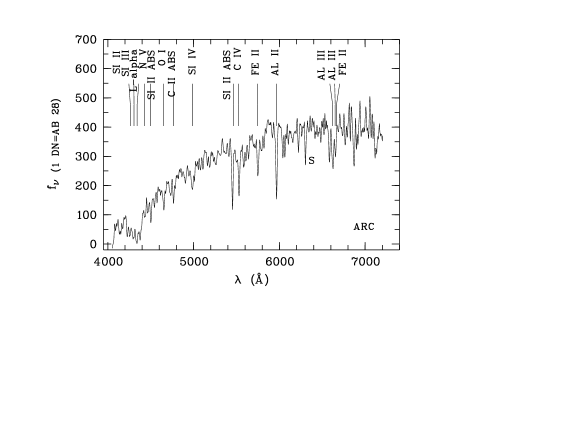
The spectrum of the brightest object (#2) close to the centroid of lobe A is displayed in Fig. 2. It shows prominent absorption features of Ly and low-ionization metal lines typical of the rest-frame UV emission of starburst galaxies which are characteristic of a young stellar population. The spectrum is very similar to those of the UV-dropout galaxies detected by Steidel et al. (1996), which gives us confidence in the redshift determination at . Its absolute magnitude () indicates significant magnification and its spectrum, apparent magnitude (R=21.4) and redshift (z=2.570) are all very similar to the gravitationally lensed galaxy at R=21.2, z=2.515 in the cluster A2218 (Ebbels et al, 1996), supporting the gravitational arc interpretation. Interestingly, the QSO (C) at z= is at a projected distance of only 0.6 Mpc from the arc galaxy.
| # | R.A. | Dec. | R | z | |
|---|---|---|---|---|---|
| 1 | 32 | -91 | 22.6 | 2.567 | -23.9 |
| 2 | 31 | -11 | 21.4 | 2.570 | -25.1 |
| 3 | 31 | 1 | 22.1 | 0.736 | -23.4 |
| 4 | 29 | -11 | 22.9 | ||
| 5 | 12 | -6 | 22.9 | 0.782 | -22.8 |
| 6 | 9 | -4 | 23.1 | 0.543: | -20.8 |
| 7 | 1 | 10 | 19.1 | 0.308 | -22.8 |
| 8 | -9 | 20 | 22.2 | 0.782 | -23.5 |
| 9 | -15 | 21 | 22.7 | 0.581 | -21.6 |
| 10 | -24 | 30 | 22.4 | 0.097 | -16.6 |
| 11 | -28 | 30 | 22.6 | 0.308 | -19.2 |
| 12 | -45 | 43 | 21.5 | 0.045 | -15.7 |
| 13 | -59 | 52 | 22.6 | 0.697 | -22.6 |
| 14 | -76 | 35 | 21.5 | 0.602: | -22.9 |
| 15 | -91 | 7 | 22.3 | 0.521 | -21.5 |
| 16 | -108 | 13 | 22.1 | 0.695 | -23.1 |
| 17 | -115 | 14 | 21.2 | 0.700 | -24.0 |
| 18 | -119 | 17 | 22.3 | 0.695 | -22.9 |
| 19 | -128 | 109 | 20.1 | 0.308 | -21.8 |
| 20 | -138 | 126 | 22.0 | 0.383 | -20.6 |
| 21 | -165 | 136 | 20.1 | 0.039: | -16.8 |
| 22 | -167 | 92 | 20.8 | 0.595 | -23.6 |
| 23 | -173 | 19 | 21.6 | 0.815: | -24.3 |
| 24 | -278 | 44 | 19.3 | 0.352 | -23.0 |
4 Discussion
The morphology, observed flux and lensing action of RX J105343+5735 strongly suggests that the X-ray source is associated with a moderately luminous, distant cluster of galaxies. To quantify a possible excess of the projected density of galaxies compared to the field objects, we use the estimator discussed by Lidman and Peterson (1996, eqn. 1) which gives a value for the cluster contrast, . Using the X-ray centroid as assumed cluster centre, we find a slight excess () of galaxies with R=23.5-24.5 for a 2’ diameter aperture. The group observed at z=0.7 (galaxies #16, 17 and 18) shows a significant excess () of brighter galaxies (). No obvious enhancement of galaxies is observed near the QSO (#1).
| Redshift | 0.3 | 0.7 | 1.2 | |
|---|---|---|---|---|
| 0.49 | 0.81 | 0.89 | ||
| 0.09 | 0.66 | 2.40 | ||
| 0.11 | 0.22 | 0.40 | ||
| 18.8 | 22.2 | 24.9 |
Since the redshift of the lens is unknown, we have produced a series of simple models for various values of the lens redshift (see Table 3). For all considered redshifts the object fits onto the empirical luminosity-temperature relation for clusters of galaxies (see e.g. Ebeling et al., 1996). We estimate that the lensed arc has a radius of curvature . We can estimate the lensing mass inside this radius by assuming the arc radius corresponds to the Einstein ring radius for a mass . Assuming different redshifts we obtain the lensing masses in Table 3. Note that this mass corresponds to the core mass of one lobe only. In Table 3 we also give an estimate of the expected R magnitude for the brightest cluster galaxy , assuming based on the compilation of Hoessel & Schneider (1985). We now discuss what would be the properties of the extended X-ray object for various assumed redshifts:
: Three galaxies (#7,11,19) at this redshift are found, including the 19th magnitude galaxy (#7) close to the symmetry axis. If the X-rays originate at this redshift, the X-ray luminosity would correspond to a group of galaxies. The observed double structure could be similar to some nearby groups, which can have complicated morphologies (Mulchaey et al. 1996). In this case, object #7 could be the brightest galaxy of the group, but no other galaxy of similar magnitude is seen around it. The detection of an arc is an argument against a group interpretation. The lensing surface mass density would be a factor of higher than that typically estimated for groups (Mulchaey et al., 1996).
: Four galaxies (#13,16,17,18) are detected at this redshift, but three of them are associated with source C, a very faint discrete X-ray source, possibly a group of galaxies ( erg/s). The X-ray luminosity would be consistent with a moderately rich cluster of galaxies. The elongated morphology is similar to other high-redshift clusters (Henry et al., 1997) and there is an interesting linear arrangement between A, B and C, which could indicate that all three mass condensations are in the same filamentary structure at z=0.7. But in this case A+B would have a factor of 10 higher X-ray luminosity than C, while C has clearly visible cluster galaxies in the right absolute magnitude range which are not seen in A+B. Therefore A+B would have to be a “dark” cluster without bright galaxies (Tucker et al., 1995). While this is an interesting possibility, we regard it as unlikely.
: In this case all the measured properties are consistent with a normal, moderately rich cluster at very high redshift. The object would be similar to the lensing cluster 2016+112 at z=1 (Schneider et al. 1986; Hattori et al. 1997). In this scenario the brightest cluster galaxies might just be visible in our R-band exposure (see Table 3) and we would not have a chance of detecting any cluster member within our spectroscopic limit of . The lensing surface mass density falls among those for other clusters of galaxies. In this case the object would be one of the highest redshift clusters with X-ray emission. Assuming no evolution for the Rosati et al. (1998) cluster luminosity function, we would expect 0.15 clusters in the redshift range z=1-1.5 in our survey volume. We regard this as the most likely possibility which can be easily tested with future observations. Upcoming deep surveys with AXAF and XMM should have no problem detecting and studying a number of similar objects at high redshift.
In conclusion, RX J105343+5735 is an intriguing object at any of the redshifts we can plausibly assign to the lens and well worth follow-up studies (e.g. NIR imaging, high-resolution imaging with HST, X-ray spectroscopy). In particular, it is the first detection of a gravitational arc which is optically brighter than any of the components of the lens. The detection of a QSO at the same redshift as the arc indicates that an enhanced density of background galaxies in this direction might have increased the likelihood to observe a lensed object.
-
Acknowledgements.
We thank an anonymous referee for helpful comments. The ROSAT project is supported by the Bundesministerium für Bildung, Forschung und Wissenschaft (BMBF), by the National Aeronautics and Space Administration (NASA), and the Science and Engineering Research Council (SERC). The W. M. Keck Observatory is operated as a scientific partnership between the California Institute of Technology, the University of California, and the National Aeronautics and Space Administration. It was made possible by the generous financial support of the W. M. Keck Foundation. This work was supported by DLR grant 50 OR 9403 5 (G.H., I.L.), National Science Foundation grant AST-95-09919 (D.P.S.) and ASI grant ARS-96-70 (G.Z.).
References
- 1 Bertin E. & Arnouts S. 1996, A&AS 117, 393
- 2 Ebbels T.M.D., Le Bourgne J.-F., Pello R., et al. 1996, MNRAS 281, L75
- 3 Ebeling H., Voges W., Böhringer H., et al. 1996, MNRAS 281, 799
- 4 Fabian A.C., Barcons X., Almaini O. & Iwasawa K. 1998, MNRAS 297, L11
- 5 Hattori M., Ikebe Y., Asaoka I., et al. 1997, Nat 388, 146
- 6 Hasinger G., Burg R., Giacconi R., et al. 1993, A&A 275, 1
- 7 Hasinger G., Burg R., Giacconi R., et al. 1998, A&A 329, 482 (paper I)
- 8 Henry J.P., Gioia I.M., Mullios C.R., et al. 1997, AJ 114, 1293
- 9 Hoessel J.G. & Schneider D.P. 1985, AJ 90, 1648
- 10 Lidman C.E. & Peterson B.A. 1996, AJ 112, 2454
- 11 Mulchaey J.S., Davis D.S., Mushotzky R.F., Burstein D. 1996, ApJ 456, 80
- 12 Oke J.B., Cohen J.G., Carr M., et al. 1995, PASP 107, 375
- 13 Rosati P., Della Ceca R., Norman C. & Giacconi R. 1998, ApJ 492, L21
- 14 Schneider D.P., Gunn J.E., Turner E.L., et al. 1986, AJ 91, 991
- 15 Schmidt M., Hasinger G., Gunn, J., et al. 1998, A&A, 329, 495 (paper II)
- 16 Stanford S.A., Elston R., Eisenhardt P.R. et al. 1997, AJ 114, 2232
- 17 Steidel C.C., Giavalisco M., Pettini M., Dickinson M. & Adelberger K. 1996, ApJ 462, L17
- 18 Tucker W.H., Tananbaum H. & Remillard R.A. 1995, ApJ 444, 532