The broad-band power spectra of X-ray binaries
Abstract
We analyzed the rapid aperiodic X-ray variability of different types of X-ray binaries (black hole candidates, atoll sources, the recently discovered millisecond X-ray pulsar, and Z sources) at their lowest inferred mass accretion rates. At these accretion rates, the power spectra of all sources are dominated by a strong band-limited noise component, which follows a power law with an index roughly 1 at high frequencies and breaks at a frequency between 0.02 and 32 Hz below which the spectrum is relatively flat. Superimposed on this, a broad bump (sometimes a quasi-periodic oscillation) is present with a 0.2–67 Hz centroid frequency that varies in good correlation with the frequency of the break. The black hole candidates and the low-luminosity neutron star systems (including the millisecond X-ray pulsar) have the same relation between the frequency of the bump and the frequency of the break. These similar characteristics strongly suggest that in all those different types of sources the band-limited noise and the bump are produced by the same physical mechanism. This mechanism cannot then depend on the presence or absence of either a small magnetosphere or a solid surface, so that it is most likely related to an instability in the flow in the accretion disk that modulates the accretion rate.
The Z sources, which are more luminous than the other sources discussed here, follow a similar, but slightly shifted correlation between the break frequency and the frequency of the bump. The data suggest that the band-limited noise in Z sources is more complex than that in the other sources.
keywords:
accretion, accretion disks — stars: neutron, black hole — X-rays: starsThe broad-band power spectra of X-ray binaries \slugcommentSubmitted to ApJ, Aug 1998
1 Introduction
At their lowest observed mass accretion rates () the low-luminosity neutron star low-mass X-ray binaries (LMXBs; these are usually atoll sources; Hasinger & van der Klis 1989) and the black hole candidates (BHCs) are remarkably similar with respect to their X-ray spectra (e.g. Barret & Vedrenne 1994; see, however, Heindl & Smith 1998) and their rapid aperiodic X-ray variability (e.g. van der Klis et al. 1994a, b; Berger & van der Klis 1998). So far, the only clear observable difference is the detection of quasi-periodic oscillations (QPOs) between 200 and 1200 Hz in the atoll sources (Strohmayer et al. 1996; see van der Klis 1998 for a review) and not in the BHCs (e.g. Remillard et al. 1998). Apart from these high frequency phenomena, the power spectra are (almost) indistinguishable. At their lowest observed the power spectra of both the atoll sources and the BHCs are dominated by a strong band-limited noise component, which follows a power law with index of roughly 1 at high frequencies and breaks at a certain frequency () below which the spectrum is relatively flat. Superimposed on this noise component, above , a broad bump is present. This broad bump is sometimes called a QPO although it usually does not satisfy the commonly used criterium (the ratio of the full width at half maximum and the centroid frequency is less than 0.5) to be called QPO. It was shown that the recently discovered (Wijnands & van der Klis 1998a,b) millisecond X-ray pulsar SAX J1808.4–3658 was indistinguishable with respect to the X-ray spectrum (Gilfanov et al. 1998; Heindl & Smith 1998) and the rapid aperiodic X-ray variability (Wijnands & van der Klis 1998c) from the atoll sources. It has been suggested that the same physical mechanism is responsible for the rapid aperiodic timing behavior in these different types of sources (van der Klis 1994a,b), and from the properties of the millisecond X-ray pulsar it was concluded that it most likely originated outside the magnetosphere (Wijnands & van der Klis 1998c).
Due to the large flow of data generated by the Rossi X-ray Timing Explorer (RXTE) satellite, detailed quantitative comparisons between atoll and BHC power spectra are only now becoming possible. In this Letter, we present a detailed analysis of the low-frequency power spectra of atoll sources, BHCs, and the millisecond X-ray pulsar. We show that is well correlated with the frequency of the bump for the three different source types, strongly indicating that indeed the same physical mechanism is responsible in these sources. We also show that the brightest neutron star LMXBs (the Z sources) at their lowest observed mass accretion rates have similar power spectra, however, they follow a somewhat different correlation.
2 Observations, analysis and results
We used data obtained with the proportional counter array (PCA) onboard RXTE to study the low-frequency power spectra of the different types of X-ray binaries. When a strong band-limited noise component was detected with superimposed on it a broad bump or a QPO (hereafter usually referred to as QPO), we fitted the 0.004–4096 Hz (or 0.004–2048 Hz when the time resolution was insufficient to go to 4096 Hz) power spectra. Before fitting the power spectra the dead-time modified Poisson level (Zhang 1995; Zhang et al. 1995) was subtracted. The fit function consisted of a broken power law (, where and are the power law index below and above , respectively) to represent the band-limited noise, and a Lorentzian with centroid frequency representing the QPO. In the case of Cyg X-1 and GX 339–4 we used a twice broken power law instead of a once broken power law to fit the band-limited noise adequately. The second break occurred at frequencies between 4.6 and 7.3 Hz, well above the frequency of the bump in those sources. Above this second break the spectrum steepened further with an index of typically 1.8. For some atoll sources we had to include an extra cut-off power law (), representing a noise component at frequencies above 100 Hz (see also Wijnands & van der Klis 1998c; Ford & van der Klis 1998). Sometimes kHz QPOs were also present, which were fitted with Lorentzians. Errors on the frequencies were determined using = 1.
In many of the power spectra, one or both of the desired components were not present. Usually these power spectra were obtained when the sources were in different source states compared to those where the strong band-limited noise and the QPO were detected. In these states QPOs are sometimes present, however, the band-limited noise usually is not. It turned out that the power spectra which were suitable for our purposes were usually, with a few exceptions (see Section 2.1), those taken during the lowest observed inferred mass accretion rates, i.e., during the low states of the BHCs, during times when the atoll sources were in their island states, and when the Z sources were at the leftmost end of their horizontal branches. Typical power spectra of the source types are shown in Fig. 1.
We also searched the literature for publications of similar power spectra as observed with RXTE or other X-ray (EXOSAT, Ginga) or -ray (CGRO/OSSE) satellites. When such power spectra were encountered we used the values for and as they are given in those publications. In Table 1 all sources which were found and their references are listed. Most sources we fitted ourselves with the fit function described above. All but two of the sources found in the literature were fitted using the same fit function we used; in GRO J0422+52 (Grove et al. 1998) and 1E 1724–3045 (Olive et al. 1998) the band-limited noise was fitted with a zero-centered Lorentzian and we estimated the break-frequency from the published power spectra. Several other sources (e.g. GRS 1737–31: Cui et al. 1997c) also showed the band-limited noise, however, no evidence for QPOs was found. The very complex sources Cir X-1 (neutron star system) and GRS 1915+105 (BHC) we left out of our analysis. Their complex nature, combined with the sometimes many QPOs, makes it difficult to correctly identify the QPOs and even the break frequency.
2.1 The sources
We have found eight BHCs (Table 1) which exhibited the band-limited noise and the QPO. We fitted RXTE/PCA data from the BHCs Cyg X-1, GX 339–4, XTE J1755–324, and GRO J1655–40 (see also Belloni et al. 1996, Cui et al. 1997a, 1997b, Revnivtsev et al. 1998, and Méndez et al. 1998 for more details about the data). From the literature we obtained the results of the BHCs XTE J1755–524 (Fox & Lewin 1998), 1E 1740.7–2942 (Smith et al. 1997), GRS 1758–258 (Smith et al. 1997), and GRO J0422+32 (Grove et al. 1998). Usually the BHCs were in the canonical black hole low state (GX 339–4; XTE J1755–324; GRO J0422+32; 1E 1740.7–2942; GRS 1758–258; Cyg X-1) but sometimes they may have been in one or two other previously described states (intermediate or very high; XTE J1748–288; GRO J1655–40; Cyg X-1; see Méndez & van der Klis 1997 for a recent description of BHC source states). For two sources (1E 1740.7–2942 and GRS 1758–258) a second harmonic to the QPO was detected and in GRO J1655–40 both a genuine QPO and a broad bump are present, not harmonically related (see Section 2.2).
We have found eight atoll sources (including the millisecond X-ray pulsar; Table 1) which exhibited both power spectral phenomena. Most of the data of these sources we fitted ourselves (see Méndez et al. 1997, Wijnands et al. 1998b, and Wijnands & van der Klis 1998c for more detailed description of the data), but we also used results published in the literature (4U 1728–34: Ford & van der Klis 1998; 4U 1608–52: Yoshida et al. 1993; 4U 1705–44: Berger & van der Klis 1998; Ford, van der Klis & Kaaret 1998; 1E 1724–3045: Olive et al. 1998). All but one of the sources were in the island state; 4U 1735–44 was in the lower banana branch (Wijnands et al. 1998b).
Of the Z sources we fitted data of Cyg X-2 (Wijnands et al. 1998a), GX 17+2 (Wijnands et al. 1997), GX 5–1 (Wijnands et al. 1998c), GX 340+0 (Jonker et al. 1998; see also Fig. 1d), and Sco X-1 (van der Klis et al. 1996, 1997) when they were at their lowest observed inferred mass accretion rate (thus at the leftmost end of their horizontal branches). The QPO in this case is the fundamental of the well-known horizontal branch oscillations or HBO. In these sources the second harmonic to the HBO could frequently also be detected. We excluded GX 349+2 from our analysis because so far this source has not exhibited HBO.
2.2 The QPO frequency versus the break frequency
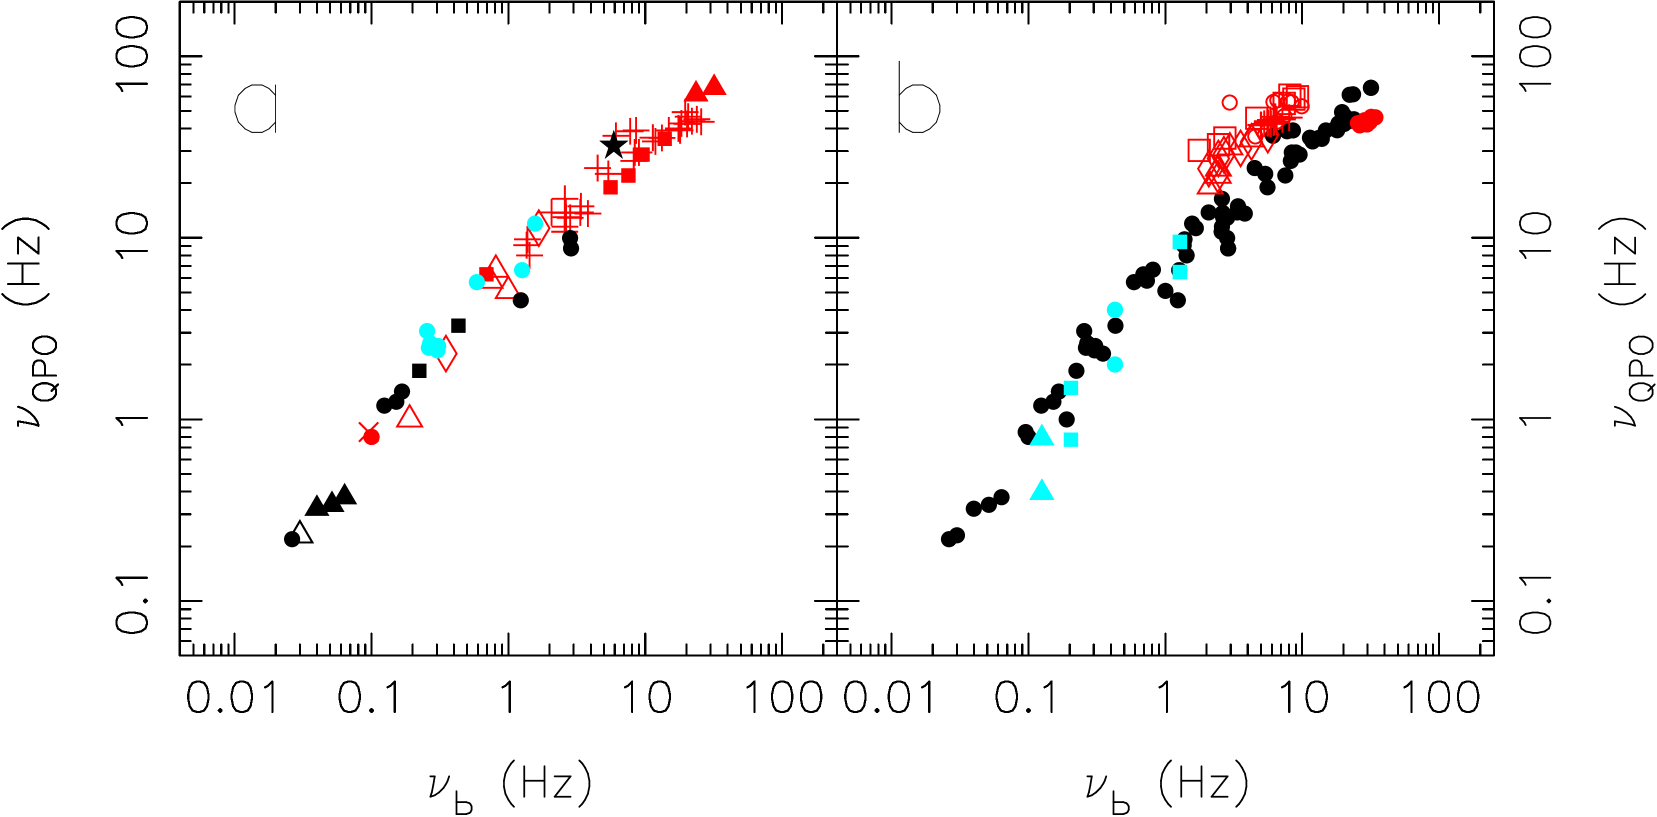
In Fig. 2a, is plotted versus obtained for the BHCs (black), the atoll sources (red), and the millisecond X-ray pulsar (blue). Although intrinsic scatter is present, is well correlated with for all three types of sources. The principal reason for the scatter could be the complex structure of the QPO. Considerable substructure, usually below the main peak, is often present (see e.g. Fig. 1a and b). Moreover, in 1E 1740.7–2942 and GRS 1758–258 two QPOs are detected, harmonically related to each other (Smith et al. 1997). It is possible that in the other sources also higher or sub harmonics are present, which are incorporated into the single Lorentzian used to fit the QPO, resulting in a QPO frequency which is slightly shifted with respect to the correct value. We did not plot the data of 1E 1740.7–2942 and GRS 1758–258 in Fig. 2a (but they are plotted in Fig. 2b) because it is unclear which one of the two QPO harmonics in those sources is similar to the one fitted in the other sources. A clue to resolve this might be that the fundamentals are in both sources only marginally consistent with the above described relation between and , while the second harmonics are completely consistent with it.
Another source for which the identification of the QPO is uncertain is GRO J1655–40 (also only shown in Fig. 2b). In this source above both a genuine QPO near 6.5 Hz and a broad bump near 9.5 Hz are present (see Fig. 2 of Méndez et al. 1998). The frequencies of both phenomena are consistent with the relation between and , although the frequency of the genuine QPO sometimes only marginally so. Such confusion might also be present in some of the other sources which do not clearly show both phenomena, although they could be present. This again could result in a somewhat shifted with respect to the correct value.
Despite the intrinsic scatter, the relation between and is very remarkable, extending over three decades in frequency for both axes, incorporating three different source types (BHCs, atoll sources, and the millisecond X-ray pulsar). The ratio of to does not remain constant, but it decreases with increasing frequency.
We investigated whether the Z sources at their lowest observed mass accretion rates also would fit this relation. The Z sources are plotted in Fig. 2b (red). Although a correlation between and does exist here too, it is clear that the Z sources do not follow the same relationship as the other sources.
3 Discussion
We have presented results on the broad band power spectra of different types of X-ray binaries. In BHCs, atoll sources, the millisecond X-ray pulsar, and the Z sources similar power spectral shapes below approximately 100 Hz are observed when they are at their lowest observed mass accretion rates. Fig. 2 shows that there is a good correlation between the break frequency of the band-limited noise component and the frequency of the QPO that is often observed above this break. The same correlation applies to the BHC, the atoll sources, and the millisecond X-ray pulsar, a slightly different one to the Z sources. Clearly, in Fig. 2b the Z sources are shifted to the left or to above the data obtained for the other source types. Perhaps the QPOs observed in the Z sources are the second harmonic instead of the fundamental, which would shift the data points of the Z sources exactly on top of those of the atoll sources and the BHCs. However, this seems to be ruled out by the tight correlation, covering atoll and Z sources, between these QPOs and the kHz QPOs (Psaltis, Belloni, & van der Klis 1998), indicating that the QPOs in Z sources are the same phenomenon as those observed in the atoll sources. This means that the obtained for the Z sources is not the one obtained for the atoll sources, perhaps due to the fact that the strong band-limited noise components are of different origin in the two types of sources.
3.1 BHCs, atoll sources, and the millisecond X-ray pulsar
The good correlation between and in BHCs and atoll sources (including the millisecond X-ray pulsar) suggest that the band-limited noise and the QPO are caused by one and the same physical mechanism (see also Wijnands & van der Klis 1998c). The similarities between these source types show that the presence or absence of a solid surface and a magnetosphere do not affect these rapid X-ray variability components. These components then most likely originate somewhere in the accretion disk at a distance of at least several tens of kilometers from the central compact object outside a possible magnetosphere, which has a radius of approximately 30 km for the millisecond X-ray pulsar (Wijnands & van der Klis 1998b). However, the large amplitudes of the band-limited noise (up to 50% rms) exclude that the emission carrying these fluctuations originates this far out in the accretion disk, because most of the gravitational energy of the accretion disk is released closer to the compact object. The apparent lack of inclination effects excludes, from a statistical point of view, line of sight obscuration as a mechanism. A modulation of the accretion rate due to instabilities in the flow in the region of the disk outside several 10 km from the compact object then remains as the most likely mechanism for generating the band-limited noise and the QPO. Another conclusion is that the HBOs observed in the Z sources, if they are indeed due to the same physical mechanism as the QPOs seen in the atoll sources (see above), cannot be explained by magnetospheric beat frequency models (Alphar & Shaham 1985; Lamb et al. 1985).
The question arise which fundamental properties of the sources determine the exact values of and . The effect of the magnetic field of the compact object is probably small in the region of the disk where the frequencies are determined. The other physical parameters which can affect the accretion disk are the mass and spin of the central object, and the mass accretion rate. For a given source the mass and spin do not change and most likely only the mass accretion rate determines and (both are thought to be positively correlated with ; e.g. van der Klis 1994b). Usually the relation between the frequencies and the inferred mass accretion rate is an one-to-one relation, however, it was shown that this is not the case for the millisecond X-ray pulsar (Wijnands & van der Klis 1998c). The reason for this is as yet unknown, but it could be related to the transient nature of this source (see also Wijnands & van der Klis 1998c). The difference between the sources with similar mass accretion rates would be the mass or the spin rate, or both, of the compact object. This could explain why on average the BHCs have smaller frequencies than the neutron star systems. However, considerable overlap between these source types occur, indicating that the mass accretion rate differences dominate the frequencies.
3.2 The Z source Sco X-1 in more detail
When examining the power spectra of Sco X-1, an extra noise component is present in the frequency region between the band-limited noise and the fundamental of the QPO (van der Klis et al. 1997; see also Fig. 3). A similar noise component just below the QPO can also be observed in GX 17+2 (Homan et al. 1998). Perhaps this extra noise component is similar to the band-limited noise observed in the other types of sources. The dominant band-limited noise in the Z sources is then something different, and could be related to, e.g., the 6–7 Hz QPO seen in Z sources at higher mass accretion rates (see also van der Klis et al. 1997).
In order to test the hypothesis that this extra noise component in Sco X-1 is similar to the band-limited noise in the other source types, we fitted the band-limited noise in Sco X-1 with a Lorentzian with a centroid frequency near zero Hertz and the extra noise component with a broken power law. The resulting data points ( between 25.5 Hz and 31.9 Hz; between 41.6 and 46.4 Hz) are shown in Fig. 2b as the red filled circles. The points are shifted to higher and, taking into account the systematic effects introduced by using a different fit function, are consistent with the same relation as the other sources. At this point, the relation of the band-limited noise and the extra noise component in the Z sources to the band-limited noise in the other sources is not entirely clear.
Acknowledgements.
This work was supported in part by the Netherlands Foundation for Research in Astronomy (ASTRON) grant 781-76-017. We thank many people, including several guests, at the Astronomical Institute “Anton Pannekoek” of the University of Amsterdam for their discussions about the low-frequency power spectra of X-ray binaries. Particularly, we wish to thank Eric Ford for providing the data on 4U 1728–34 and 4U 1705–44. We thank the anonymous referee for his helpful comments on the paper.References
- [1] Alpar, M. A. & Shaham, J. 1985, Nature, 316, 239
- [2]
- [3] Barret, D. & Vedrenne, G. 1995, ApJS, 92, 505
- [4]
- [5] Belloni, T., Méndez, M., van der Klis, M., Hasinger, G., Lewin, W. H. G., van Paradijs, J. 1996, ApJ, 472, L107
- [6]
- [7] Belloni, T., van der Klis, M., Lewin, W. H. G., van Paradijs, J., Dotani, T., Mitsuda, K., Miyamoto, S. 1997, A&A, 322, 857
- [8]
- [9] Cui, W., Heindl, W. A., Rothschild, R. E., Zhang, S. N., Jahoda, K., Focke, W. 1997a, ApJ, 474, L57
- [10]
- [11] Cui, W., Zhang, S. N., Focke, W., Swank, J. H. 1997b, ApJ, 484, 383
- [12]
- [13] Cui, W., Heindl, W. A., Swank, J. H., Smith, D. M., Morgan, E. H., Remillard, R., Marshall, F. E. 1997c, ApJ, 487, L73
- [14]
- [15] Ford, E., & van der Klis, M. 1998, ApJ, 506, L39
- [16]
- [17] Ford, E. C., van der Klis, M., & Kaaret, P. 1998, ApJ, 498, L41
- [18]
- [19] Fox, D., & Lewin, W. 1998, IAU Circ., 6964
- [20]
- [21] Gilfanov, M., Revnivtsev, M., Sunyaev, R., Churazov, E. 1998, A&A, 338, L83
- [22]
- [23] Grove, J. E., Strickman, M. S., Matz, S. M., Hua, X.-M., Kazanas, D., Titarchuk, L. 1998, ApJ, 502, L45
- [24]
- [25] Hasinger, G., & van der Klis, M. 1989, A&A, 225, 79
- [26]
- [27] Heindl, W. A. & Smith, D. M. 1998, ApJ, 505, L35
- [28]
- [29] Homan et al. 1998, A&A, in preparation
- [30]
- [31] Jonker, P., Wijnands, R., van der Klis, M., Psaltis, D., Kuulkers, E., Lamb, F. K. 1998, ApJ, 499, L191
- [32]
- [33] Lamb, F. K., Shibazaki, N., Alpar, M. A., Shaham, J. 1985, Nature, 317, 681
- [34]
- [35] Méndez, M., & van der Klis, M. 1997, ApJ, 479, 926
- [36]
- [37] Méndez, M., van der Klis, M., van Paradijs, J., Lewin, W. H. G., Lamb, F. K., Vaughan, B. A., Kuulkers, E., Psaltis, D. 1997, ApJ, 485, L37
- [38]
- [39] Méndez, M., Belloni, T., & van der Klis, M. 1998, ApJ, 499, L187
- [40]
- [41] Olive, J. F., Barret, D., Boirin, L., Grindlay, J. E., Swank, J. H., Smale, A. P. 1998, A&A, 333, 942
- [42]
- [43] Psaltis, D., Belloni, T., & van der Klis, M., 1998, ApJ, submitted
- [44]
- [45] Remillard, R. A., Morgan, E. H., McClintock, J. E., Bailyn, C. D., Orosz, J. A. 1998, ApJ, submitted
- [46]
- [47] Revnivtsev, M. , Gilfanov. M., & Churazov, E. 1998, A&A, in press (astro-ph/9804173)
- [48]
- [49] Smith, D. M., Heindl, W. A., Swank, J., Leventhal, M., Mirabel, I. F., Rodriquez, L. F 1997, ApJ, 489, L51
- [50]
- [51] Strohmayer, T. E., Zhang, W., Swank, J. H., Smale, A., Titarchuk, L., & Day, C. 1996, ApJ, 469, L9
- [52]
- [53] van der Klis, M. 1994a, A&A, 283, 469
- [54]
- [55] van der Klis, M. 1994b, ApJS, 92, 511
- [56]
- [57] van der Klis, M., 1998, in ’The Many Faces of Neutron Stars’ (NATO ASI Series C; Dordrecht Kluwer) (eds. R. Buccheri, J. van Paradijs & M. A. Alpar), 337
- [58]
- [59] Berger, M. & van der Klis, M. 1998, A&A, in press
- [60]
- [61] van der Klis, M., Swank, J. H., Zhang, W., Jahoda, K., Morgan, E. H., Lewin. W. H. G., Vaughan, B., & van Paradijs, J. 1996, ApJ, 469, L1
- [62]
- [63] van der Klis, M., Wijnands, R. A. D., Horne, K., & Chen, W. 1997, ApJ, 481, L97
- [64]
- [65] Wijnands, R. & van der Klis, M. 1998a, IAU Circ.6876
- [66]
- [67] Wijnands, R. & van der Klis, M. 1998b, Nature, 394, 344
- [68]
- [69] Wijnands, R. & van der Klis, M. 1998c, ApJ, 507, L63
- [70]
- [71] Wijnands, R. Homan, J., van der Klis, M., Méndez, M., Kuulkers, E., van Paradijs, J., Lewin, W. H. G., Lamb, F. K., Psaltis, D., Vaughan, B. 1997, ApJ, 490, L157
- [72]
- [73] Wijnands, R., Homan, J., van der Klis, M., Kuulkers, E., van Paradijs, J., Lewin, W. H. G., Lamb, F. K., Psaltis, D., Vaughan, B. 1998a, ApJ, 493, L87
- [74]
- [75] Wijnands, R., van der Klis, M., Méndez, M., van Paradijs, J., Lewin, W. H. G., Lamb, F. K., Vaughan, B., Kuulkers, E. 1998b, ApJ, 495, L39
- [76]
- [77] Wijnands, R., Méndez, M., van der Klis, M., Psaltis, D., Kuulkers, E., Lamb, F. K. 1998c, ApJ, 504, L35
- [78]
- [79] Yoshida, K., Mitsuda, K., Ebisawa, K., Ueda, Y., Fujimoto, R., Yaqoob, T., Done, C. 1993, PASJ, 45, 605
- [80]
- [81] Zhang, W. 1995, XTE/PCA Internal Memo
- [82]
- [83] Zhang, W., Jahoda, K., Swank, J. H., Morgan, E. H., & Giles, A. B. 1995, ApJ, 449, 930
- [84]
 |
 |
 |
| Source | Typea | Break frequencyb | QPO frequencyb | Satellite | Referencesc | |
|---|---|---|---|---|---|---|
| (Hz) | (Hz) | |||||
| Cyg X-1 | BHC | 0.026–2.9 | 0.29–10.0 | RXTE | 1, 2, 3, 4, 5 | |
| GX 339–4 | BHC | 0.040; 0.064 | 0.32; 0.37 | RXTE | 1, 2 | |
| XTE J1748–288 | BHC | 5.9 | 32 | RXTE | 6 | |
| XTE J1755–324 | BHC | 0.2–0.4 | 1.9–3.3 | RXTE | 2, 7 | |
| GRO J1655–40 | BHC | 0.20; 1.28 | 0.77 or 1.49; 6.48 or 9.48d | RXTE | 2, 8 | |
| GRO J0422+32 | BHC | 0.03e | 0.23 | CGRO/OSSE | 9 | |
| 1E 1740.7–2942 | BHC | 0.43 | 2.0f | RXTE | 10 | |
| GRS 1758–258 | BHC | 0.125 | 0.394f | RXTE | 10 | |
| 4U 1728–34 | A | 1.4–25.7 | 8.0–49.2 | RXTE | 11 | |
| 4U 0614+09 | A | 0.69–13.9 | 6.3–35.1 | RXTE | 1, 12 | |
| 4U 1608–52 | A | 0.2–1.0 | 1.0–6.7 | RXTE; Ginga | 1, 13 | |
| 4U 1735–44 | A | 23.5; 31.9 | 61.7; 67.0 | RXTE | 1, 14 | |
| 4U 1812–12 | A | 0.095 | 0.85 | RXTE | 1 | |
| 4U 1705–44 | A | 0.35; 1.67 | 2.3; 11.3 | EXOSAT; RXTE | 15, 16 | |
| 1E 1724–3045 | A | 0.1e | 0.8 | RXTE | 17 | |
| SAX J1808.4–3658 | P | 0.26–1.6 | 2.4–12.0 | RXTE | 2, 18 | |
| Cyg X-2 | Z | 3.0–9.9 | 36.1–55.6f | RXTE | 1, 19 | |
| GX17+2 | Z | 1.8–9.2 | 30.3–61.1f | RXTE | 1, 20 | |
| GX5–1 | Z | 2.1–5.6 | 22.3–37.0f | RXTE | 1, 21 | |
| GX 340+0 | Z | 2.1–4.3 | 19.2–34.9f | RXTE | 1, 22 | |
| Sco X-1 | Z | 5.0–8.0 | 41.6–46.4f | RXTE | 1, 23, 24 |