Emission within a Damped Lyman Absorption Trough: the Complex Sight Line Towards Q2059360††thanks: Based on observations obtained at the ESO La Silla Observatory
Abstract
We present new spectroscopic observations of the quasar Q2059360, confirming the existence of an emission feature within the Damped Lyman Alpha (DLA) absorption trough. By observing also at slit positions offset from the quasar, we show that the emission is spatially extended by at least a few arcseconds, and hence confirm that the feature seen must be due to emission rather than unusual absorption characteristics. We find that the DLA trough is very close in redshift to the broad Lyman emission line of the QSO, with the result that the DLA absorption removes much of the peak region of that line. Despite the similarity of the redshifts of the DLA and the QSO, the lack of high-ionization lines of the DLA system and the unresolved widths of the corresponding metal lines indicate that the DLA cloud is not an associated system.
The emission feature has a large velocity offset of +490 km s-1 with respect to the DLA system, and is resolved in velocity, comprising two components with a separation of 300 km s-1. We consider three possibilities: (1) Both emission and absorption occur within an object similar to the high redshift Lyman-break galaxies; (2) The emission feature arises from an object distinct from both the DLA absorber and the QSO, perhaps a young star-forming galaxy or a proto-galactic clump. It could be associated with the DLA absorber and perhaps the QSO in a compact group or cluster; (3) The redshifts are such that the emission feature could be due to Narrow Line Region filaments of the QSO, if the DLA absorption covers a sufficiently small angular size to allow the filaments to be seen beyond the edge of the DLA cloud.
1 Introduction
The systems causing redshifted Damped Lyman Alpha (DLA) absorption features in the spectra of quasars are the subject of many present studies, largely because they may be the progenitors of today’s normal galaxies, and because they represent the dominant form in which neutral hydrogen occurs at redshifts 2. The DLA column densities are usually taken to be (H i) 1020 cm-2, typical of the column in a present-day disc galaxy. Selection by such passive absorption is more likely to favour ‘normal’ galaxies, as opposed to those which may be found using selection based on the presence of an AGN. The similarity of column densities does not itself establish that DLAs are due to galactic discs, but some further support has come from the disc-like kinematics of DLAs observed by Prochaska & Wolfe (1996), although Haehnelt et al. (1997) show that merging pre-galactic clumps can also explain the observations. A connection between DLAs and galaxies is also suggested by the near equality of the high-redshift total mass density of DLAs and the measured total mass in galaxy discs in the local universe (Storrie-Lombardi et al. 1996). On the other hand, it is becoming apparent that there is a wider diversity of objects causing DLA systems at intermediate redshifts than for the intervening Mg ii absorption systems (Le Brun et al. 1997, Steidel et al. 1997a). The possible selection effect caused by dust extinction in discs of chemically evolved spiral galaxies must also be considered (e.g. Steidel et al. 1997a).
Absorption spectra examine a DLA absorber only along a single sight line, giving no direct indication of spatial extent and hence total H i mass. Additional insight into the nature of the DLA systems could be gained by detection of their emission, which should be feasible if they are indeed of galactic dimensions. A protogalaxy or young ‘normal’ disc galaxy can be expected to have a significant population of young stars, which will excite the surrounding gas and result in a variety of emission lines, including Lyman .
Several searches for such Lyman emission have been made, but with limited success. Hunstead, Pettini & Fletcher (1990) reported detection of emission from the = 2.465 DLA towards Q0836+113. The DLA feature totally blocks the light from the background QSO over a range of some 15 Å. Using intermediate dispersion spectroscopy, Hunstead et al. were thus able to see the faint emission from the DLA ‘galaxy’ against a dark background rather than superimposed on the QSO continuum. The result was confirmed with independent observations at a different telescope (Pettini et al. 1997), although other attempts to confirm this detection by use of narrow band filter imaging and further spectroscopy were unsuccessful (Wolfe et al. 1992, Lowenthal et al. 1995). A few other detections have been reported: PKS 0528250 at = 2.811 (Møller & Warren, 1993; Warren & Møller, 1996), Q2059360 at = 3.0831 (Pettini et al. 1995), Q2233+131 at = 3.1501 (Djorgovski et al. 1996) and Q0151+048A at = 1.9342 (Fynbo et al. 1997, Møller et al. 1998). The lack of detection in other cases, and the weak line fluxes of the positive detections, have led many authors to suggest that the Lyman photons are destroyed by dust in the clouds, with the probability of absorption enhanced by resonant scattering of Lyman photons (e.g. Charlot & Fall, 1991).
Apart from giving detections of the DLA ‘galaxies’ the Lyman emission line flux is important in that it can be used to indicate the star formation rate (SFR). Unless dust is destroying much of the Lyman flux, the values (or limits) found indicate surprisingly low SFRs, around 1 M⊙ per year (e.g. Hunstead et al. 1990).
We have commenced an observational project aimed at further clarification of the status of the DLA ‘galaxies’. Despite the known difficulties, we have sought to detect Lyman emission from these objects. In this first paper we report confirmation of the emission from the DLA towards Q2059360, and further elucidation of its properties. We have used intermediate dispersion spectroscopy (rather than narrow band imaging) because we believe it is essential to have adequate spectral resolution to separate a claimed DLA emission feature from the QSO’s light. It is also significant that the DLA’s emission peak need not coincide spatially with the background quasar; offsets of order 1′′ are likely, given the expected size of DLA absorbers (if they are indeed comparable in size to galaxies). Narrow band imaging is sensitive to objects anywhere near the QSO (although with reduced sensitivity very close to the QSO) while in this work we took spectra offset from the quasar position as well as centred on it. With the long-slit spectrograph, this provides a rudimentary two-dimensional mapping capability, while retaining the full spectral resolution. In the case of Q2059360, this strategy has demonstrated that the DLA emission is spatially extended, showing conclusively that it is a separate emission object or region, and not a peculiarity in the absorption of the background (spatially unresolved) QSO. We discuss a number of intriguing aspects of this system. The interpretation is complicated by the very near equality of the QSO emission and DLA absorption redshifts (closer than stated by Pettini et al. 1995), which gives rise to additional possibilities for the origin of the DLA emission feature and its relation to the absorber.
In the following we present our observations and the data reduction (§ 2). The results regarding the quasar spectrum, the absorber and the excess emission within the DLA trough are summarized in § 3 which is followed by a discussion of the geometry and the possible relations between QSO, absorber and the emission (§ 4). We conclude in § 5.
2 Observations and Reductions
The quasar Q2059360 (RA 21 02 44.6, Dec 35 53 07, J2000) was discovered by Warren et al. (1991). We observed it on the nights of 29, 30 and 31 August 1995 with the NTT at the ESO La Silla Observatory. The blue arm of the ESO Multi-Mode Instrument (EMMI) was used to cover the wavelength range from 4650 to 5100 Å with a 1200 g mm-1 grating providing a reciprocal dispersion of 17.5 Å mm-1. The slit width was 1.2′′ for all integrations, resulting in a resolution of 1.5 Å FWHM measured from lines in the comparison lamp spectrum. A thinned Tektronix 10241024 CCD binned in the spatial direction to yield a scale of 0.74′′ per pixel was used. Measurements of the spatial profile of the quasar in a continuum band near the Lyman emission showed that the spatial binning was justified, with only a few observations being slightly undersampled (cf. Table 1). We also binned the CCD in the spectral direction to a reciprocal dispersion of 0.84 Å per pixel. Although this undersampled the line profiles slightly, it assisted in detecting any faint unresolved flux by concentrating as much light as possible into a single pixel. The CCD readout noise was 4.3 electrons rms.
Integrations of one hour each were obtained with the slit oriented east-west and positioned at various declination offsets from the quasar to map the spectrum of any extended or displaced emission source. Individual observations were also offset along the slit to position the spectrum at different places on the CCD, so guarding against faint CCD artefacts masquerading as signal. The observation log is presented in Table 1.
| obs number | date | airmass | offseta | spatial | comments | |
|---|---|---|---|---|---|---|
| (UT Start) | (′′) | FWHM (′′) | ||||
| 49 | 1995 August | 29.013 | 1.19 | 0.4 | 1.9 | thin cirrus |
| 50 | 29.060 | 1.06 | 0.0 | 1.3 | thin cirrus | |
| 56 | 29.125 | 1.01 | 1.7 | 1.7 | thin cirrus | |
| 71 | 29.227 | 1.22 | 1.0 | 1.6 | thin cirrus | |
| 120 | 29.981 | 1.33 | 0.5 | 1.4 | - | |
| 121 | 30.024 | 1.14 | 1.2 | 1.5 | affected by cosmic ray | |
| 124 | 30.072 | 1.04 | 1.9 | 1.3 | - | |
| 125 | 30.122 | 1.01 | 0.4 | 1.3 | affected by cosmic ray | |
| 184 | 30.993 | 1.25 | 0.0 | 1.5 | affected by cosmic ray | |
| 185 | 31.036 | 1.10 | 1.9 | 1.7 | - | |
| 188 | 31.085 | 1.02 | 2.3 | 1.7 | - | |
| 189 | 31.127 | 1.02 | 2.1 | 1.7 | - | |
Note: a ‘Offset’ refers to the slit positioning with respect to the quasar; positive offsets place the slit north of the quasar. The determination of the offsets in declination was complicated by errors in the recorded telescope positions; the values given are accurate to — , well within the slit width.
The reductions included the removal of CCD instrumental effects. In this process a low-level fixed pattern noise, probably from the CCD controllers, was seen in the average of multiple bias or dark frames. The amplitude (2 ) was, however, negligible compared to the Poisson fluctuations in the signal obtained from the sky background, which had an average level of 100 . The target frames were then flatfielded with high-level dome flat fields. Cosmic ray removal was performed manually around the spectrum, because we are looking for emission with unknown width and strength. However, at separations of more than about 10′′ from the quasar spectrum automatic removal of cosmic rays was used. We then removed any background light by fitting polynomials to the smooth part of the spatial intensity distribution (i.e. excluding the QSO spectrum) and subtracting this background. In this way the sky background was assessed over a large number of spatial rows, with the result that sky subtraction added negligible noise to the desired spectrum. The smooth component of the dark current was also removed by this process. The wavelength solution was found for each spectrum using ThAr lamp observations obtained directly before or after each integration. The accuracy achieved is 0.22 Å rms, which is acceptable considering the pixel scale and the undersampling of the spectrum. The alignment and possible image distortions were determined using standard star spectra and corrections applied to the two-dimensional data at the same time as the wavelength transformation. All spectra were further corrected to vacuum wavelengths and transformed to the heliocentric frame.
Flux calibration was performed using the standard stars LTT 7987 and LTT 9491 (Hamuy et al. 1994) observed under the same conditions as the QSO, including a comparable airmass. The absolute flux zero-point varied by less than 15% for individual observations in the three nights. We take this to be the uncertainty in the absolute flux measurement. The relative flux calibrations as a function of wavelength agree to better than 4% between observations.
Note that the absolute flux calibration is not needed for the detection of any emission associated with the damped system. As will be shown below (section 3) the uncertainty in the emission flux is dominated by the low signal level of the detection.
The ‘spatial FWHM’ measurements reported in Table 1 are from Gaussian fits to the spatial profile of the longslit spectra. The instrument focus of the EMMI blue arm makes a significant contribution to the width, since the seeing as measured from direct images was appreciably better (0.8′′ FWHM in R). We set the spectrograph to the optimum focus for the spatial profile, after tests showed that this did not coincide with the best spectral focus.
A severe problem is the high cosmic ray rate of the chip. The automatic procedure which we employed away from the spectrum typically removed about 1400 events per 1 hour exposure. In a few cases we had cosmic ray events close to or in the region of the damped line. Those events were very carefully removed manually and the result checked to be sure not to introduce any artefacts into the data. In three cases, indicated in Table 1, we could not reliably remove the cosmic ray near or on the position of the emission reported here. The affected regions of those three spectra were flagged (e.g. in Figure 2) and those runs were excluded from the spectra of the emission feature itself (Figure 10).
3 Results
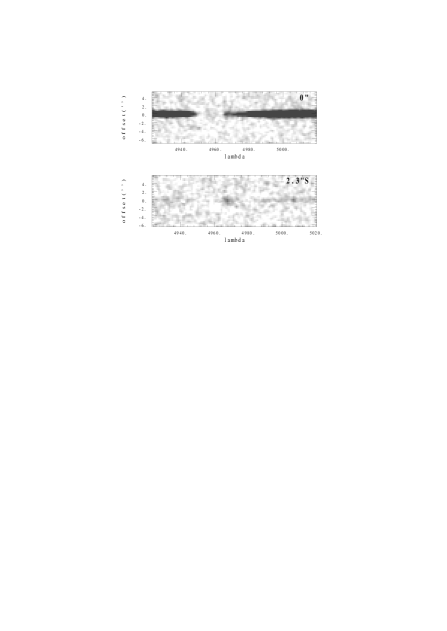
The 12 spectra are displayed in Figure 2, in order of declination offset. Only the part of the spectrum near the DLA trough is shown, and the spectra have been smoothed with a Gaussian of 0.7Å to optimally show the weak emission feature. The drop in intensity of the QSO spectrum at larger offsets is clearly visible. The scatter around the zero level in the four spectra between 1.9 and 2.3 arcseconds south, where the QSO continuum is negligible, indicates the noise level achieved by the individual integrations. The spectra centered on Q2059360 clearly show the damped system, and a few Lyman forest lines on the blue side of the trough.

For the investigation of the quasar spectrum we combined the five observations with offsets smaller than 1′′, totalling 5 hours. The result is shown in Figure 4, which covers the full observed wavelength range, and is unsmoothed. As well as the DLA trough, the spectral region observed covers several metal lines in the 3.083 (DLA) system. Si ii 1190 appears blended with a Lyman forest line, but Fe ii 1144, Si ii 1193 and Si iii 1206 give good detections and show no evidence of blending. Line fitting was performed using the Xvoigt package (Mar & Bailey 1995). The redshifts derived from these lines are 3.08294, 3.08299 and 3.08317, respectively, giving a mean of 3.08303 0.00007, in good agreement with the value derived by Pettini et al. (1995). The metal lines are essentially unresolved in our intermediate dispersion spectra, giving an upper limit to the Doppler velocity dispersion parameter of 60 80 km s-1 and a best estimate of 30 km s-1. Accurate column densities cannot be obtained because our spectral resolution is not adequate to rule out saturation of the lines. Nevertheless, the observations indicate iron and silicon abundances of 0.015 solar and 0.04 solar respectively, if we use the best estimate value and the N(H i) value given below. If confirmed by higher resolution observations, the results show the low enrichment typical of DLAs and high redshift intervening QSO absorption systems in general (Lu et al. 1996, Pettini et al. 1997). No other metal lines in this absorption system were detected in our spectrum, largely due to the restricted wavelength coverage and the effects of the Lyman forest. The N v 1238, 1242 lines are not detected, to a limit of 0.07 Å (3 ) equivalent width in the rest frame. There is also a probable absorption system at a redshift of 0.9560 0.0001, which produces Fe ii 2586, 2600 lines longward of the Lyman emission peak.

Figure 4 also shows the prominent DLA absorption. In order to estimate the neutral hydrogen column, and to optimally separate the DLA-emission feature from the QSO emission, we fitted a Voigt profile to the DLA, again using Xvoigt. The process of continuum fitting was complicated by the proximity of the DLA absorption to the broad Lyman emission line of the QSO. We performed a quasi-simultaneous fit to the absorption and QSO emission profiles, via the following steps: (a) A preliminary continuum fit, bridging smoothly across the DLA; (b) A preliminary fit to the DLA (leaving large residuals in both wings of the line, due to the inappropriate continuum); (c) Formation of a spectrum equal to the original spectrum divided by the model DLA fit, the latter truncated below 0.025 transmission. This gives an estimate of the quasar spectrum without the effects of the DLA; (d) A smooth fit to the latter spectrum, bridging across the noisy range where the DLA is black and/or affected by the emission feature. This provides a new estimate of the continuum + emission line spectrum of the quasar; (e) A new fit to the DLA, etc. The procedure was iterated 3 times, with only minor corrections after the second pass. The procedure works because it is able to make use of the sides of the damped profile, where transmission is measurable and is influenced by both the emission and absorption profiles. The truly black part of the DLA is sufficiently narrow that it can be successfully bridged in step (d), provided that we accept that the emission profile should vary smoothly.
Figure 4 includes the resulting fit and shows that the DLA has removed the major Lyman emission peak of the QSO. We measure an emission redshift for the model of 3.097 0.005 which is closer to the original 3.09: value given by Warren et al. (1991) than to the 3.13 value given by Pettini et al. (1995). Inspection of the emission spectrum given by Warren et al. (1991) and a low dispersion spectrum obtained by us (Leibundgut and Robertson 1998) shows that the redshift based on C iv 1548, 1550 alone is 3.085 (using 1549.06Å, Gaskell 1982). Moreover, the equivalent width of the Lyman /N v emission line is only half that of C iv, whereas it is normally about twice the strength of C iv, again consistent with the DLA having removed the major part of the Lyman emission line.
For the DLA itself we measure a column density of 20.850.03. Both wings of the damped profile are fitted well. The redshift of the DLA is 3.0825. The fact that we find a slightly higher column density compared with the Pettini et al. (1995) value of 20.70 can be attributed to the different treatment of the broad QSO emission line and a small but significant redshift difference between the DLA absorber and the metal lines in the same system. We obtain a better fit of the model DLA/continuum to the data than that shown by Pettini et al., who constrained their fit to the redshift derived from the metal lines. The metal lines give a redshift about 40 km s-1 larger than that of the best fit Voigt profile for the DLA itself. This discrepancy is somewhat larger than the uncertainty we expect even with the complication of fitting the QSO’s broad Lyman emission line superimposed on the DLA.
Excess emission is clearly detected at the bottom of the damped line. As Figure 2 shows, this emission is detected in several individual exposures including positions offset from the QSO sight line (spectra 124, 185, 188, and 189). All spectra obtained on or South of the quasar show excess emission at 4968Å, although in some cases rendered unreliable by nearby cosmic ray hits. To help illustrate the reality of the detections we show in Figure 6 the combined longslit spectra of all observations on the QSO and the 4 observations at an offset of 2′′ South, smoothed to match the instrumental resolution in the spectral direction and the profile width in the spatial direction. In all images except the northern positions we clearly detect the emission at the bottom of the Lyman trough, demonstrating the reality of the emission.
In order to examine any spatial separation of the weak DLA emission from the QSO in the RA direction (i.e. along the slit), we determined the exact location of the quasar spectrum in the RA direction by collapsing the data in the spectral direction in the range above 5000Å, where the quasar continuum dominates. This is reliable for all observations where we do detect quasar light, but could be misleading for the largest offset positions. The separate emission feature was also located by a Gaussian centering algorithm and the position relative to the QSO is recorded in Table 2. The resulting East-West positional displacement of the DLA emission feature with respect to the QSO is shown in Figure 8a. To within the uncertainties the emission remains centred on the QSO in this direction for all the observations at various N-S positional offsets.
| obs number | wavelength | displacementa (East-West) | Ly flux | FWHM |
|---|---|---|---|---|
| (Å) | (′′) | ( erg s-1 cm-2) | Å | |
| 49 | 4969.6 | 0.59 | 0.59 | 6.2 |
| 50 | 4971.1 | 0.38 | 1.0 | 8.5 |
| 56 | 0.16 | |||
| 71 | 0.34 | |||
| 120 | 4971.9 | 0.11 | 0.84 | 8.9 |
| 121 | 4970.6a | 0.44 | 0.62 | 6.0 |
| 124 | 4970.4 | 0.54 | 1.0 | 10.8d |
| 125 | ||||
| 184 | ||||
| 185 | 4968.0 | 1.12 | 0.46 | 6.9 |
| 188 | 4968.5 | 0.62 | 0.80 | 4.8 |
| 189 | 4968.7 | 0.75 | 0.88 | 5.0 |
| Notes: a‘Displacement’ refers to the spatial separation of the emission | ||||
| from the quasar spectrum, with East offsets positive. | ||||
| baffected by nearby cosmic ray | ||||
| cline not detected | ||||
| ddiffuse appearance in 2D spectrum | ||||


The flux of that part of the DLA emission feature which passed through the slit in each observation was measured by integrating over the wavelength range of the emission after subtraction of the QSO’s light. The background level was taken from the wavelengths blueward of the emission feature, i.e. in the black part of the DLA trough, with no contribution from wavelengths redward of the emission feature, where residuals of the subtraction process increase the uncertainties. The resulting fluxes are given in Table 2. The error of these fluxes is about 3 erg s-1 cm-2 for an integration interval of 12Å, as measured from the scatter in the background region. The fluxes are plotted in Figure 8b. With the available signal-to-noise ratio there is no clear trend of the total flux with offset position south of the QSO.
The centroid wavelength of the DLA emission feature was determined for each observation (other than those affected by cosmic rays in the critical places) and is plotted in Figure 8c. There is an indication of a shift of the central wavelength with offset from the quasar. We discuss below whether this can be interpreted as a rotation curve.
Finally, in Figure 8d we show evidence for narrowing of the lines with increasing offset distance from the quasar. There is, however, a strongly discrepant point in this relation from one spectrum which appears to show a diffuse and possibly multi-component structure. With the S/N available to us we cannot be certain of the reality of the narrowing trend. As discussed below, the emission feature probably consists of two components in velocity, and some narrowing in total velocity width is to be expected as the higher velocity component fades at southern offsets, while the flux of the lower velocity component is maintained (as shown in Figure 10).
Using the model fit of the damped system shown in Figure 4 we subtracted the quasar’s contribution from all the spectra we obtained. (The model spectra were scaled by the flux observed between 5000 and 5080 Å, where the QSO continuum dominates.) This gave the best estimate of the spectrum of the emission feature as isolated from the QSO/DLA spectrum. Figure 10 shows the results, after averaging the observations in three groups with different amounts of N-S offset from the quasar.
4 Discussion
4.1 The Line of Sight Towards Q2059360
We now consider the nature of the DLA absorber and the Lyman emitter, and the possible relationships among these two objects and the quasar. The large velocity difference between the absorber and the emitter, and the relatively small velocity difference between the absorber and the quasar emission may indicate a complex link between these three observed components. We will review the evidence and examine possible interpretations of the data.
4.2 Identification of the Rest Wavelength of the Emission Feature
We first examine whether the emission feature should be interpreted as Lyman emission. While it is not possible to be certain with the present data, which show only the one emission line, we nevertheless believe that a strong case can be made that the line is due to Lyman .
The only plausible alternative identification would be [O ii] 3726.1, 3728.8 at a redshift of 0.3333. The velocity splitting of these lines is 217 km s-1. This is less than the observed separation of the two emission components (approximately 300 km s-1), but the limited signal/noise of the data could still allow this identification. We base our rejection of this hypothesis on the low probability of such a close coincidence in both wavelength and position on the sky. If the object is a foreground galaxy at 0.3333, then it is totally unrelated to both the DLA and the QSO. The near coincidence in wavelength with the DLA absorption is not in itself extremely unlikely, but combined with the very close spatial alignment, the identification with the [O ii] line is unlikely. It could be argued that we have effectively selected such a system, by searching for emission near QSOs. But the search has been made for only a small number of quasars, and the spatial alignment is much closer than necessary for the emission to be detected (when we include narrow band filter searches by other investigators). In contrast, if the line is Lyman , then the spatial alignment follows from some form of physical association between the emitter and the DLA and/or the QSO. We might also expect to detect continuum emission from the galaxy if it is at 0.3333. Should the emission indeed be the [O ii] doublet, then the line ratio changes dramatically with spatial offset. In fact, the ratio at the largest offset position (2′′ from the DLA) is close to the optically thick value of 0.3 (Osterbrock 1989), implying the highest density gas there. The line ratio of unity (coincident with the DLA) indicates a low density region there. This would represent a very strong density gradient in the [O ii] over a range of about 12 kpc , although it would not be unreasonable for a normal galaxy. (We use 50 km s-1Mpc-1).
Further observations of the emitter to search for the C iv 1548, 1550 line (at 6328) and for the continuum will be attempted. For the present, we will treat the emission feature as representing Lyman emission.
4.3 The absorber
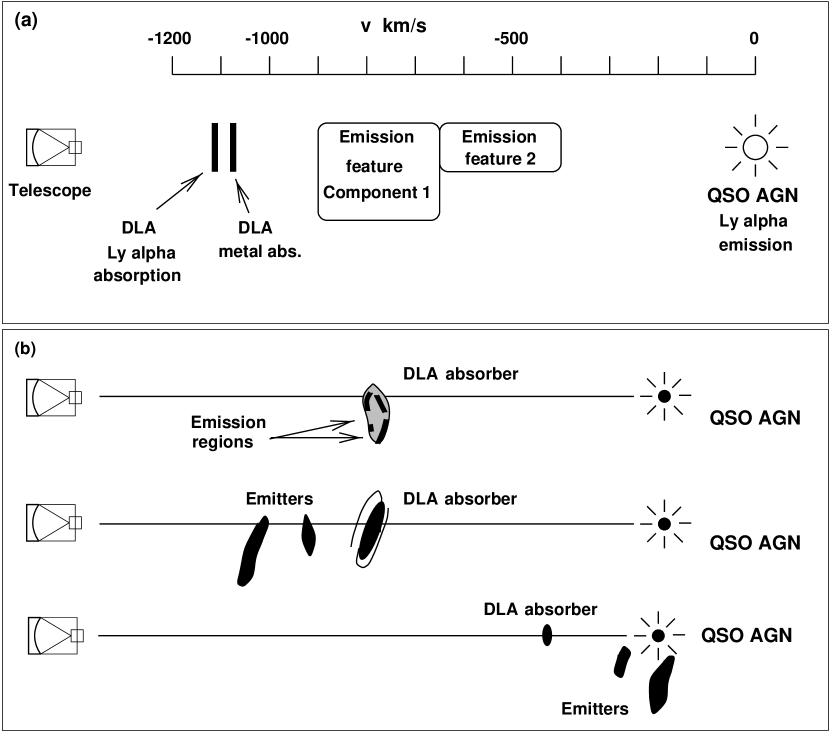
The DLA system is similar in H i column density to typical DLAs in quasar spectra, but its velocity separation from the quasar emission redshift is unusually small. It is now well known that the broad QSO emission lines Lyman and C iv are subject to mean blueshifts and substantial scatter of their velocity with respect to the systemic velocity of the QSO host galaxy (Gaskell 1982; Tytler & Fan 1992). With only these two QSO emission lines observed (the C iv line from Warren et al. 1991 or from Leibundgut and Robertson 1998), it is impossible to calculate accurate velocities of the DLA absorption and emission features with respect to the true QSO rest frame. We have used the effective rest wavelengths of Lyman and C iv from Tytler & Fan (1992), which at least remove the mean bias of redshifts calculated from these lines. The various emissions and absorptions are shown on a radial velocity scale in Figure 12a, where the zero point for velocity has been taken as the upper part of the peak of the QSO’s corrected Lyman emission line as reconstructed in Figure 4. The DLA absorption lies 1100 km s-1 blueward of this, with the two emission feature components in between. However, if the QSO redshift is taken instead from the peak region of the corrected C IV emission line, it falls only 500 km s-1 redward of the DLA, i.e. within the second DLA emission feature.
While we cannot find a definite lower limit to the separation of the DLA cloud from the QSO, it is clear that the DLA absorption system is not one of the ‘associated’ systems in close proximity to the parent QSO (Hamann 1997; Hamann et al. 1997). Such systems typically display high ionization transitions and have relatively wide lines (300 km s-1). In contrast, the damped system towards Q2059360 does not display the Nv doublet (see §3), and the observed line widths are not more than about 100 km s-1. Associated systems also show metal abundances of solar or higher (Petitjean & Bergeron 1994, Hamann 1997, Franceschini & Gratton 1997). The abundances we calculated above ( 0.015 solar and 0.04 solar for iron and silicon respectively) are only approximate lower limits, because of possible line saturation. But if the lines are indeed sufficiently saturated for the abundances to approach solar values, then the intrinsic velocity spread (Doppler parameter) can be only some 10 to 15 km s-1, further increasing the contrast with the line widths typical of associated systems. Moreover, other DLA systems with have been reported to be spatially separated from the quasar (Møller et al. 1998, Ge et al. 1997).
It is clear that the DLA absorber is not significantly affected by radiation from the quasar; the absorber has properties similar to those systems known to be independent objects well separated from their background quasar. The conventional interpretation of such objects is as galaxy discs (Wolfe et al. 1995) or proto-galactic clumps (Haehnelt et al. 1997).
Three possible spatial configurations of the QSO, absorber and emitter are shown in Figure 12b. The velocity difference between the QSO and the absorber would be consistent with them being members of a group or a cluster.
Another interesting feature of the absorber is the small but probably significant 40 km s-1 redshift of the metal absorption lines relative to the hydrogen in the DLA. Velocity differences of this order between Lyman forest lines and the corresponding C iv lines have been noted previously (Womble et al. 1996), but it is more surprising to find a difference between the hydrogen and low ionization species which can co-exist with H i. The Lyman absorption line in the DLA system has been observed (Pettini et al. 1995) and shows a similar velocity offset with respect to the metal lines (Hunstead, private communication).
4.4 The Lyman emission feature
4.4.1 Velocity relationships
We should like to know what physical system gives rise to the Lyman emission feature in the DLA trough seen towards Q2059360, and whether the emitter is associated with the absorber, the quasar, or neither. Unlike the Ly emission features in PKS 0528250 (Warren & Møller 1996) and Q0836+113 (Hunstead et al. 1990), which are centered in wavelength on the respective damped systems, the emission in the absorption trough towards Q2059360 is redshifted by about 490 km s-1. Velocities of up to 300 km s-1 have been observed in other detections of emission/absorption pairs (Warren & Møller 1996, Djorgovski et al. 1996, Lu et al. 1997).
The large velocity difference between DLA absorption and emission rules out the interpretation of both arising from a dwarf galaxy, as proposed for Q0836+113 (Hunstead et al. 1990). Even a large disc galaxy, with absorption and emission occurring in different places in the disc (Prochaska & Wolfe 1997, Lu et al. 1997), is not likely to give an offset of some 500 km s-1. Instead, the results are more suggestive of several pre-galactic clumps (Haehnelt et al. 1997; Warren & Møller 1996; Pascarelle et al. 1996).
However, recent work has shown that the velocity offsets between Ly emission and stellar absorption lines observed in high-redshift galaxies can amount to several hundred km s-1 (Franx et al. 1997, Steidel et al. 1997b) or even exceed 1000 km s-1 (Pettini et al. 1998). However, the highest values are thought to be partly due to strong outflow in the interstellar medium, and it is not clear that a DLA cloud could arise in such an outflow. Velocity offsets of about 300 km s-1 between the Lyman emission and the galactic absorption lines have also been observed in nearby galaxies and were interpreted as due to infalling gas (Lequeux et al. 1995).
It is significant that our observations have resolved the emission feature in both wavelength and spatial extent. Within the limited signal/noise of the present data, it appears likely there are two components, as revealed by the results shown in Figure 10: component 1, with emission centred at 4968.1 Å ( 3.0867) and showing equal line flux at all slit positions observed, both on and off the quasar; and component 2, centred at 4972.9 Å ( 3.0907), showing equal line flux to component 1 on the quasar and up to 0.5′′ south, but tapering to a much lower flux at 2′′ south. Our observation of emission component 1 corresponds to a physical extent of at least 14 kpc ( 50 km s-1Mpc-1, 1) or 25 kpc ( 50 km s-1Mpc-1, 0.1), i.e. of galactic dimensions. It is remarkable, however, that one of the two emission line peaks shows no perceivable wavelength shift over this spatial extent (Fig. 10) .
As Figure 8c shows, the centroid wavelength of the emission feature shifts by about 3 Å as it is traced from the QSO to the point 2′′ away to the south. If this Figure is interpreted as a rotation curve, a lower limit on the mass of the system of 1.7 M⊙ ( 1) or 2.9 M⊙ ( 0.1) can be derived. On the other hand, Figure 10 makes clear that the shift of average wavelength with declination is the result of a changing intensity ratio between the two emission components, each of which has a constant wavelength. Thus the mass limit may not be physically meaningful.
4.4.2 Physical interpretation
The observed flux from the emission feature is comparable to some of the Lyman emission lines observed in galaxies at 3 (Steidel et al. 1996, Lowenthal et al. 1997) and the overall spatial extent is similar to the typical galaxy sizes at these redshifts (Giavalisco et al. 1996). But we could be observing two distinct, point-like, emissions which are separated by 1 - 2 ′′, or an extended source. One interpretation of our data is that we have observed a young star-forming galaxy or proto-galactic clump(s) in close association with the galaxy causing the DLA absorption.
In order to be seen at the wavelengths where the DLA is black, the emitter must naturally be in front (or to the side) of the DLA absorbing cloud. (The somewhat higher redshift of the emitter compared to the absorber can be ascribed to peculiar velocities.) In fact, the DLA absorbing cloud can be regarded as an occulting disc, effective over a narrow but significant range of wavelengths around Lyman , and enabling us to see any faint object in front of it or beside it without interference from the QSO’s light.
Given the large velocity offset between the absorber and emitter, it may be that they form part of the same group, which could also include the QSO. Further observations to search for other group members would be worthwhile.
It is possible that the QSO’s radiation field may excite the emission feature directly or stimulate it indirectly (e.g. by star formation), rather than the feature being an independent self-luminous region. The broad quasar Lyman emission line includes the wavelength of the DLA. This implies a substantial flux from the QSO, both line and continuum, at the DLA Lyman wavelength. Although only a small number of DLAs have been detected in emission, it is interesting to note the probable over-representation of systems with DLA redshift close to the QSO’s emission redshift (PKS 0528250; Q2059360; Q0151+048A; see also Møller et al. 1998). If confirmed by further cases, this would suggest the nearby quasar does sometimes have a role in producing the emission from the DLA region.
The low rate of detections of emission from DLAs has been remarked on many times. We point out here that this result is closely related to the minimal success of field searches for high redshift Lyman emitting galaxies/protogalaxies (e.g. Thompson & Djorgovski 1995). Accepting that the clouds which cause damped absorptions in QSO spectra are normally not physically associated with the QSO, and based on the number statistics of DLAs (Wolfe et al. 1995), it can be shown that a substantial fraction of the sky has at least one potential high column density cloud at a redshift which would place its Lyman absorption/emission in the visible. Thus, if damped absorbers were frequently found in emission, the corresponding clouds which do not happen to lie in front of a QSO would be sufficiently common to have appeared in substantial numbers in the blank-sky searches. Even in our long-slit observations targeted at Q2059360, we could expect 7 to 14 such objects along the 3.1 arcminute slit with Lyman in the observable redshift range of 2.457 to 2.832 (assuming each DLA system to have an angular size of 1 - 2′′). No other objects were found. We note, however, that establishing the reality of an isolated emission feature at a position and wavelength not indicated by any other data, would require a signal greater than we observed towards Q2059360. The above argument applies at the sensitivity levels achieved by 4-m class telescopes; using the Keck II telescope Hu et al. (1998) have shown that a substantial population of Lyman emitting objects can indeed be found in the field.
4.5 Relation of the Emission Feature to the QSO
We consider three possibilities for the situation of the DLA emission region with respect to the quasar, as shown in Figure 12b.
(i) Both the DLA absorption and the Lyman emission could occur within an object similar to the high redshift Lyman-break galaxies. High relative velocities between emission and (interstellar) absorption have been demonstrated by Pettini et al. (1998). However, the existence and survival of clouds with a DLA column density in such galaxies has yet to be established.
(ii) It is possible that the absorber is well separated from the QSO. Since the emission region cannot be directly behind the opaque DLA absorber, the emission feature regions would not be physically associated with the QSO. At most their emission could be enhanced by the influence of the quasar’s radiation field. The emitter and absorber could be part of a group or cluster. Clustering in redshift space has been recently reported at these redshifts (Steidel et al. 1997b).
(iii) The third model in Figure 12b accounts for the near equality of the emission feature and QSO redshifts (especially when the latter is taken from the C iv line). It interprets the emission features as arising near the QSO, either from filaments of the quasar’s Narrow Line Region (NLR), or close companion(s) of the QSO. The features observed as spatially coincident with the QSO could be close beside it, at a separation not resolved by the seeing disc of our observations. This requires that the DLA absorbing cloud have a small physical size (or more precisely, that the absorption have a sharp edge). The DLA could then occult the QSO but leave visible the extended emission close beside it. Their spatial extent is consistent with the emission features being due to NLR filaments (Bremer et al. 1992, Heckmann et al. 1991). In this picture it is possible for the DLA absorber to lie within the QSO host galaxy.
5 Conclusion
Our observations confirm that there is emission within the damped Lyman absorption trough of Q2059360, and we show that the emission is extended both spatially and spectrally. The interpretation of this emission is complicated by two factors: (i) the large velocity offset between absorption and emission; (ii) the closeness of the QSO emission redshift to the DLA emission feature. The emission could be from a high redshift galaxy which also contains the DLA absorbing cloud, alternatively the emission feature could be due to object(s) in the vicinity of the DLA absorber but distinct from it, or filaments or companions of the QSO itself.
The nature of the system could be clarified by further observations, in particular: (i) Detection of other emission lines (especially C iv) and/or the continuum from the emission features; (ii) Determination of a more accurate systemic velocity for the QSO, most likely via detection of additional low-ionization emission lines; (iii) A more comprehensive study of the metal lines in the DLA absorption system at higher resolution. We will address these points in future work.
ACKNOWLEDGMENTS
We thank the ESO Observing Programs Committee for allocation of telescope time, and the ESO site staff for assistance. The Science Foundation for Physics within the University of Sydney supported travel for JGR. We also thank Dr. R. Hunstead for useful comments. We thank the referee for comments which have improved the paper.
References
- 1 Bremer M.N., Fabian A.C., Sargent W.L.W., Steidel C.C., Boskenberg A., Johnstone R. M., 1992, MNRAS, 258 23P
- 2 Charlot S., Fall S.M., 1991, ApJ, 378, 471
- 3 Djorgovski S.G., Pahre M.A., Bechtold J., Elston R., 1996, Nature, 382, 234
- 4 Franceschini A., Gratton R., 1997, MNRAS, 286, 235
- 5 Franx M., Illingworth G. D., Kelson D. D., van Dokkum P. G., Tran K.-V., 1997, ApJ, 486, L75
- 6 Fynbo J., Møller P. and Warren S.J., 1997, Proc. conf. ‘Structure and Evolution of the Intergalactic Medium from QSO Absorption Line Systems’, ed. P. Petitjean, Paris, in press
- 7 Gaskell C. M., 1982, ApJ, 263, 79
- 8 Ge J., Bechtold J., Walker C., & Black J. H., 1997, ApJ, 486, 727
- 9 Giavalisco M., Steidel C.C., Macchetto F.D., 1996, ApJ, 470, 189
- 10 Haehnelt M.G., Steinmetz M., Rauch M., 1998, ApJ, 495, 647
- 11 Hamuy M., Suntzeff B.N., Heathcote S.R., Walker A.R., Gigoux P., Phillips M.M., 1994, PASP, 106, 566
- 12 Hamann F., 1997, ApJS, 109, 279
- 13 Hamann F., Barlow T.A., Junkkarinen V., Burbidge E.M., 1997, ApJ, 478, 80
- 14 Heckmann T.M., Lehnert M.D., Miley G.K., van Breugel W., 1991, ApJ, 381, 373
- 15 Hunstead R.W., Pettini M., Fletcher A.B., 1990, ApJ, 356, 23
- 16 Hu E.M., Cowie L.L., Mcmahon R.G., 1998, ApJ, 502, L99
- 17 Le Brun V., Bergeron J., Boissé P., Deharveng J.M., 1997, A&A, 321, 733
- 18 Leibundgut B., Robertson J.G., 1998, The Young Universe, ed. S. D’Odorico, E. Giallongo, ASP Conf. Ser. 146, 186
- 19 Lequeux J., Kunth D., Mas-Hesse J.M., Sargent W.L.W., 1995, A&A, 301, 18
- 20 Lowenthal J.D., Koo D.C., Guzman R., Gallego J., Phillips A.C., Faber S.M., Vogt N.P., Illingworth G.D., Gronwall C., 1997, ApJ, 481, 673
- 21 Lowenthal J.D., Hogan C.J., Green R.F., Woodgate B., Caulet A., Brown L., Bechtold J., 1995, ApJ, 451, 484
- 22 Lu L., Sargent W.L.W., Barlow T.A., Churchill C.W., Vogt S.S., 1996, ApJS, 107, 475
- 23 Lu L., Sargent W.L.W., & Barlow T.A., 1997, ApJ, 484, L131
- 24 Mar D.P., Bailey, G., 1995, PASA, 12, 239
- 25 Møller P., Warren S.J., 1993, A&A, 270, 43
- 26 Møller P., Warren S.J., & Fynbo J. U., 1998, A&A, 330, 19
- 27 Osterbrock D.E., 1989, Astrophysics of Gaseous Nebulae & Active Galactic Nuclei, (Mill Valley: University Science Books)
- 28 Pascarelle S.M., Windhorst R.A., Keel W.C., Odewahn S.C., 1996, Nature, 383, 45
- 29 Petitjean P., Bergeron J., 1994, A&A, 283, 759
- 30 Pettini M., Hunstead R.W., King D.L., Smith L.J., 1995, QSO Absorption Lines, ed. G. Meylan, (Berlin: Springer), 55
- 31 Pettini M., Smith L.J., King D.L., Hunstead R.W., 1997, ApJ, 486, 665
- 32 Pettini M., Kellogg M., Steidel C.C., Dickinson M., Adelberger K.L., Giavalisco M., 1998 preprint (astro-ph 9806219)
- 33 Prochaska J.X., Wolfe A.M., 1996, ApJ, 470, 403
- 34 Prochaska J.X., Wolfe A.M., 1997, ApJ, 487, 73
- 35 Steidel C.C., Giavalisco M., Pettini M., Dickinson M., Adelberger K.L., 1996, ApJ, 462, L17
- 36 Steidel C.C., Dickinson M., Meyer D.M., Adelberger K.L., Sembach K.R., 1997a, ApJ, 480, 568
- 37 Steidel C.C., Adelberger K.L, Dickinson M., Giavalisco M., Pettini M., Kellogg M., 1997b, ApJ, 492, 428
- 38 Storrie-Lombardi L.J., McMahon R.G., Irwin M.J., 1996, MNRAS, 283, L79
- 39 Thompson D., Djorgovski S.G., 1995, AJ, 110, 982
- 40 Tytler D., Fan X.-M., 1992, ApJS, 79, 1
- 41 Vogel S., Reimers D., 1995, A&A, 294, 377
- 42 Warren S.J., Hewett P.C., Osmer P.S., 1991, ApJS, 76, 23
- 43 Warren S.J., Møller P., 1996, A&A, 311, 25
- 44 Wolfe A.M., Turnshek D.A., Lanzetta K.M., Oke J.B., 1992, ApJ, 385, 151
- 45 Wolfe A.M., Lanzetta K.M., Foltz C.B., Chaffee F.H., 1995, ApJ, 454, 698
- 46 Womble D.S., Sargent W.L.W., Lyons R.S., 1996 ‘Cold Gas at High Redshift’, ed. M.N. Bremer et al., Dordrecht: Kluwer, 249
- 47 Zheng W., Kriss G.A., Telfer R.C., Grimes J.P., Davidsen A.F., 1997, ApJ, 475, 469