Disk galaxy formation and evolution: models up to intermediate redshifts
Abstract
Making use of a seminumerical method we develop a scenario of disk galaxy formation and evolution in the framework of inflationary cold dark matter (CDM) cosmologies. Within the virializing dark matter halos, disks in centrifugal equilibrium are built-up and their galactic evolution is followed through an approach which considers the gravitational interactions among the galaxy components, the turbulence and energy balance of the ISM, the star formation (SF) process due to disk gravitational instabilities, the stellar evolution and the secular formation of a bulge. We find that the main properties and correlations of disk galaxies are determined by the mass, the hierarchical mass aggregation history and the primordial angular momentum. The models follow the same trends across the Hubble sequence than the observed galaxies. The predicted TF relation is in good agreement with the observations except for the standart CDM. While the slope of this relation remains almost constant up to intermediate redshifts, its zero-point decreases in the H-band and slightly increases in the B-band. A maximum in the SF rate for most of the models is attained at .
keywords:
cosmology: theory – galaxies:formation – galaxies: evolution – galaxies: structure1 Introduction
In the last Sesto meeting on galaxy formation and evolution in 1996, some fundamental questions concerning how do galaxies build up and evolve in a cosmological frame have been established. Probably one of the most interesting question is how do galaxies retain memory about the physics of their formation, memory that deals with their mass aggregation histories (MAHs) in a hierarchical cosmogony and with the origin of their angular momentum. This memory may represents a powerful link between the present features of the galaxies and the nature of the dark matter (DM) as well as the power spectrum and the statistical properties of its density fluctuation field (Avila-Reese & Firmani 1997). The facts that most disk galaxies have flat rotation curves, exponential surface brightness profiles, star formation (SF) histories, colors and gas fractions that correlate with the morphological type, and show a tight correlation between the luminosity and the circular velocity, point out to a common physical origin for many of their present features. Much progress has been carried out from the observational and theoretical points of views, particularly since a self-consistent scenario for galaxy formation that integrates cosmology and astronomy has appeared. However, not much progress has been attained concerning the connection between the internal physics of galaxies and the overall cosmological frame.
The current theoretical approaches on galaxy formation can be formulated on the ground of three main methods: (1) the numerical simulations, (2) the semianalytical models, and (3) the analytical models. The numerical simulations (e.g., Yepes 1997 and references therein) are the most direct way to study the complex evolution of the density fluctuations, but also, due to technical and numerical limitations, at least when including the gas hydrodynamics, this is currently the less predictive and most expensive method. The semianalytical models (Kauffmann, White & Guiderdoni 1993; Cole et al. 1994; Somerville & Primack 1998, and more references therein) are useful as a method to constrain the space of parameters which resume some ignorance about several physical processes of galaxy formation and evolution, however, they do not deal with the internal metabolism of the galactic disks. The analytical method (Mo, Mao & White 1998; see also Dalcanton, Spergel, & Summer 1997) is the most economical approach to study the global properties of galaxy populations at different redshifts. Nevertheless, this method does not deal with the evolution and physics of individual galaxies. We shall develop a method that allows to calculate the internal structure and physics of the disk galaxies that forms in the evolving DM halos, using for this aim simple self-consistent physical models implemented in a numerical code. The scenario for which this seminumerical method was developed is that of an inside-out galaxy formation where the rate of gas accretion is given by the rate of the hierarchical mass aggregation, and where the primordial angular momentum is acquired by the DM halo during its linear gravitational regime by tidal torques.
2 The physics of galactic disks in a cosmological frame
We start from the hydrodynamics of a gas and a stellar disk with axial symmetry (Firmani & Tutukov 1994; Firmani, Hernández & Gallagher 1996). The disk gas gravitational instabilities induce the SF which is self-regulated by the SN energy feedback on the ISM. A simple stellar population synthesis model is considered to account for the luminosity evolution. A secular bulge formation is introduced applying a local gravitational stability criterion to the stellar disk. The galactic evolutionary models are inserted in a cosmological background: the structure and evolution of the DM halos which surround the disks and the mass accretion rates over them are calculated from initial conditions defined by the cosmological model, which is specified by the mass fractions of the DM species (cold , hot ), the vacuum energy (), and the baryon matter (), and by the value of the Hubble constant (). With the aim to study general behaviors we shall use the model normalized to , since this model is very frequently found in the literature. In some cases we also shall present results for some of the most representative cosmologies: the (, , ), the (, ), the (, , , ), and the (, ). Where the value of is not specified it was taken equal to . A Gaussian statistical distribution with a power spectrum taken from Sugiyama (1996) and normalized to the COBE data (except for the normalized to ) characterizes the primordial density fluctuation field. The MAH of a given halo is obtained by a Monte-Carlo method applied on the conditional probability of the density fluctuation field (Lacey & Cole 1993). In this work we are interested in disk galaxies that have not suffered during their evolution a major merger able to destroy the disk. Then we have excluded from our sample haloes that in some time have collided with an other halo with a mass greater than half of its mass at that time. Starting from the linear evolution of a density fluctuation and assuming spherical symmetry we obtain the virialized halo density profile that results from the non-linear evolution of the density fluctuation. To calculate this we use a statistical approach based on the adiabatic invariants (Avila-Reese, Firmani & Hernández 1998, AFH). The non-radial component of the kinetic energy is calibrated on the base of the N-body simulations. The angular momentum of each shell is calculated assuming for the virialized structure a value of the spin parameter constant in time (in agreement with the linear theory of angular momentum acquirement, White 1994). We have assumed an average value of with a lognormal distribution. Once a mass shell is incorporated into the halo, its baryon mass fraction falls onto the disk. We assume that the disk-halo feedback is negligible and that the cooling flow does retain just a negligible amount of gas within the halo. This is consistent with the hypothesis that the SN energy feedback is mainly localized into the disk in agreement with the observational evidence. We have used a simple parametrized gas cooling mechanism into the halo in order to test the sensitivity of the results to this very complex process. The gas of the shell is distributed across the disk assuming rigid rotation of the shell, in agreement with the Zeldovich approximation, and assuming detailed angular momentum conservation during the gas dissipative collapse. Adiabatic invariants are used to calculate the halo gravitational contraction produced by the increasing gravitational field due to the disk mass growth.
3 Results
For a fixed present-day mass we obtain a large sample of possible MAHs (see fig. 1 in Firmani & Avila-Reese 1998) which after the virialization give rise to a wide range of density profiles. The average MAH produces a density profile similar to that obtained in N-body simulations by Navarro, Frenk and White (1997). However, our method gives in a natural way the statistical deviations from the average MAH, which lead to a rich variety of halo structures (AFH). The properties of luminous galaxies may depend on the features of these evolving halos because of luminous galaxies form within them.
3.1 Local properties
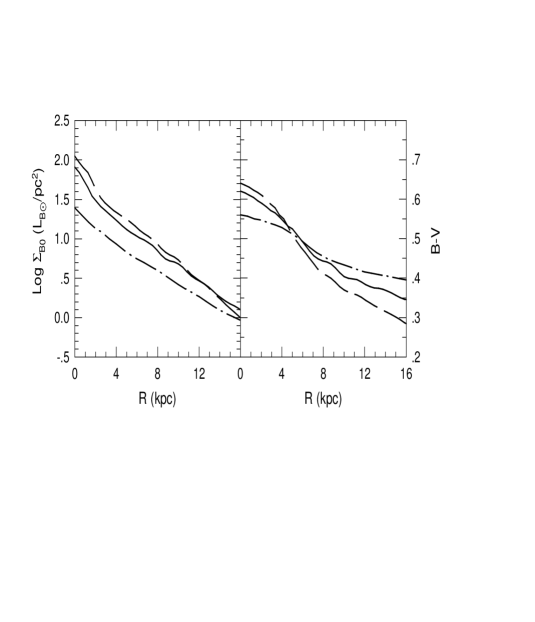
The surface density profiles of the disks in centrifugal equilibrium formed within the DM halos with the gradually infalling gas shells in solid body rotation are nearly exponential over several scale lengths (fig. 1a). Models with high angular momentum have extended disks with low surface brightness. According to Dalcanton, Summer & Spergel (1997), these models would correspond to the low surface brightness (LSB) galaxies. Observations show systematic blue radial color gradients in spiral galaxies (e.g., de Jong 1996a). Our models show a similar trend (fig. 1b), although some excessive gradient appears compared to the observations. This problem may be due to angular momentum redistribution during the gas infalling or to some inaccuracy of the simple population synthesis technique that works in our code. The former one is particularly a very complex problem that we shall explore in future works.
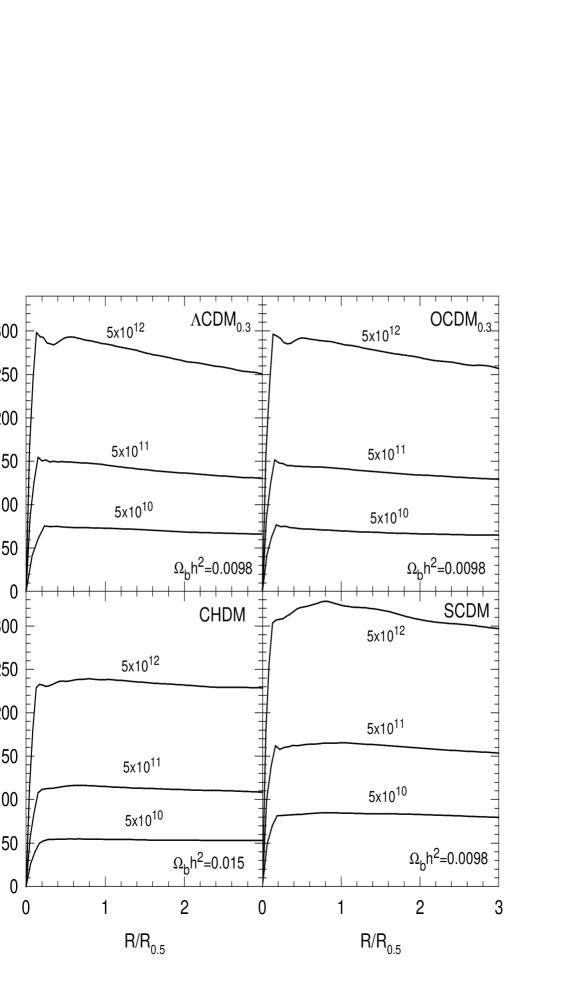
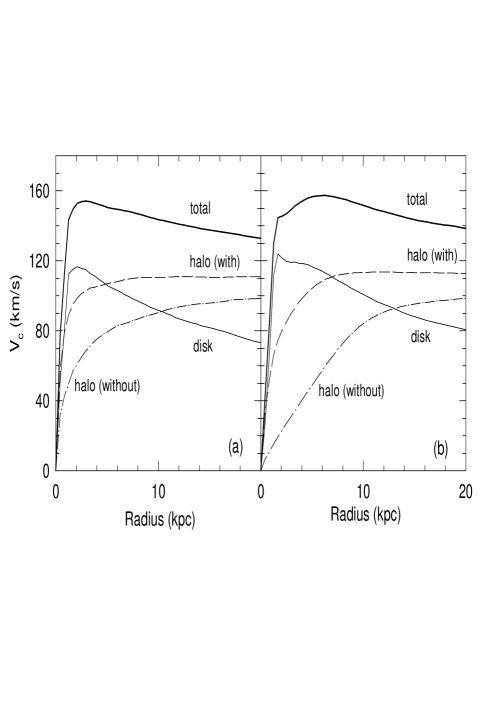
The rotation curves obtained for the average MAH and for the masses , and and for the cosmological models taken into account here are nearly flat (fig. 2). This explains the cosmological nature of the conspiracy between baryon and dark matter in the flat profile of the rotation curves. The decomposition of the rotation curve for the model with () is presented in fig.3a, where the halo gravitational contraction due to the disk is shown comparing the halo component with and without this contraction. We note here the problem already pointed out in Burkert (1995) (see also Flores & Primack 1994, Moore 1994): the gravitational contribution of the halo is dominant until the center. Even if the observational methods to decompose a rotation curve are affected by a large uncertainty, some physical process may be being misundertood here. Recent high-resolution numerical results obtained by Kravtsov et al. (1998) might be showing that the problem is not too serious, and, comparing with our results, suggest that the merging process and the slope of the power spectrum at the scale in consideration are the responsible of giving rise to shallow cores in the DM halos. If we artificially shallow the central regions of our predicted density profiles in order to be in agreement with the rotation curves of the dwarf and LSB galaxies, then the final rotation curve decomposition results more realistic (fig.3b).
3.2 Global properties
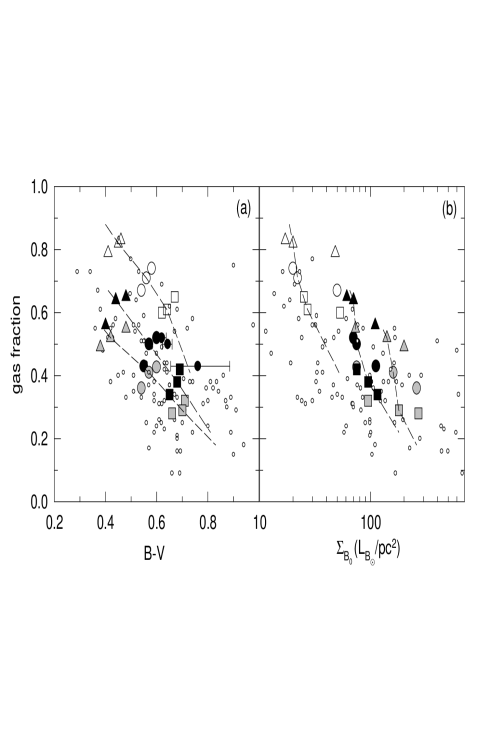
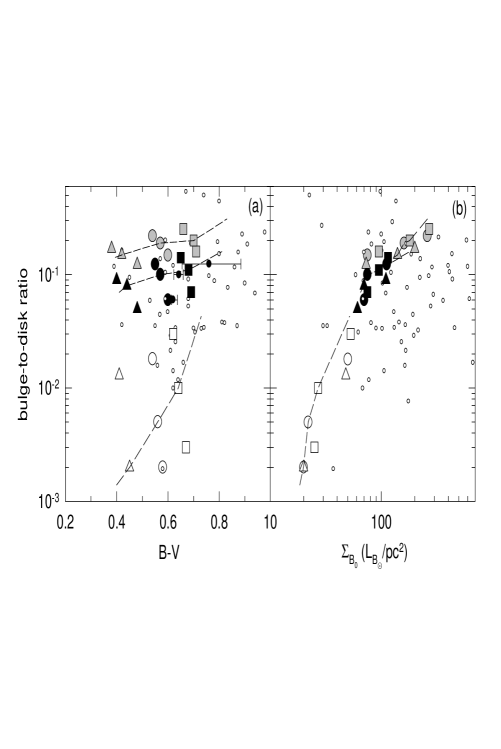
In fig. 4 and 5 we compare some global properties obtained for the model normalized to (for the other models the situation is nearly the same) with the observations. In fig. 4a and 4b the gas fraction is displayed vs. color and the central surface brightness, respectively. The data were taken from a compilation given in McGaugh and de Blok (1996) and include LSB galaxies. In fig. 5a and 5b the disk-to-bulge (b/d) ratio is displayed vs. the same variables of fig. 4. It is surprising that the b/d ratios predicted by the models using a simple gravitational instability criterion are in agreement with those inferred from observations (de Jong 1996b). Our models reproduce the observational trends across the Hubble sequence: the redder and more concentrated the disks, the smaller are the gas fractions, and the larger are the b/d ratios. The models seem to follow a biparametrical sequence, where the two parameters are the color index B-V and the central surface brightness. These two properties are mainly determined by the MAH and by the value of , respectively. The intensive global properties are almost independent on the third initial fundamental factor, the mass, which is important in defining the extensive properties (luminosity, radius, etc.).
3.3 The Tully-Fisher relation
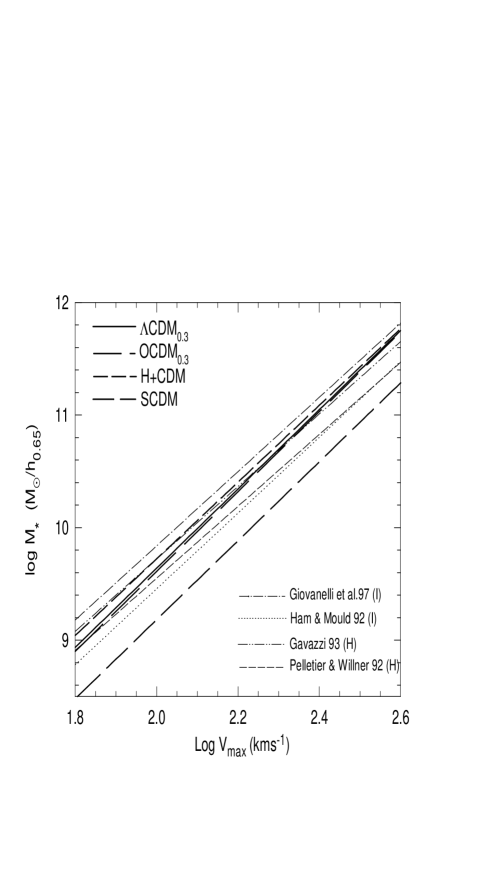
In fig. 6 we plot the stellar disk mass vs. obtained from our simulations for the different cosmological models. The observed I-band TF relation was transformed to the relation using the mass-to-luminosity radio (AFH98). For the H-band TFR we have used this mass-to-luminosity ratio is obtained from direct observational estimates in the solar neighborhood (Thronson & Greenhouse 1989). The agreement in the slope as well as in the zero-point (except for the COBE-normalized SCDM model) between the theoretical (cosmological) and empirical relations is excellent, pointing out this to a cosmological origin for the I- or H- band TF relation. The TF relation represents a fossil of the primordial density fluctuation field.
This structural relation of galaxies is mainly imprinted by the power spectrum of fluctuations, that for the CDM models at galactic scales produces a variance rather independent on mass, which implies virialized objects whose average densities are almost independent on mass , , or, that is the same, using , whose masses scale as , i.e. since , approximately . The mass-velocity relation for the DM haloes indeed scales as the velocity to 3.3-3.4 (AFH; see also Navarro et al. 1997); this relation remains almost unaltered for the luminous disks which form within the DM halos. We have explored the robustness of this result with respect to the baryon fraction and the infall dissipative processes that retain the gas in the halo. In both cases we find that the TF relation is almost not affected, mainly due to the conspiracy of the gravitational contraction of the dark halo: if the fraction of mass which goes to the disk decreases (increases), then the final rotation velocity also decreases (increases) in such a way that the mass-velocity relation remains nearly the same one. Different approaches based on numerical simulations arrive to similar conclusions (Elizondo et al. 1998).
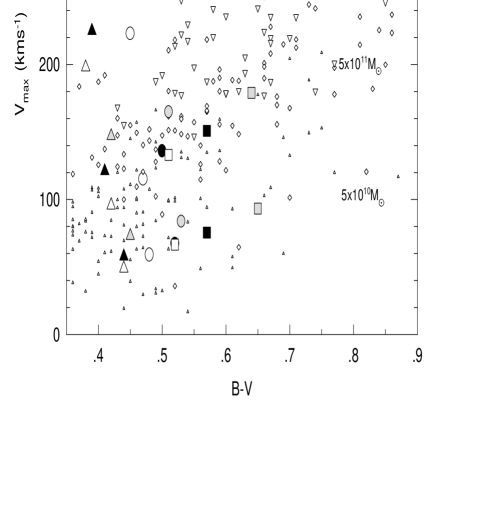
Regarding the scatter of the TF relation we find that it is produced by the dispersion of the MAHs for a given mass and by the statistical distribution of the spin parameter . As an extreme case we assume that they are independent one from another. For the , and models we predict a total scatter of 0.4-0.5 mag that is in marginal agreement with the observations. It is important to have in mind that in our models, at difference of the observational works, the LSB galaxies are included. For the models (COBE or normalized) the scatter is rather high, larger than 0.6 mag. Our models show that the scatter of the TF relation correlates with some galaxy properties. In fig. 7 it is shown how for a given mass the maximum rotation velocity does correlate with the B-V color of the galaxy. The observational data seem to follow the same trend.
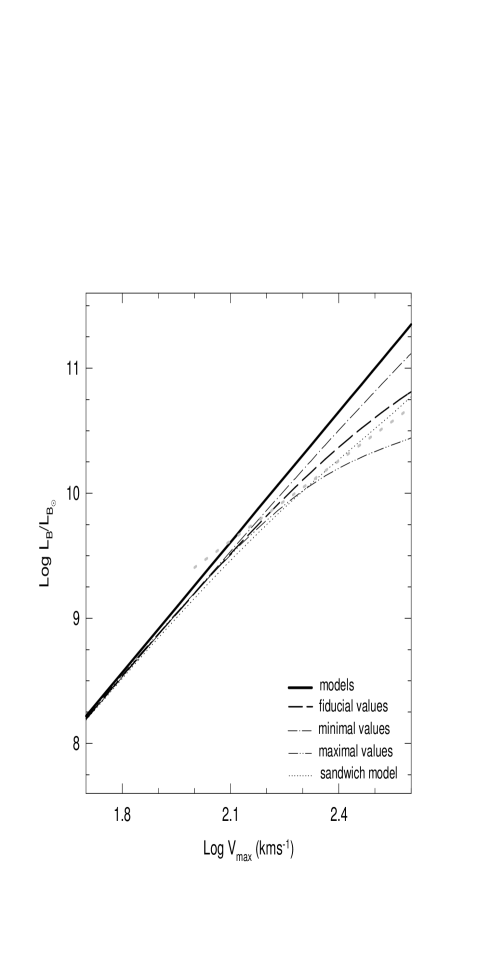
In the B-band we obtain a TF relation with slopes roughly of 3.5 for the different cosmological models. The observational data give slopes between 2 and 3. This discrepancy may be due to the extinction in galaxies and its dependence with mass. Wang & Heckman (1996), for a large sample of galaxies, have found that the dust opacity increases with the luminosity. Using the opacity-B luminosity relation they give we have “decorrected” the B-band luminosities of our models. After this the slope of the TF relation in the range is well approximated by a line with slope 2.7, i.e. the predicted TF relation now agrees with the observational estimates (see fig. 8).
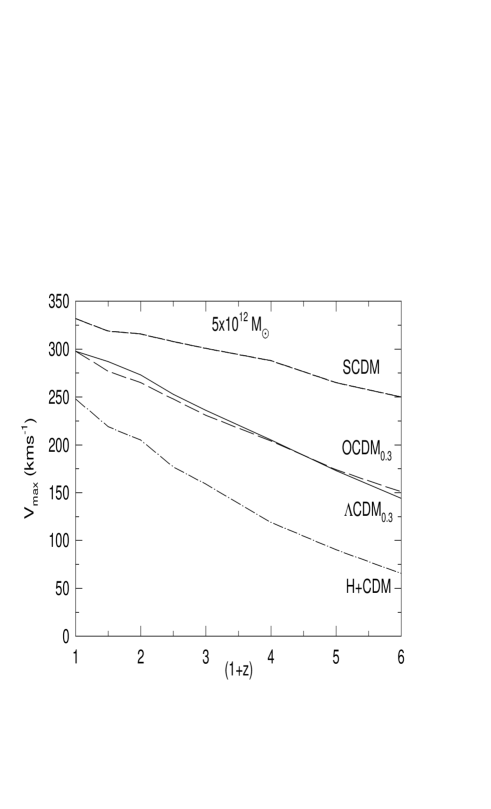
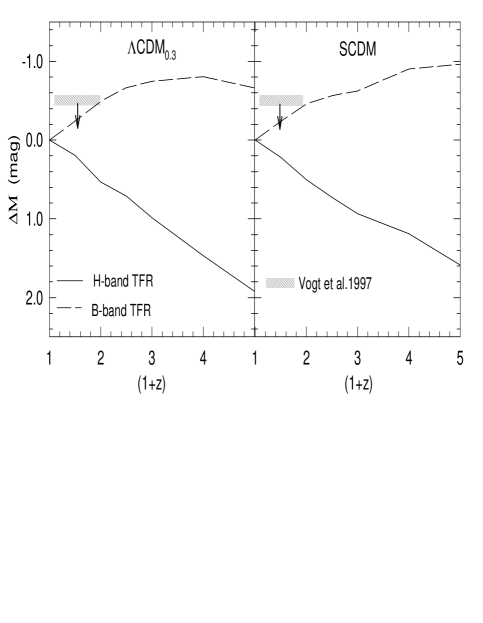
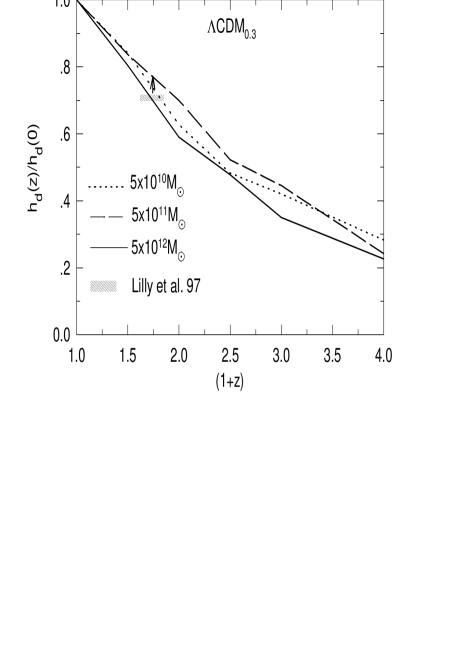
The seminumerical approach allows us to follow the evolution of an individual galaxy, then we are able to predict how a given galaxy does appear at different redshifts. Fig. 9 shows the behavior of vs. . Here we see the difficulty of to produce galaxies with high rotation velocity in the redshift range proper of the damped absorbers (e.g., Klypin et al. 1995). In fig. 10 we show our predictions for the evolution of the TF zero-point in the H and B bands (the slopes remain almost constant). The zero-point of the H-band TF relation decreases with because galaxies after reaching their maximum rotation velocity continue aggregating matter without changing this velocity. In the B-band, because the B-luminosity increases with , some compensation happens in such a way that the zero-point of the TF relation remains almost constant as deep field observations have recently shown (Vogt et al. (1997); see fig. 10). Fig. 11 displays the disk scale radius vs. (1+z). An inside-out evolution is evident.
Regarding the SF history we find that it is controlled by the gas accretion (determined by the MAH) and by the disk surface density (determined by ). For the average MAHs and the SF rates in the and cosmological models attain a maximum at depending on the mass. This rate is approximately 2-3 times larger than the present one, a result that is in marginal agreement with deep field observations of a selected population of large spiral galaxies (Lilly et al. 1998). Models with low and/or violent MAHs attain maximum SF rates that are 3-6 times larger than at the present epoch. The models show an earlier and higher peak in the SF rate. In the case of the model the SF rate peaks at redshifts smaller than 0.5 and it remains almost constant up to . It is important to remark that our evolutionary tracks concern basically to isolated galaxies, where the environment may supply any amount of gas to a galaxy according to its gravitational field. Our results are not representative of the average conditions of the universe neither of more complex situations as the case of galaxies in clusters. More work is planned in the future on this direction.
4 Conclusions
1) The seminumerical models presented in this work support the viability of an inside-out disk galaxy formation scenario, where the rate of gas accretion to the disk is dictated mainly by the cosmological (hierarchical) mass aggregation rate, and where the SF occurs in a stationary self-regulated regime within the disk. 2) The properties, correlations and evolution features of the models are tightly related to three main factors determined by the initial cosmological conditions: the MAH, the angular momentum and the mass. 3) The infrared TF relation manifest itself as a clear imprint of the power spectrum of fluctuations. The gravitational pull of the luminous matter on the dark halo makes this relation robust with respect to intermediate processes (cooling, feedback). In the B-band the luminosity dependent extinction gives rises to a decrement of the TF relation slope; this may explains the “color” TF relation of disk galaxies. 4) The scatter of the TF relation for most of the models is in marginal agreement with those derived from the observations. 5) The slopes of the TF relations do not change up to intermediate redshifts. While in the H-band the zero-point decreases, in the B-band it remains almost constant. 6) Concerning the predictive abilities of different cosmologies with respect to galaxy formation and evolution: i) , cosmologies are able to predict many of the galaxy features up to intermediate redshift. ii) is ruled out because is unable to predict the Tully-Fisher relation, and gives a too high scatter for this relation. iii) is marginal because predicts a too late galaxy formation and SF history.
References
- [1]
- [2] vila-Reese V. & Firmani C. 1997, ASP Conf. Series, 117, 416
- [3]
- [4] vila-Reese V., Firmani C., & Hernández X. 1998, ApJ, 505, 37 (AFH)
- [5]
- [6] urkert, A. 1995, ApJ, 447, L25
- [7]
- [8] ole, S., et al. 1994, MNRAS, 271, 781
- [9]
- [10] alcanton, J.J., Spergel, D.N. & Summers, F.J. 1997, ApJ, 482, 659
- [11]
- [12] e Jong, R.S. 1996a, A&A, 313,
- [13]
- [14] e Jong, R.S. 1996b, A&A, 313, 45
- [15]
- [16] lizondo, D. et al. 1998, preprint (astro-ph/9808287)
- [17]
- [18] irmani C. & Avila-Reese V. 1998, in “The Second International Conference on Dark Matter in Astro and Particle Physics”, Heidelberg, in press
- [19]
- [20] irmani C. & Tutukov A. 1994, A&A, 288, 713
- [21]
- [22] irmani C., Hernández X., & Gallagher J. 1996, A&A, 308,403
- [23]
- [24] lores, R.A., Primack, J.R. 1994, ApJ, 427, L1
- [25]
- [26] auffmann, G., White, S.D.M. & Guiderdoni, B. 1993, MNRAS, 264, 201
- [27]
- [28] lypin, A., Borgani, S., Holtzman, J., Primack, J. 1995, ApJ, 444, 1
- [29]
- [30] ravtsov, A., Klypin, A., Bullock, J. & Primack, J. 1998, ApJ, 502, 48
- [31]
- [32] udrya, Yu.N., Karachentseva, V.E., Karachentsev, I.D, & Parnovsky, S.L. 1997, Pis’ma v Astronomicheskii Jurnal, 23, 730 (in Russian)
- [33]
- [34] acey, C. & Cole, S. 1993, MNRAS, 262, 627
- [35]
- [36] illy, S., et al. 1998, ApJ, 500, 75
- [37]
- [38] cGaugh, S.S., de Blok, W.J.G. 1997, ApJ, 481, 689
- [39]
- [40] o, H.J., Mao, S., & White, S.D.M. 1998, MNRAS, 295, 319
- [41]
- [42] oore, B. 1994, Nature, 370, 629
- [43]
- [44] avarro, J., Frenk, C.S. & White, S.D.M. 1997, ApJ, 486, 493
- [45]
- [46] hronson, H.A. & Greenhouse, M.A. 1988, ApJ, 327, 671
- [47]
- [48] omerville, R.S., & Primack, J.R. 1998, preprint (astro-ph/9802268v2)
- [49]
- [50] ugiyama, N. 1996, ApJS, 100, 281
- [51]
- [52] ogt, N.P. et al. 1997, ApJ, 479, L121
- [53]
- [54] ang, B. & Heckman, T.M. 1996, ApJ, 457, 645
- [55]
- [56] hite, S.D.M. 1994, preprint MPA 831
- [57]
- [58] epes, G. 1997, in ASP Conf. Series, 126, 279
- [59]