COLLAPSARS - GAMMA-RAY BURSTS AND EXPLOSIONS IN “FAILED SUPERNOVAE”
Abstract
Using a two-dimensional hydrodynamics code (PROMETHEUS), we explore the continued evolution of rotating helium stars, M M, whose iron core collapse does not produce a successful outgoing shock, but instead forms a black hole of 2 - 3 M. The model explored in greatest detail is the 14 M helium core of a 35 M main sequence star. The outcome is sensitive to the angular momentum. For cm2 s 3, material falls into the black hole almost uninhibited. No outflows are expected. For , the infalling matter is halted by centrifugal force outside 1000 km where neutrino losses are negligible. The equatorial accretion rate is very low and explosive oxygen burning may power a weak equatorial explosion. For 3 20, however, a reasonable value for such stars, a compact disk forms at a radius where the gravitational binding energy can be efficiently radiated as neutrinos. These are the best candidates for producing gamma-ray bursts (GRBs). Here we study the formation of such a disk, the associated flow patterns, and the accretion rate for disk viscosity parameter, and 0.1. Infall along the rotational axis is initially uninhibited and an evacuated channel opens during the first few seconds. Meanwhile the black hole is spun up by the accretion (to ) and energy is dissipated in the disk by magneto-hydrodynamical (MHD) processes and radiated by neutrinos. For the model, appreciable energetic outflows develop in cones with polar angle about 30 - 45 degrees. These outflows, powered by dissipation in the disk, have energy up to a few times 1051 erg, mass 1 M, and are rich in 56Ni. They constitute a supernova-like explosion by themselves. Meanwhile accretion through the disk is maintained for at least 20 s, but is time variable (30%) because of hydrodynamical instabilities at the outer edge in a region where nuclei are experiencing photodisintegration. Because the efficiency of neutrino energy deposition is sensitive to the accretion rate, this instability leads to highly variable energy deposition in the polar regions. Some of this variability, which has significant power at 50 ms and overtones, may persist in the time structure of the burst. During the time followed, the average accretion rate for the standard =0.1 and = 10 model is 0.07 M s-1 and the total energy deposited along the rotational axes by neutrino annihilation, (1 - 14) erg, depending upon the evolution of the Kerr parameter and uncertain neutrino efficiencies. Simulated deposition of this energy in the polar regions, at a constant rate of erg s-1 per pole, results in strong relativistic outflow - jets beamed to about 1.5% of the sky. The jets blow aside the accreting material, remain highly focused, and are capable of penetrating the star in 5 - 10 s. After the jet breaks through the surface of the star, highly relativistic flow can commence. Because of the sensitivity of the mass ejection and jets to accretion rate, angular momentum, and disk viscosity, and the variation of observational consequences with viewing angle, a large range of outcomes is possible ranging from bright GRBs like GRB 971214 to faint GRB-supernovae like SN 1998bw. X-ray precursors are also possible as the jet first breaks out of the star. While only a small fraction of supernovae make GRBs, we predict that all GRBs longer than a few seconds will make supernovae similar to SN 1998bw. However, hard, energetic GRBs shorter than a few seconds will be difficult to make in this model.
1 INTRODUCTION
Despite 60 years of speculation (e.g., Baade & Zwicky 1934; Hoyle 1946) and 30 years of intensive calculation (e.g., Fowler & Hoyle 1964; Colgate & White 1966; Arnett 1967; Wilson 1971) the exact mechanism whereby the collapsing iron core of a massive star produces an outgoing shock and makes a supernova remains uncertain. Controversy has surrounded this subject since the first computer models were published in the late 1960’s (Colgate 1968; Arnett 1968). Modern calculations (Herant et al. 1994; Burrows, Hayes, & Fryxell 1995; Janka & Müller 1996; Fryer, Benz, & Herant 1996) suggest that the explosion is powered by neutrino energy deposition in a hot, convectively unstable bubble of radiation and pairs just outside the proto-neutron star. Most of these calculations show an explosion developing in two-dimensional models using approximate neutrino physics. But their success is challenged (e.g., Mezzacappa et al. 1998) and even should this mechanism work for some stars, it may fail for others (Burrows 1998; Fryer 1998), especially the more massive ones. This is because more massive stars have denser, thicker mantles of oxygen and silicon overlying the collapsing iron core. These mantles provide high accretion rates and ram pressure that are difficult for the hot bubble to overcome. For some mass of star, often speculated to be around 25 to 35 M on the main sequence (helium core 9 to 14 M), the protoneutron star accretes enough matter before an explosion develops that it becomes a black hole. After that, the compact object no longer radiates neutrinos. Such calculations are often termed “failures” by those who carry them out because they don’t get a supernova, at least not the way they expected. In this paper, lacking definite calculations, we postulate the existence of such failures and explore their continued evolution. It turns out they are not such failures after all.
Without rotation, this evolution is simple. The star falls into the black hole in a hydrodynamical time scale, carrying any internal energy with it, and simply disappears. In nature, it is doubtful that this ever occurs. The outer layers of the star, and, in at least some cases, the mantle have too much angular momentum to fall freely inside the last stable orbit. An accretion disk forms where the dissipation of rotational and gravitational energy will give rise to some sort of mass ejection and electromagnetic display, though, as we shall see, a lot of the energy may come out as neutrinos.
The study of “Failed supernovae” was initiated by Bodenheimer & Woosley (1983) and the model has been explored, in a preliminary way, as a GRB progenitor by Woosley (1993; 1996), Hartmann & Woosley (1995), Jaroszyński (1996), and Popham, Woosley, & Fryer (1998; henceforth PWF). Paczyński (1998) has discussed some of the observational consequences of the collapsar model in a phenomenon he calls the “hypernova”.
In this paper we study the evolution of such objects in much greater detail than previous works using a two-dimensional hydrodynamics code and more realistic inner boundary conditions and disk physics than, for example, Bodenheimer & Woosley. We survey the effect of different values of angular momentum and disk viscosity and also explore the consequences of energy transport from the accreting disk by neutrinos or postulated MHD effects. We start with a collapsing star removing the assumption of “stationarity” (e.g. Jaroszyński) and follow the formation of the accretion disk and it’s subsequent evolution. While our paper will focus on the evolution of bare helium stars whose iron cores collapse to black holes, there are other ways of reaching similar initial conditions, especially the merger of a black hole with the helium core of red supergiant star following common envelope evolution (Fryer & Woosley 1998; PWF) and white dwarf-black hole mergers (Fryer et al. 1998). Our model, though motivated by the desire to make a GRB, has the potential to create a strong supernova-like outburst or both. As we shall discuss (6.2), SN 1998bw (Galama et al. 1998) may have been an example.
2 THE INITIAL MODEL
Besides the prompt formation of a black hole, the other essential ingredient in our model is rotation. Specific angular momentum, , of at least a few is needed so that a disk will form well outside the last stable orbit for a black hole of several solar masses. For a Schwarzschild black hole the radius of the last stable circular orbit is cm and this orbit has specific angular momentum . The corresponding values for a rotating black hole with Kerr parameter are cm and ; for , . General expressions are given in 4.1.6.
Angular momenta of this magnitude, and more, are characteristic of current presupernova models in the mass range 10 - 20 Mand may also characterize more massive stars. Fig. 1 shows the calculated distribution of for a 20 M star evolved by Heger, Langer, & Woosley (1998). The central angular momentum is about an order of magnitude less than what one would exist had angular momentum had been conserved in the core all the way from a (rigidly rotating) main sequence model with typical observed rotation speed (about 200 km s-1). However, the calculated presupernova angular momentum in the stellar core is still about two orders of magnitude greater than observed even in fast pulsars like the 16 ms pulsar in SNR N157B (Marshal et al. 1998). Perhaps pulsars are slowed during or after the supernova explosion (Lindblom et al. 1998; Owen et al. 1998). But magnetic fields have been ignored in the Heger et al. calculations. If the helium core is braked by a magnetic field prior to the supernova explosion to the extent described by Spruit & Phinney (1998), then our model will not work for single stars. One would need to invoke the late time merger of a close binary (e.g., Paczyński 1998) or the black hole helium-core mergers discussed by Fryer & Woosley (1998). Because we are considering an event that happens at 1% of the Type II supernova rate, such rare occurrences would be acceptable.
The formation of the massive, rapidly rotating helium stars desired here is probably favored by low metallicity. Low metallicity keeps the radius of the star smaller and also reduces the mass loss. Both effects inhibit the loss of angular momentum by the star. One might then need a close binary to remove the envelope and make the assumed bare helium core (see below), but that condition is not very restrictive. The mechanism whereby helium cores (Wolf-Rayet stars) continue to lose mass after their envelopes are gone is uncertain (e.g., Langer 1989), but that too might be sensitive to metallicity. By raising the threshold for removal of the hydrogen envelope by stellar winds, low metallicity also increases the mass of the heaviest helium core one makes in a given generation of stars and thus favors black hole production.
This dependence on metallicity implies a possible evolution of GRB characteristics with red shift.
As we shall see, though perhaps less obviously, it is also important that the GRB progenitor not have too much angular momentum. For angular momenta , the accretion disk forms far outside of several hundred km in a region where neutrino losses are unimportant. Lacking this efficient means of energy dissipation, it is difficult to form a bound disk. The resulting flow patterns are different and favor outflow (4.3). Most importantly, the accretion rate into the hole is reduced. High accretion rate is essential if the burst is to be powered by neutrinos (PWF).
All stars are assumed to have lost their hydrogen envelopes. This may require binary membership for stars of solar metallicity and main sequence mass under about 30 M (though see Heger, Langer, & Woosley 1998), but for lower metallicity, the mass limit is higher. Should the star retain its hydrogen envelope, an explosion of the sort we shall describe would still develop with interesting observational consequences but, during the time the black hole accreted at a rate high enough to make a GRB, the hydrogen envelope would remain stationary. It would be difficult for a jet with a significant opening angle to retain a high relativistic while plowing though the overlying matter. Our helium cores have a radius of less than a light second and, as we shall see, a sustained relativistic jet can punch a hole through the star. This would not be the case for a star with radius 1000 light s, that is, a red supergiant. However, compact WN stars would serve our purpose just as well. A layer of surface hydrogen is allowed so long as its radius is not large. A compact star is also favored by low metallicity.
For our calculations, we use the helium cores of 25 M and 35 M presupernova stars (Woosley & Weaver 1995). These stars were evolved from the main sequence, without mass loss or rotation, to the presupernova star using the KEPLER stellar evolution code (Weaver, Zimmerman, & Woosley 1978). Since we will be interested chiefly in the evolution of the deep interior of these stars, the treatment of the surface is not so important. We extracted the helium cores of these stars as defined by the point where the hydrogen mass fraction declined below 0.01. We call this the “helium core mass”, Mα. Various calculations used different fractions of the helium core mass, but usually the whole core was carried.
For the core derived from the 25 M presupernova, Mα = 9.15 M and the iron core was 1.78 M. At the time Woosley & Weaver (1995) defined as the “presupernova” (collapse velocity equal 1000 km s-1), the radius of this core was still 2300 km. This inner boundary was moved smoothly into either 50 or 200 km before beginning our calculation. At that point, the collapse velocity, density, and assumed specific angular momentum are given in Fig. 2. See Woosley & Weaver (1995) for details of the composition which is mostly oxygen and helium.
A similar model of Mα = 14.13 M was generated from a 35 M presupernova model. The collapse velocity and angular momentum distributions were similar to the 9 M model, but the density declined more slowly with radius (Fig. 2). The mass of the iron core removed was 2.03 M. This became our standard Model 14A. Another model was explored with lower disk viscosity (Model 14B; 4.2).
Angular momentum was distributed so as to provide a constant ratio of .04 of centrifugal force to the component of gravitational force perpendicular to the rotation axis at all angles and radii, except where that prescription resulted in greater than a prescribed maximum. In most cases (all but 4.4) the maximum value of was 10. Thus in all cases the ratio of centrifugal support to gravity was small and the use of a presupernova model that had been calculated without rotation was justified. This maximum value of is consistent with the presupernova calculations shown in Fig. 1, though larger by about 50%. Since the inner 2 to 2.5 M of the star collapsed very rapidly into the inner boundary (i.e., the assumed black hole), the exact value of angular momentum there did not matter much, except as it influenced the initial Kerr parameter of the black hole. Future studies will explore the sensitivity of our results to the assumed distribution of angular momentum.
Most of our studies, including Models 14A and 14B, used a perfectly absorbing inner boundary condition at 50 km. The smaller the radius of the inner boundary, the more restrictive is the Courant condition on the time step and the more computer time one must spend to evolve to a given epoch. This radius was a reasonable compromise between what could be computed and the fact that most of the interesting physics went on inside of several hundred km. At the inner boundary pressure turned out to be about 15% of gravity, consistent with analytic models by PWF. Centrifugal forces dominate the force balance of the inner disk, which turns out to be thin because of efficient neutrino cooling. Thus the use of an absorbing inner boundary is justified.
3 THE PPM CODE AND ITS MODIFICATIONS
The presupernova models, which were already collapsing at a few thousand km s-1 at the time the link was made, were mapped onto an Eulerian grid and the subsequent evolution followed using PROMETHEUS (Fryxell, Müller, & Arnett 1989, 1991; Müller 1998), a two-dimensional hydrodynamics code based upon the Piecewise Parabolic MUSCL scheme (PPM; Woodward & Collela 1984). Axial symmetry and reflection symmetry across the equatorial plane were assumed. Spherical coordinates were employed with logarithmic zoning in the radial direction and regular zoning in . Typically 150 radial zones and 27 angular zones were used. The total number of zones was thus 4000. This relatively sparse grid was necessary because of the large number of time steps imposed by the Courant condition at small radii.
The PROMETHEUS code was modified to include a realistic equation of state (EOS; Blinnikov, Dunina-Barkovskaya, & Nadyozhin, 1996) which included a Fermi gas of electrons and positrons - with arbitrary relativity and degeneracy, radiation, and a Boltzmann gas of nuclei. The necessary Fermi integrals were done using analytic expressions that allowed a quick solution without the use of extensive tables. Coulomb corrections were included for densities above 104 g cm-3 (Shapiro & Teukolsky 1983). The KEPLER composition was mapped into nine species: neutrons, protons, helium, carbon, oxygen, neon, magnesium, silicon, and nickel. Except in regions where photodisintegration was important (see below), the original composition of KEPLER was preserved and simply advected by the hydrodynamics code. Everywhere, even in the nucleonic disk, a constant electron mole number, = 0.50 was assumed. In the inner disk electron capture may decrease . While interesting for nucleosynthesis, this detail was not important for calculating the thermodynamic properties of the disk.
Nuclear processes such as carbon, neon, oxygen, and silicon burning, and electron-capture were not followed in this first study except for one model where oxygen burning was implemented using an analytic formula (4.3). The code we constructed included a 9-isotope nuclear reaction network capable of following all these burning processes, but because of the restrictive time steps its operation imposed, it was turned off. However, the dominant nuclear energy term here is the photodisintegration of helium and heavier elements into neutrons and protons. A simplified treatment of captured the essential effects. Photodisintegration was incorporated directly into the EOS by including the the nuclear binding energy (with zero point set at pure 56Ni) as part of the energy density. Nuclear statistical equilibrium (NSE) was assumed to compute the free nucleon mass fraction at a given temperature and density (Woosley & Baron 1992):
This makes the assumption (valid at high temperature) that the time scale to reach and maintain equilibrium is much shorter than the hydrodynamical time. Each time the EOS is called with a new total energy density (thermal plus nuclear binding) and mass density, a Newton-Rapheson iteration is performed over temperature to simultaneously solve for the new thermodynamic variables (temperature, pressure, entropy, ) and the new free nucleon mass fraction. The nuclear physics was further simplified by treating only the transition from “heavy nuclei” () to free nucleons. Transitions among the heavy nuclei and from heavy nuclei to alpha-particles were neglected since roughly 90% of the energy loss to photodisintegration occurs when helium disintegrates to free nucleons. The “heavy nuclei” abundances were renormalized to make the sum of their mass fractions equal to 1 - Xnucleon each time Xnucleon was calculated.
Effects of viscosity in the disk were implemented using the alpha viscosity prescription of Shakura and Sunyaev (1973), , where is the local sound speed and , the density scale height. The full stress tensor was calculated (Tassoul 1978) and appropriate terms included in the momentum and energy equations. For simplicity, all terms in the viscous stress tensor except the terms were set to zero for these calculations. The density scale height was calculated along arcs of constant radius by determining the angular zone where the density first dropped a factor of below the equatorial value. Since the disk studied here is embedded in a collapsing stellar envelope, it was desirable to implement disk viscosity only in the regions of the simulation where the flow had become disk-like. Viscosity was turned on smoothly for zones in regions of approximate radial force balance, i.e., those which were making at least a few orbits before accreting. Specifically, was modified as follows, if abs , min , and if abs , .
Since viscous dissipation can become very large in the inner disk ( erg cm-3 s-1), viscous heating and neutrino cooling terms were included together in the energy equation. Subcycling was implemented that allowed the hydrodynamical time step to be used wherever possible. Additional constraints were set on the time step to limit the total changes in energy, temperature and abundances to less than a few percent per step. In practice however, the Courant condition was used for a majority of the time steps.
Neutrino losses in the optically thin limit were included with thermal losses (dominated by pair annihilation) taken from Itoh et. al. (1989, 1990) Neutrino emission due to pair capture on free nucleons were also included using an approximation
where K, g cm-3, and Xnucleon is the free nucleon mass fraction given above. Neutrinos from pair capture are an important energy sink in the hot, dense parts of the torus where the nuclei have disintegrated into free nucleons and are generally more important than neutrinos from pair annihilation.
Poisson’s equation for the gravitational potential was solved using an integral solver (Müller & Steinmetz 1995). For two dimensions in spherical coordinates this solver is computationally efficient using only of the computation time. The gravitational potential of the central point mass was modified to account for some of the effects of general relativity (Paczyński & Witta 1980):
where This potential reproduces the positions of the last stable circular orbit and marginally stable circular orbit and approximately reproduces the binding energy of the last stable orbit. In our calculations the inner boundary, 50 km, was always greater than Schwarzschild radii, so this should be sufficiently accurate. The point mass was increased during the calculation by the amount of baryonic mass which flowed across the inner boundary. The gravitational mass of the hole is probably smaller than the baryonic value by 5% due to neutrino emission from the inner disk. This effect was not included in computing the potential, but shouldn’t be a large effect.
4 COLLAPSE AND DISK DYNAMICS
4.1 The standard model
The evolution of Model 14A, as previously defined, was followed for an elapsed time of 20 seconds (nearly 2 million time steps). Its evolution can be considered in three stages.
First is a transient stage lasting roughly 2 seconds, during which low angular momentum material in the equator and most of the material within a free fall time along the axes falls through the inner boundary. A centrifugally supported disk forms interior to roughly 200 km. The density near the hole and along its rotational axis drops by an order of magnitude.
The second stage is characterized by a quasi-steady state in which the accretion disk delivers matter to the hole at approximately the same rate at which it is fed at its outer edge by the collapsing star. The average accretion rate, about 0.07 M s-1, is slower than expected simply from free fall, M s-1 for = 104 g cm-3 and M = 10 M, because pressure remains important in the star even though its core has collapsed. This stage of enduring rapid accretion at an approximately constant rate is the most interesting one for making a GRB. Large energy deposition can occur in the polar regions by neutrino annihilation and MHD processes. However, as we shall see, the GRB cannot commence until the mass density in the polar regions falls below a critical value, about 106 g cm-3. The GRB producing stage, if it is going to happen, thus starts several seconds after the initial collapse and continues for at least another 15 s after which the accretion rate begins to decline. If the energy deposition by neutrinos and MHD processes occurs at too slow a rate, jet formation may be delayed until most of the accretion and energy generation is over.
The third stage is the explosion of the star. This occurs on a longer time scale and we were not able to follow it all the way. Energy deposited near the black hole along the rotation axes makes jets that blow aside what remains of the star within about 10 - 20 degrees of the poles, typically 0.1 M. The kinetic energy of this material pushed aside is quite high, a few erg, enough to blow up the star in an axially driven supernova. Additional energy is deposited by viscous processes, presumably MHD in nature, in and above the disk. This also gives high ejection velocities to larger amounts of mass at larger angles (4.1.5). During the tens of seconds that it takes the star to come apart, if energy input continues at their base, the relativistic jets created in the deep interior erupt from the surface of the star and break free. Their relativistic rises. They then travel hundreds of AU’s before making the GRB.
We now consider each stage in greater detail.
4.1.1 Disc formation
All gas with angular momentum less than the Keplerian value at the 50 km inner boundary, , can fall uninhibited through the inner boundary at polar angle , though for angular momenta larger than the last stable orbit (4.1.6), a disk may still form interior to that boundary. As soon as gas with larger reaches the inner boundary, a centrifugally supported torus starts to form with a surrounding accretion shock. Fig. 3 shows this accretion shock at a time, 0.751 s, when it is moving out rapidly in both mass and radius. Later it becomes more spherical. Here centrifugal force balances gravity at about 200 km. The temperature and density interior to the accretion shock are K and g cm-3. At these temperatures the accreting gas, mostly oxygen and silicon, photodisintegrates into free neutrons and protons (Fig. 4). The neutrino emission, which outside the photodisintegration region is dominated by pair annihilation, is greatly enhanced in this inner region by the capture of abundant electron-positron pairs onto neutrons and protons. For all densities encountered on our grid in Model 14A (but not Model 14B) the gas is optically thin to neutrinos and the neutrino emission was treated as a local energy loss (though see 4.1.7).
After two seconds, phase 1 is ending. The accretion shock has moved out to 8,500 km and is roughly spherical. The temperature behind this shock has declined to K and photodisintegration there has ceased. However, a second accretion shock now bounds the disk at 250 km. Partial photodisintegration occurs at about 1000 km due to adiabatic compression, but most of the energy is absorbed as full photodisintegration occurs in the disk shock (though see 4.1.4). The polar accretion velocity is approaching (the free fall speed) at 60 km, but the equatorial density is already three orders of magnitude higher ( g cm-3) and accretion through the equator dominates the total accretion rate even though the equatorial accretion velocities (20,000 km s-1) are seven times smaller.
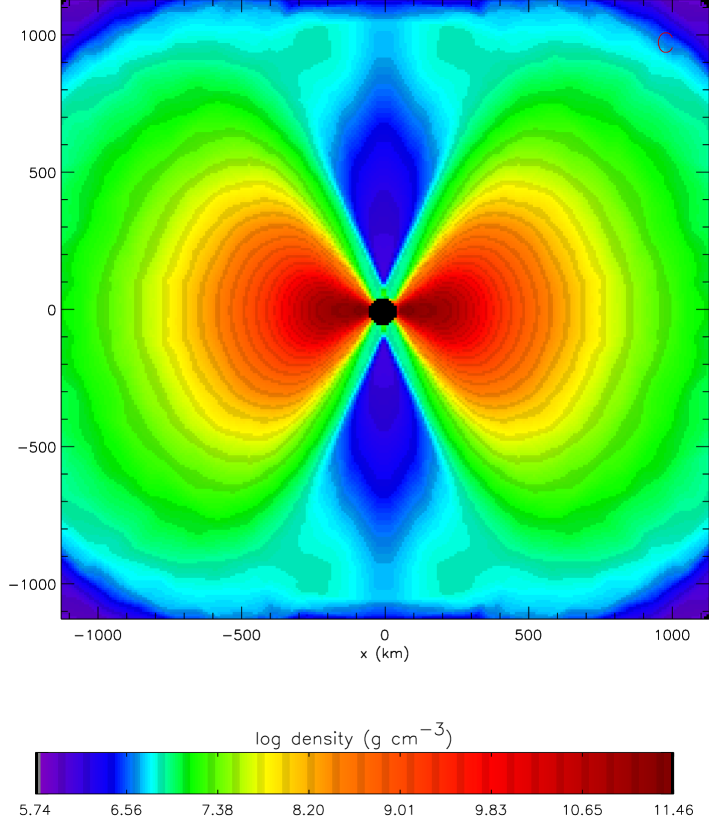
This large density contrast which has already begun to develop between the poles and the equator is very important for the viability of the collapsar as a GRB model. Subsequent evolution increases this contrast (Fig. 8). This hourglass geometry is quite favorable for the geometrical focusing of jets.
4.1.2 The steady state disk
After a few seconds, a quasi-steady state exists for the accretion disk. Matter supplied through an accretion shock at about 200 - 300 km is transported by viscous interaction to the inner boundary at about the same rate at which it passes through the shock (Fig. 5). Interesting deviations from this steady state exist outside the inner accretion shock, but the disk responds promptly to these variations and between 50 and 200 km, mass flux is very nearly constant. The steady state disk for Model 14A has a low mass, a few thousandths of a solar mass. Later we shall see that the mass of the disk varies roughly inversely with the viscosity parameter, , and can become much larger for inviscid disks (PWF and 4.2).
Figure 6 shows the physical conditions in the equatorial plane of Model 14A at a time 7.598 s after core collapse when the accretion rate is 0.12 M s-1 and the black hole mass 3.5 M. The density, temperature, rotation rate, radial velocity and angular momentum are all shown as a function of radius for the inner 10,000 km of the problem (the outer boundary of the grid was at 50,000 km). Also shown is the density scale height, H, where the equatorial density declines by a factor of . All of these quantities are compared with the semi-analytic solution of PWF. The latter is a steady-state one-dimensional ”slim disk” solution for a 3 solar mass Schwarzschild black hole (a = 0), with viscosity parameter, , accreting at 0.1 M s-1. The PWF model also included terms in the EOS to represent approximately the effects of electrons (degenerate and non-degenerate) and pairs though our EOS (Blinnikov et al. 1996) is more accurate and general. Photodisintegration and neutrino emission were treated in a similar way in both studies. However, the PWF calculation was one dimensional (the disk was vertically averaged) and assumed steady state. Its great strength was its ability to follow disks, for various choices of accretion rate, disk viscosity, and hole mass, into the deepest regions where most of the energy is released and general relativity is increasingly important, especially for rapidly rotating black holes.
The good agreement with PWF, in the region where a steady state disk ought to exist (interior to 200 km), serves to mutually validate both calculations and to verify the steady state assumption. The accretion shock is apparent in the radial velocity plot of our new results. Outside that shock, one expects and sees major differences with PWF. For example, the density plot also shows an inversion, a torus, at 200 km where infalling material piles up in the multi-dimensional study. However, the radial velocities in the disk agree very well verifying that both calculations implemented consistently. The temperature is especially well replicated as is the thinning of the accretion disk, both inside and outside the accretion shock, as a consequence of photodisintegration. The disk interior to a few hundred km has a scale height about 40% of the radius and is “slim”.
Fig. 7 shows the ratio of centrifugal force to gravity at the same time, 7.60 s, as the other plots. At 200 km a centrifugal barrier is encountered which is overshot by inertia. The pile up creates the torus seen in the density plot in Fig. 6. Interior to 200 km, the ratio is approximately 0.85, the difference being the contribution of the radial pressure gradient (and inertial terms).
The density structure at about the same time is given for the disk and immediate surroundings in Fig. 8. The maximum density - on the grid - occurs at 200 km (larger densities exist in the disk interior to our inner boundary) again showing the toroidal structure of the disk and a “pile up” effect of the infalling matter. Unlike the PWF calculation, our two dimensional study can resolve vertical density structure.
At 7.60 s the density along the polar axis is already three orders of magnitude less than in the disk. Polar accretion occurs out to polar angles of 30 degrees, but supersonic flow is limited to degrees. The rotational velocity in the disk near the inner boundary is also about . In the polar column, temperature rises to K at a density of g cm-3. Implosive heating would lead to oxygen burning, but probably not silicon burning. In the disk however, temperatures are so high () that, as previously noted, the composition is free neutrons and protons. In the polar region the neutrino luminosity is erg cm-3 s-1; in the disk near our inner boundary it is erg cm-3 s-1. Viscous dissipation in the disk is giving a few erg cm-3 s-1, several times the rate at which neutrinos can carry it away. The disk is advection dominated.
At the same time, a plot of Mach number (Fig. 10) shows very supersonic accretion flow (Mach number greater than 10) along the pole and the existence of two accretion shocks (1200 km and 200 km) in the equator modulating the flow into the inner disk. Supersonic outflow exists at intermediate angles due to viscous heating in the disk (4.1.5).
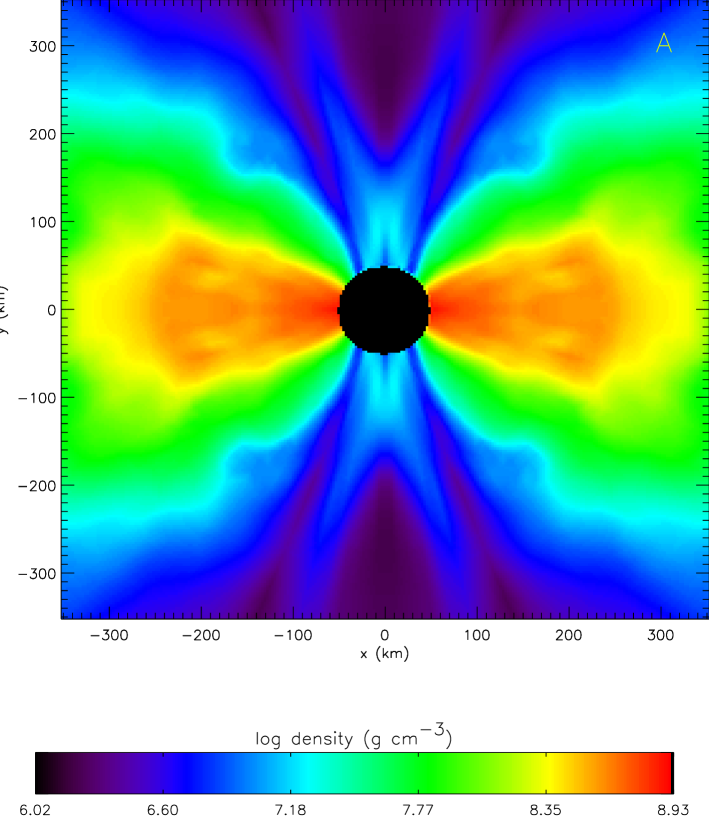
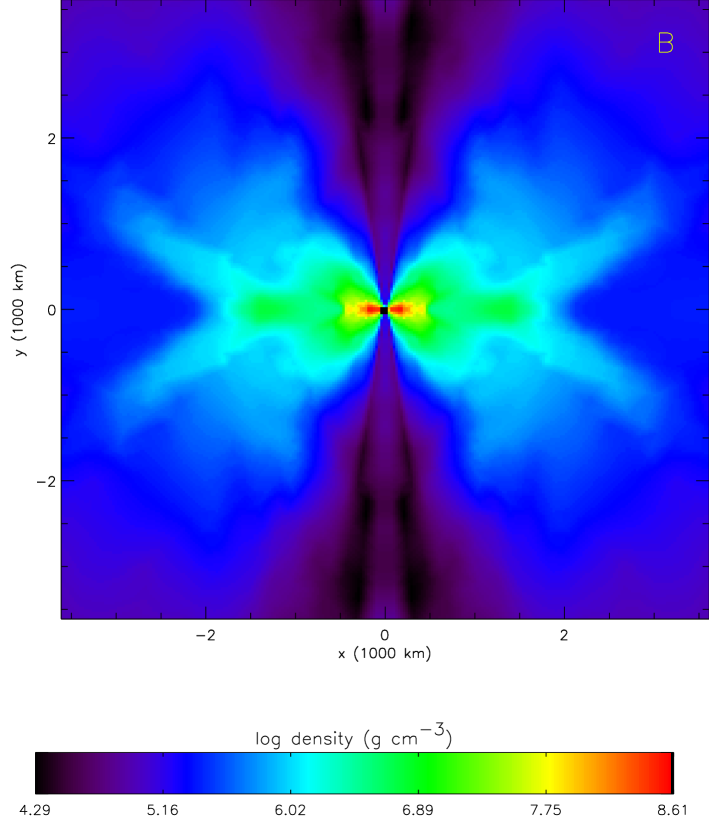
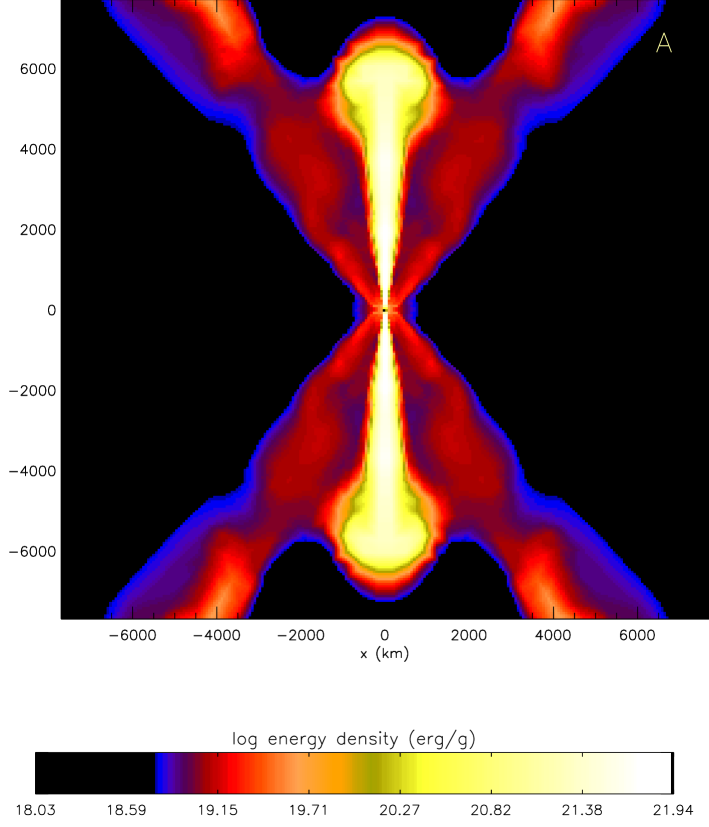
If energy deposition from neutrino annihilation is neglected the polar region continues to fall in and become more evaculated. Fig. 9 shows the density structure at a late time (15.63 s) and on a larger scale (4000 km is about 10% of the entire star). The inner disk is not resolved in this plot but the large density contrast between pole and equator is still apparent and extends to large scales.
4.1.3 The mass accretion rate
Initially the hole accretes rapidly at all angles as the star collapses through the spherical inner boundary. After roughly 2 - 3 s though, the disk has formed and it makes some sense to speak of a disk accretion rate. Still one must continue to follow separately the accretion that occurs along the rotational axes and that which comes in through the disk. In practice, for Model 14A, accretion from angles less than 45 degrees above and below the equator can be considered “disk-fed”.
Fig. 11 gives that disk accretion rate for the entire duration of Model 14A. The average rate from 5 to 15 s is about 0.07 M s-1, but there is rapid time variability with episodes of accretion as low as 0.04 M s-1 and as high as 0.12 Ms-1. Fig. 11 shows an expanded version of one of the enhanced accretion events. The dots on the figure indicate a spacing of 1000 time steps. Despite the ragged appearance of the long duration plot, the temporal structure is very well resolved on the computer (although the accretion rate, even in the expanded version, was only sampled every hundred time steps, i.e., about once per millisecond).
The angular dependence of the accretion rate is shown in Fig. 12 during the same transient high value as in Fig. 11. The near agreement of the rates for 45 degrees and 90 degrees (i.e., the total accretion rate) shows that over 90% of the accretion is occurring thru the disk. However the disk does have some thickness as the different value for 22.5 degrees indicates.
4.1.4 Accretion flows and time variability
In order to better understand the nature of the accretion and its temporal variability, the sequence of models calculated during the onset of the mass accretion spike near 7.60 s was singled out for careful study. During this spike, the mass accretion rate more then doubled in 58 ms from 0.055 M s-1 at s to 0.12 M s-1 at s. This interval was covered by over 5000 time steps in the simulation.
Figs. 13 and 14 show the surface density (density integrated along one density scale height), radial velocity, and nucleon mass fraction in the equatorial plane, and accretion flows during the “low” (7.540 s) and “high” (7.598 s) accretion states. Since the surface density and velocity external to 1000 km are both constant, the accretion rate at that radius is constant. The modulation is occurring interior to 1000 km. Fig. 5, evaluated at these same two times, shows a phase lag in the accretion rate. When the accretion rate is high in the inner disk, it is low outside of 400 km and vice versa.
The disk apparently has an unsteady boundary. The location of the accretion shock moves from 800 km (low state) to 400 km (high). As the shock moves in, the velocity just inside the shock changes from positive to negative and the surface density, which had been increasing, spills into the inner disk. Thus the high accretion rate is a result of - or at least correlated with - the collapse of the accretion shock. The time scale for this happening is roughly the mass of the disk, 0.003 M, divided by the accretion rate, 0.1 M s 30 ms. This is also the radial diffusion time scale for the disk and is obviously viscosity dependent.
But why should the location of the shock be unstable? We believe that it is because of photodisintegration. In the low state, the temperature just behind the shock is not sufficient to cause total photodisintegration. Intact matter accumulates. But at some point enough piles up that photodisintegration happens and, since the disk is partly supported by pressure (but mostly centrifugal) forces, the disk collapses into a state where photodisintegration is essentially coincident with the shock. The disk seems to make sporadic, irregular transitions between these two states. However a Fourier analysis deconvolution of the accretion rate (Fig. 15) shows significant power at 50 and 25 ms. This is approximately the viscous time scale of the disk and its first overtone. There is also significant power at other frequencies. The mass of the disk, the mass of the hole, the accretion rate, even the viscosity as formulated here are all changing with time. But the fact that significant power exists on a disk diffusion time is suggestive, if not proof, of a real physical instability at work. Clearly this is a subject that needs further study.
4.1.5 Viscous induced outflows
While the dominant flows are polar and disk accretion, there are also significant outflows. Viewed on a larger scale Fig. 16 shows plumes moving out at polar angles degrees. These flows are only present in calculations where the disk has appreciable viscosity (see 4.2 for a low viscosity case where these outflows are absent). They originate at 100 km as material as material between and and two density scale heights above the disk is heated by viscous interaction resulting from a large rotational shear. The entropy of this material rises (Fig. 17) and a wind is driven off the disk. The path of the ejected mass is highly constrained. The equator is blocked by the disk and the polar regions by a transverse accretion shock. The outflow follows the path of least resistance along the outer boundary of the shock. Over a period of roughly 15 s, several times 1051 erg are deposited in these outflows (Fig. 18). This is roughly 2% of the energy dissipated on our grid. A significant portion of this energy comes from nuclear recombination.
However, the energy in these plumes is quite sensitive to how the (artificial) disk viscosity is treated and, in particular, to the value of adopted in the regions where the heating occurs. The figure shown is for a calculation where the viscosity was calculated using . Another calculation, which assumed perhaps more correctly that , with , the density scale height gave about half as much energy to the plumes. In practice this amounts to using a larger value of in the latter expression.
The plumes (or wind) are thus artificial in the sense that they are generated by an “artificial viscosity”. But the dissipation modeled by may have a real physical origin - magnetic energy dissipation in and above the disk. Very roughly the MHD flux from the disk is a small fraction, say 1 - 10%, of the magnetic energy density in the disk, , times the Alfven speed, about the speed of light in the inner disk. The field itself might have an energy density 10% of . Then for density g cm-3, cm s-1, and a disk area of 1013 cm, the MHD energy input is erg s-1.
The matter that is ejected has mostly been at high temperature,, and is initially composed of nucleons. As these nucleons reassemble in nuclear statistical equilibrium, and provided remains near 0.5, the freeze-out composition will be dominantly 56Ni. The flows approach the surface with speeds in excess of 30,000 km s-1 and may be very important in understanding the SN 1998bw phenomenon. The accretion disk is not disrupted by these flows. Accretion continues even as the star blows up at angles above 45 degrees. Several solar masses remain at this point outside the disk in the equatorial plane.
4.1.6 The evolution of the Hole Mass and Kerr parameter
As the black hole accretes, both its mass and angular momentum grow. The hole might be born without rotation, but more realistically, had some initial angular momentum, that is a normalized Kerr parameter, , that was significantly greater than zero. The angular momentum in the iron core of the presupernova star (Fig. 1) corresponds to . This is also a reasonable value if the black hole forms from a contracting proto-neutron star born at near break up. In what follows, we will consider both and = 0.5 as interesting cases, though ainit = 0.5 is a choice more consistent with the angular momentum distribution assumed for the mantle.
The initial gravitational mass of the black hole is also relevant; a lighter hole can be spun up more easily. The contracting protoneutron star that made the black hole radiated some portion, as much as 30%, of its rest mass as neutrinos before the collapse became dynamic. This fraction is uncertain and depends on the entropy of the neutron star as well as the EOS. Here we make the conservative (for making a GRB) assumption that the black hole mass is initially the baryon mass of the iron core that is removed - 2.03 M.
The material that falls into the hole mostly accretes in the equatorial plane from a nearly Keplerian orbit. The contribution of pressure in the inner disk is about 15% (Fig. 7) and even material coming in from high latitude has so much angular momentum that it cannot go directly into the hole. The inner disk is also slim (Fig. 6).
Since we have not carried the inner disk on our numerical grid, analytic models have to be used to specify the rate at which gravitational mass and angular momentum are added for a given baryonic accretion rate. Because the results are sensitive to them, the evolution of the Kerr parameter and gravitational mass were computed using three different models to extend our inner boundary at 50 km (, where km) to the event horizon at 2 for a Schwarzschild hole () and at for an extreme Kerr hole (). Fig. 19 shows the evolution of and for the limiting assumptions of 1) a “thin” disk in which all heat generated by viscosity and compression is assumed to be radiated away (Bardeen, 1970); 2) an advection dominated accretion disk (ADAF) in which no heat escapes,all is advected into the hole with the accreting gas (Popham & Gammie, 1998); and 3) the intermediate case of a neutrino dominated disk which radiates part of its heat and mass as determined by the appropriate neutrino emission processes (PWF). Presumably this last case is the most realistic.
For the ADAF and neutrino dominated disks, the gravitational mass and angular momentum of the black hole were calculated by multiplying the mass accreted through our inner boundary each time step by the energy per unit rest mass () and angular momentum per unit rest mass () (both functions of the Kerr parameter a) at the event horizon. For the “thin” disk, the values for and at the last stable circular orbit were used. This makes the assumption that the disk interior to our inner boundary is capable of transporting the mass delivered to it to the event horizon. The fact that the disk interior to about 200 km does smoothly transport the mass it receives from the star gives us confidence that this is a good assumption. For the hole mass, the accretion through all polar angles was used while for the angular momentum only mass accreted within of the equator was used. In practice, this choice has very little effect on the calculated quantities since most mass is accreted within of the equator.
For the thin disk, the energy and angular momentum at the last stable circular orbit () are given by Bardeen (1970) and Bardeen, Press, & Teukolsky (1972)
where , is the gravitational mass of the black hole and is the gravitational radius, , and
with
and
The corresponding energy per unit mass at the last stable orbit is
Because the “thin” disk rotates at the maximum (Keplerian) rate and radiates away the entire binding energy of the disk gas it results in the highest and the lowest .
For the ADAF, we used the specific angular momentum at the event horizon of Popham & Gammie (1998) () while the energy per unit mass is simply since the entire mass-energy of the gas is assumed to accrete into the hole. The ADAF solution produces the largest hole mass and lowest because the full rest mass is accreted (no energy escapes) and because non-negligible radial pressure gradients in the disk result in significantly sub-Keplerian (by as much as 27%) angular momentum in the accreting material.
The values of and at the event horizon for the neutrino dominated disk were interpolated in from the , s-1, results of PWF and were provided by Popham (private communication). Since these disks only radiate a fraction of their binding energy, they are intermediate between the ADAF and the “thin disk”. The “standard” disk of PWF radiates less than half its binding energy at , but the radiative efficiency increases with and the inner disk becomes thinner. For the disk radiates its binding energy efficiently and therefore produces and similar to the “thin” disk.
As approaches unity the rotational energy in the hole also becomes enormous erg. Extraction of even a small fraction of this energy by MHD processes (e.g., Blandford & Znajek 1977; Katz 1994, 1997; Mészáros & Rees 1997) will dominate even over the large energies we now compute for neutrino mediated energy transport.
4.1.7 Estimated neutrino luminosity and energy deposition
One of the useful implications of the good agreement of our model with that of PWF, in the inner regions where the disk is steady state (Fig. 6), is that their solution can be used to extrapolate our own to the event horizon. In particular, we can use their estimates of total neutrino luminosity (as opposed to the small fraction we calculate on our grid, e.g., Fig. 18), and their neutrino annihilation efficiency as a function of accretion rate, Kerr parameter, and black hole mass. In what follows we assume a disk viscosity parameter = 0.1. Extrapolation to other values follows using PWF. Because the PWF tables are sparse for black hole masses other than 3 M, because the neutrino luminosities and efficiencies are not rapidly varying with hole mass, and because our black hole mass stays at all times within 50% of 3 M, we also assume a constant value of black hole mass equal to 3 M (Fig. 19).
PWF showed that the efficiency for neutrino emission and energy deposition along the rotational axes is very sensitive to both the accretion rate and the Kerr parameter. Table 1, extracted from their work and amended by additional calculations performed by Popham & Fryer specifically for the collapsar model, gives some key quantities for our range of accretion rates and Kerr parameters.
One sees, as also noted by PWF, a transition in disk behavior for M s-1. For lower accretion rates, the disk is increasingly advective. Energy dissipated in the disk is carried into the hole and not effectively radiated in neutrinos. At higher accretion rates, both the neutrino luminosity and the efficiency for neutrino annihilation increase sharply. The efficiency depends quadratically on the luminosity and also on the neutrino temperature, both of which are higher in the high case. These quantities also increase very sharply with Kerr parameter, . As becomes larger (Fig. 19), the last stable orbit moves in. Emission from the higher gravitational potential increases both the luminosity and the temperature and also makes the density of neutrinos higher because of the more compact geometry.
A full calculation of the neutrino transport in the situation considered here is a formidable problem, rivaling, perhaps exceeding that of a neutrino powered supernova of the ordinary variety. For the most part, the disk is optically thin, but especially in the high Kerr parameter cases of greatest interest, it is becoming grey. This violates one of the key assumptions of PWF. Also the trajectories of the neutrinos are not straight lines (see Ruffert & Janka 1998), but follow geodesics. We have had to make a number of approximations to translate our mass accretion histories into energy deposition efficiencies.
First, red shifts are included in the PWF calculations by keeping track of the gravitational potentials where neutrinos are emitted and absorbed. But the neutrinos are assumed to go in straight lines, not follow geodesics. This may not be too bad an assumption (Ruffert & Janka 1998) for , but becomes increasingly suspect at small radii as approaches 1. For the particular study here, Popham and Fryer calculated two cases for each value of accretion rate and Kerr parameter. We shall refer to these as the “conservative” and “optimistic” cases - though various people may have different views regarding these terms. For the conservative case, all neutrino emission and all neutrino annihilation are neglected if the emission or absorption occurs within two event horizon radii of the origin. This makes little difference for the case, but for , the reduction in energy deposition can be appreciable (Table 1). Neutrino annihilation within one scale height of the disk is also neglected. Further, in any region where the neutrinos might be considered “trapped”, the flux out of the disk is set to zero. This trapping decision is made based upon the neutrino diffusion time, as determined by the disk thickness, density, and temperature, compared to the local accretion time scale, . The optimistic case makes similar assumptions about the annihilation region - a disk scale height is excluded, a region of two event horizons is excluded - but luminosity from neutrinos all the way down to the last stable orbit are included. This is particularly important when the Kerr parameter is large.
We then calculated the neutrino luminosity and energy deposition by neutrino annihilation for Model 14A by (logarithmic) interpolation in Table 1. Consistent with our desire to set reasonable upper and lower limits, we considered both the “conservative” and “optimistic” neutrino transport approximations and also black holes born stationary and with = 0.5. Fig. 20 shows both the neutrino luminosity (chiefly neutrinos from pair capture on nucleons) and the energy deposited for a typical case in which the conservative neutrino transport scheme was employed and the initial rotation of the hole was = 0.5. Fig. 21 shows the integrated luminosity and energy deposition for four cases. For the optimistic case, the total energy was erg and would clearly have been greater had we followed the calculation further. For the most conservative case of an initially non-rotating black hole and restricted neutrino transport, the energy fell to erg.
We feel that the “optimistic” curves are realistic, but need a more careful treatment of the neutrino physics before fully trusting them. It should be noted however, that even the optimistic curves may underestimate the total energy available from the collapsar model. A sustained accretion rate above 0.1 M s-1 (instead of the average here - 0.07 M s-1) gives a much higher energy. Multiplying the accretion rate by 1.5 in Model 14A for example and using = 0.5 gives total energies after 20 seconds of erg (conservative) and erg (optimistic) respectively (however, the black hole mass was not increased in a manner consistent with the higher accretion rate in this example. It is thus a slight overestimate of the increased efficiency). Such an increase in accretion rate might be easily achieved in a star of higher mass, lower angular momentum, or different disk viscosity. Decreasing the initial mass of the black hole because of neutrino mass loss in the protoneutron star can also raise the numbers. More massive stars might also deliver energy 1051 erg s-1 for considerably longer than 20 s.
One also sees very significant variability in the neutrino energy deposition (Fig. 20). This is because of the time varying accretion rate (Fig. 11) and the sensitivity of the neutrino efficiency to accretion rate (Table 1). Varying the accretion rate from 0.05 to 0.1 M s-1 will change the energy deposition by neutrino annihilation by a large factor (20 for = 0.95). Because the light (or neutrino) crossing time in the vicinity of the hole is about a millisecond, and because the matter in which neutrinos are deposited moves at about c, the jet produced by neutrino energy deposition (5) can change its energy in almost instantaneous response to the accretion rate. One thus expects a highly variable energy for the jet. The implications of this are explored in 6.1.1.
4.2 A low viscosity model
Model 14B was calculated in an identical fashion to Model 14A, but employed a much smaller disk viscosity. Indeed it was initially our intention to calculate a “zero” viscosity model for comparison to in Model 14A, but we found that all hydrodynamic codes, even PPM, have some numerical viscosity. By setting our external viscosity parameter to zero, we were able to determine the effective internal of the code itself. By comparison to density distributions in PWF, that value of is about 0.001.
Figs. 22 and 23 show the density structure and the accretion rate for this model. Because of the lower disk viscosity and the almost identical mean accretion rate (the low run actually has a little higher due to the absence of viscosity driven outflows, 4.1.5) both the density in and mass of the accretion disk are much higher. The contrast between polar density and equatorial density is correspondingly greater. At 9 s, interior to 200 km, the disk mass is 1.25 M; interior to 300 km it is 2.21 M. For Model 14A with high disk viscosity the corresponding numbers were (at 20 s) 0.0016 M and 0.0033 M. For disk masses as high as 1 M self-gravity will become important and gravitational instabilities (e.g. spiral arm formation) can start to transport angular momentum in the disk. Clumpiness due to self-gravitating blobs in the disk may also lead to time structure in the accretion rate.
The time history of the accretion rate is similar to that for Model 14A (Fig. 23 Fig. 11), though noisier. It shows some time structure, but, is generally less time variable than 14A. The disk instabilities discussed in 4.1.4 are weak or absent. A Fourier analysis of the accretion rate (not shown) yields no characteristic frequencies. We also see that the outflows produced in the higher model are absent in Model 14B.
The lower temperature in the disk reduces the neutrino emission and makes it more “advective”, much less likely to power a GRB by neutrino energy deposition. On the other hand the disk goes through many more revolutions before accreting and also has a much higher energy density, . A (larger) equipartition field has more time to develop and MHD energy extraction may be more efficient (4.1.5).
4.3 A model with high angular momentum and nuclear burning
Bodenheimer & Woosley (1983) also explored a model similar to those studied here based upon the failed explosion of a Mcore. However they used a comparatively large value of specific angular momentum, namely whatever value was necessary to give centrifugal force divided by gravity = 4% at all cylindrical radii. In practice this corresponded to (compare to our standard value here, ). They also used a much larger inner boundary radius (1500 km) and experimented with a finite pressure gradient at that boundary. For such large , a centrifugal bounce and explosive oxygen burning happen at approximately the same radius where a disk might form, a few thousand km. A combination of nuclear burning and rotation thus gave a weak equatorial explosion accompanied by the synthesis of some intermediate mass elements and a little 56Ni.
We carried out a similar calculation here for = 9 M (i.e., the core of the 25 M presupernova) - but with the inner boundary moved in to 200 km. For this smaller radius centrifugal support completely dominated the force balance and a zero pressure gradient boundary condition could be used. Explosive oxygen burning and equatorial outflow were observed in the first few seconds (Figs. 24 and 25). However, since we are mostly interested here in GRBs not weak supernovae, that calculation, which posed some numerical difficulty, was halted at 6 s. The implication is though that too much angular momentum, as well as too little, can keep an optimal accretion disk from forming and inhibit the GRB phenomenon.
5 EXPLOSIONS AND JETS
Given the large energy deposition calculated for the standard model (4.1.5, 4.1.7, and Fig. 20) one expects an explosion of some sort. But will the outflow be relativistic at any angle, especially near the rotational axis, and, if so, how well collimated will it be? Can the major reservation often voiced regarding the collapsar model - the “baryon loading” - be satisfied? And will the rest of the star explode or accrete?
We deposited thermal energy along the rotational axes at a rate comparable to that calculated in 4.1.7, namely erg s-1 at each pole for a total of 1051 erg s-1. This energy was deposited by adding thermal energy uniformly in a region bounded by 50 km to 150 km above and below the black hole for a range of polar angles 0 to 30 degrees.
However, we did not begin this energy deposition immediately. It is not possible to produce a strong outflow very early when the momentum of the infalling material along the axis is too high. At s for example, the density of the infalling material is 107 g cm-3 and its velocity, cm s-1 corresponding to a kinetic energy influx of erg s-1 where is the cross sectional radius of the accreting region in units of 100’s of km and , the accretion velocity in units of 1010 cm s-1. Here was approximately 0.5 (the area of our inner boundary). Unless the deposition rate is comparable to this, any energy deposited by neutrinos or MHD processes will be advected into the hole. As time passes however, the velocity remains approximately constant, but the density declines. By 7 s after black hole formation, the density has declined to g cm-3 and the accretion energy to few erg s-1. At this point energy deposition erg s-1 becomes capable of reversing the inflow.
Starting at 7.60 s in Model 14A energy was deposited as described above. The density in the accretion column had fallen to g cm-3, but there was a sharp decline to 106 g cm-3 at 200 km. It may be that explosion could have been induced at a somewhat earlier time (but no earlier than 2 - 3 s when the disk formed). The choice of 7.60 s is somewhat arbitrary. Because of the computational expense imposed by the Courant condition, we waited for a situation where the jet could clearly begin at least an initial propagation on our grid. During the next 0.45 s, no outward motion developed, but the density declined between 50 and 200 km by a factor of about 30. This led to a decrease in the ram pressure and set the stage for a velocity reversal. Only 0.15 s later, 8.20 s, the density above the hole at all distances was less than 105 g cm-3 and outward velocities had developed. A shock bounded rising material as it encountered continuing accretion. The shock at his time was located at 2500 km and highly collimated with an opening angle of 10 degrees (here and elsewhere the “opening angle” is one-half of the total angle). This implies a shock speed during this interval of at least 20,000 km s-1. The temperature at the base of this bubble was K and the density, about 104 g cm-3 corresponding to an energy density of 1022 erg g-1. Were this material to expand freely, it would already become relativistic with .
But the bubble cannot, at this stage, expand freely because the star is in the way. A channel for the radiation and pairs must be cleared to the stellar surface and this takes time. Such a clearing is possible though because energy deposition at the base continues even as the density declines. Neutrino annihilation depends only on geometrical factors, neutrino energy and neutrino luminosit, not on the local density. We continued to deposit energy at the same rate per unit volume.
It is worth noting here two shortcomings of our calculation, both of which cause us to underestimate the momentum of the jet. First, neutrino annihilation does not just deposit energy, it also deposits momentum. When a neutrino from one side of the disk meets its counterpart from the other, symmetry requires a net momentum along the rotational axis in the outgoing electron-positron pair. Since the collision angle is not large and all the particles involved are relativistic, the momentum deposited is approximately the energy deposition divided by . The amount can be considerable. An energy deposition of erg would provide enough momentum to move 0.1 M at almost 10,000 km s-1. Second, most of the mass-energy in the jet is in the form of radiation and pairs, yet, in our non-relativistic hydro-code, only baryons carry momentum. So the actual directed momentum of the jet is far greater than we calculate and it would penetrate the overlying star quicker and easier. Jets carrying radiation are “heavier”.
Still we followed our non-relativistic jet awhile longer. 0.83 s after energy deposition began (350,000 time steps, at t = 8.42 s) the shock had moved to 7000 km. Fig. 26 shows the conditions at this point. The internal energy density is roughly constant at all but very small radii and still several times 1021 erg g-1 indicating mildly relativistic matter. A plot of entropy per baryon (not shown) would look very similar to that for the internal energy per gram, but with a value behind the shock of about 104. The speed of the shock front has declined by this point to just over 10,000 km s-1, but for the reasons stated in the last paragraph we think this is an underestimate of the real value. Outflows of 50,000 km s-1 have developed at intermediate angles between the polar jet and the accretion disk. The large inversion in density at the shock is chiefly a consequence of lateral expansion behind the shock and only partly due to the snow-plowing of material just ahead of the shock. Outside of cm, the density, temperature, and pressure structures are all the same as when the jet was initiated. The pressure in the jet is high and the jump across the shock correspondingly large. The temperature and pressure can be estimated approximately from the fact that the most of the energy deposited in the simulation goes into the internal energy of the jet. Thus times the volume of the jet is about 1051 erg. The volume (of two jets) is where is the full opening angle of the jet, about 0.4 radians. Thus K and dyne cm-2. Fig. 26 shows that these are good approximate values for the temperature and pressure, but there are significant gradients in both. Fig 27 shows the structure at this time.
By 8.42 s the calculation had become unrealistic with speeds behind the jet head appreciably superluminal. It was stopped. The study needs to be done with a relativistic hydrodynamics code. Such calculations are already in progress (Aloy et al. 1999), but we can already make some observations from our preliminary study.
First, most of the energy deposited in the bubble, up until the time that it breaks out, goes into driving its expansion. Pressure and density gradients are such that the bubble remains very elongated - “focused”. When it breaks through the surface of the star, and we estimate that it will in roughly 5 seconds, the evacuated channel will make a collimated path for the unhindered escape of what is essentially a pair fireball. This beam will be relativistic and highly focused.
The work that the bubble does in expanding, essentially PdV, goes into displacing the overlying matter. This energy, which is quickly shared by a lot of matter, will power an general (albeit asymmetrical) explosion of the star. The total value can be easily calculated. It is just the rate of energy deposition at the base times the time it takes the jet to break out – roughly 3 erg. The work done against gravity is a small subtraction.
As the leading edge of the bubble/jet breaks through the surface, the escaping matter will be further accelerated by shock steepening in the density gradient. This shock break out (e.g., McKee & Colgate 1973; Matzner & McKee 1998) marks the first possible detection of the explosion even though the core collapse occurred 5 s earlier. Compared to the GRB, this prompt emission is probably faint, but some hard emission - below the pair creation threshold - may occur as the relativistic matter makes first contact with the surrounding circumstellar medium. These hard x-rays travel faster even than a = 100 jet and, by a radius of cm, lead it by 10 s. This may be the origin of hard x-ray precursors sometimes seen in GRBs.
6 GAMMA-RAY BURSTS
According to current views, the principal GRB is made either as the jet encounters roughly of its rest mass in circumstellar or interstellar matter (e.g., Rees & Mészáros 1992) or by internal shocks in the jet (e.g., Rees & Mészáros 1994). If our jet has total energy equivalent to an isotropic energy of 1053 erg and of 100, it will lose its energy after encountering M (actually this value times the beaming fraction). If the star before the explosion was losing 10-5 M y-1 at 1000 km s-1, the burst will be produced at a radius of about 1015 cm. Its duration will then be s for 100.
However, our jet is produced over a longer time than 1 s, so its duration will not be governed solely by light propagation effects, but by the time the engine operates after the polar regions have cleared, about 10 - 20 s. Moreover, ours is an unsteady jet. Thus the GRB will have time structure given not only by the circumstellar interaction, but also by any observable residuals from the unsteady flow.
6.1 Time structure
6.1.1 Internal shocks
Rees & Mészáros (1994) describe the production of a GRB by unsteady outflow. For two relativistic factors, and emitted in the jet apart, an internal shock will form at a distance , releasing a significant fraction of the energy in the jet. For the very rapid time variation in Fig. 11, especially the 50 ms power peak, and for , shocks will form at 1013 cm. This is too small a radius for high energy gamma-rays to escape without producing an optically thick fireball. Panaitescu et al. (1997) give an approximate “thinning radius”, cm, where the fireball becomes optically thin to Thomson scattering. The energy one should use in this expression is the equivalent isotropic energy, for our models. Thus the jet becomes optically thin at about cm. Time structure shorter than about 1 s will be smoothed by internal shocks happening internal to the -ray photosphere.
Interestingly the radius where one becomes optically thin and the radius where the jet encounters of its rest mass are comparable. So depending upon the actual mass loss history of the presupernova star, one may get a combination of emission from internal shocks and circumstellar interaction.
6.1.2 A precessing jet?
Woosley (1995) and Hartmann & Woosley (1995) suggested, and Portegies-Zwart, Lee, & Lee (1998) have recently explored in some detail, the possibility that some of the time structure observed in GRB light curves may be due to precession of the black hole induced by imperfect alignment of the black hole equator and the accretion disk. The gravitomagnetic precession rate of the black hole is (Hartle et al. 1986)
which for a black hole mass of 3 M, disk mass 1 M (possible only for low viscosity), and disk radius 200 km gives a period of about a second.
Larwood (1998) gives a different expression for (non-relativistic) forced precession
where = Mdisk/Mbh and is the angle between the disk and axis of the rotating hole. For disk masses 1/3 that of the hole (certainly an upper bound appropriate to low viscosity), radii of 200 km, and orbital periods 20 ms this gives precession periods of about 0.2 s provided the angle between the disk and black hole equator is significant. Since the black hole accretes most of its angular momentum from the disk we do not expect this angle to remain large, even if the black hole was for some reason born rotating obliquely (this seems unlikely). This precession of the black hole would not necessarily be strictly periodic since both the distance, b, and the mass of the disk are time variable.
Additional structure in the time history and spectral hardness of the burst would result from propagation effects. The highest material would be seen by a distant observer first even though, in a symmetric pulse, lower crossed their line of sight earlier. This would give a time asymmetry to a pulse originating from a beam that was symmetric in about its central axis.
Any effect that caused the jet to not be coalligned with the rotational axis of the star would result in much greater baryon loading and might quench the burst (and enhance the accompanying supernova).
6.1.3 A traveling hole?
The mechanism whereby pulsars receive a large “kick”, typically several hundred km s-1, during, or shortly after a supernova explosion remains uncertain. Prior to its collapse into a black hole the central object in the collapsar briefly exists as a protoneutron star - perhaps endowed with high rotation and a strong magnetic field. Appreciable neutrino emission may occur prior to collapse inside the event horizon. If for some reason that emission is asymmetric, the black hole may acquire a kick. The magnitude is presently impossible to estimate, but were it to be, e.g., 100 km s-1, the black hole would travel thousands of km during the course of its accretion - a fraction of the radius of the stellar core. The geometry of accretion and especially the focusing of the jet would be affected, probably adversely since the accretion energy would be shared by more mass. This gives yet another possibility for diversity in GRB properties.
6.2 Supernova 1998bw
SN 1998bw was an unusual supernova in many ways (Galama et al. 1998). Models that explain the observations (Woosley, Eastman, & Schmidt 1998; Iwamoto et al. 1998) require a very large kinetic energy, erg if the explosion was isotropic, perhaps less if it was not (Höflich, Wheeler, & Wang 1998). High velocities for heavy elements are required to explain the spectrum, about 1049 erg of mildly relativistic ejecta to explain the radio (Kulkarni et al. 1998a; though see Waxman & Loeb 1998), and the ejection of 0.5 M of 56Ni to power the light curve. This supernova was also accompanied by an unusual GRB (GRB 980425; Galama et al. 1998) which had only 1048erg of gamma-rays (times a beaming factor probably much less than one), lasted about 20 s, and had very little emission above 300 keV. This is about 5 orders of magnitude less energy than GRB 971214 (again depending on beaming) and other GRBs for which red-shifts have been determined. Because the burst was not unusually bright and yet so nearby (38 Mpc), there may be many more bursts like this that have gone undetected. They could dominate the GRB source distribution at sufficiently low fluence and show up as an isotropic unbounded set.
Within the context of the collapsar model, SN 1998bw/GRB 980425 was the collapse and partial explosion of a massive helium star much like Model 14A, but in which, for reasons to be discussed, the component of the relativistic jet directed along our line of sight was weak (Woosley et al. 1998). It was a powerful explosion nevertheless, probably of the same order of magnitude as the one that made GRB 971214, and certainly asymmetric. Depositing 1052 erg, by whatever means, deep inside an object as deformed as Fig. 9 will naturally lead to an asymmetric explosion with higher velocities in a smaller amount of matter along the rotational axes. But insufficient energy (or insufficient time) may have existed in SN 1998bw to make a 1052 erg jet (1.5% beaming) with .
We believe that supernovae like SN 1998bw are generic to all GRBs, but that in other GRBs with optical counterparts the event was so far away and the relativistic jet in our direction so powerful that the supernova was obscured by the optical afterglow from shock deceleration.
In the collapsar model, the supernova is powered by two sources. First, and probably most important, is the energy deposited by the jet (4.1.7; Fig. 27) as it initially penetrates the star. This energy is roughly the mass still contained within the beaming angle of the jet times the square of the velocity with which it is displaced. For Model 14A this is about 0.1 M (including both poles) times 1% to 10% mc a few erg. As this displaced material moves away, supersonically, from the rotational axes, explosive nucleosynthesis occurs in the deeper regions, producing some 56Ni to power the supernova light curve. An additional source of supernova energy and of 56Ni is the wind driven by viscous interactions in the disk (e.g., Katz 1997, represented here by disk viscosity, 4.1.5, Figs. 16 and 18). Some of this mass ejection is at high velocity, especially the closer one goes to the poles. There the velocity also increases in the steepening density gradient near the surface of the star and becomes mildly relativistic (). The circumstellar interaction of this material made GRB 980425 (McKee & Colgate 1973; Woosley et al. 1998; Matzner & McKee 1998).
After the jet breaks through the surface, if enough time and energy remain, the relativistic of the outflow increases dramatically as the flow becomes unconfined. This is the stage in which a “classical” GRB can be produced, but probably was not in SN 1998bw. Or if it was we were not well situated to see it.
6.3 GRB-971214
At the other end of the spectrum of GRB diversity we have GRB-971214 (Kulkarni et al. 1998b), roughly 105 times more energetic in gamma-rays than GRB 980425, with a harder spectrum (though similar time scale), an optical “afterglow” that did not resemble a supernova, and a much lower event rate in the universe. Can the collapsar model explain both?
We believe that the collapsar produces strong, hard GRBs like GRB 971214 only in the most extreme cases of high accretion rate and long duration - perhaps only for the most massive stars or those that have just the right angular momentum distribution. The jet must finish the evacuation of the rotational axis of the star that accretion only began. Once that has occurred, and that may take a few seconds, we speculate that a very powerful jet with low mass loading will begin to blow. Energy is not such a problem. Our standard model gives about 1052 erg (for optimistic neutrino physics) focused into 3% of the sky and a duration of 15 s. This matches the observed properties of GRB 971214 pretty well. Presumably there was also a supernova underlying GRB 971214, but it was too far away to see and fainter than the afterglow produced along our line of sight by the relativistic jet.
However, baring some selection bias in which only the most energetic spikes of an underlying enduring burst are seen, it does not seem possible for the collapsar model to produce short, hard bursts. The group of bursts with mean duarion 0.3 s (Fishman & Meegan 1995) needs another explanation. These bursts have a lot less energy than the long, complex bursts modeled here. They may be the consequence of merging neutron stars or black hole - neutron star mergers (Ruffert & Janka 1998).
7 CONCLUSIONS
We have followed the evolution of rotating massive stars in which the collapse of the iron core leads to the prompt formation of a black hole. In essence, we have attempted to answer the question “If supernovae are the observational consequence of neutron star formation, what then is the consequence of (prompt) black hole formation?” (see also Bodenheimer & Woosley 1983; Woosley 1993). We have demonstrated that the answer is “a gamma-ray burst” and perhaps, “a hypernova” (Paczyński 1998). The model that makes the observable phenomenon called a hypernova, is the collapsar.
To simplify matters and because it makes the production of a GRB easier, we have followed the evolution of bare helium cores, but our results also carry over to stars that have not lost their hydrogen envelope. Interesting phenomena await exploration there - an enduring x-ray source not of a binary nature? A Type II supernova powered by black hole formation?
Using the 14 M helium core of a 35 M main sequence star as a prototype, we have begun to explore what may be a large parameter space of mass, angular momentum distribution, and disk physics. Our preliminary results show a new kind of phenomenon, a very energetic stellar explosion of up to 1052 erg, powered by hyper-accretion into a black hole. Favorable geometry for jet outflow develops as a consequence of the stagnation of matter in an equatorial disk while matter along the rotational axes (initially) falls into the hole (see also Woosley 1993; Jaroszyński 1996). Lower mass progenitors and higher angular momenta give, in our simplest neutrino powered explosions, weaker bursts. Helium cores over 14 M and angular momenta down to half that studied here would probably give even more powerful explosions that lasted longer.
The collapsar develops a GRB in stages and it may be that the sequence does not always make it to completion. Powerful explosions may occur in which the GRB is weak or absent. The first stage is the formation of the disk and partial evacuation of the polar regions. This takes several seconds. While polar accretion continues at a high rate, a jet cannot develop. So long as the density in the polar regions exceeds g cm-3, the inward momentum ( times area) dominates any reasonable energy deposition (1051 erg s-1). Any energy added is advected into the hole and lost. After a total of about 5 s though the pole does clear sufficiently that a reversal of flow becomes possible.
The outflows that develop then have several origins. If the disk viscosity is high (), dissipation in the disk can power a very energetic “wind” (4.1.5) that is almost supernova-like in terms of mass, energy, and 56Ni content. Energy deposition by neutrino annihilation can power polar outflows, relativistically expanding bubbles of radiation, pairs, and baryons focused by density and pressure gradients into jets. Because the black hole rotates very rapidly at this point (), MHD processes may also contribute to jet formation.
Because our numerical results are congruent with those of PWF in the inner disk (Fig. 6), we were able to use their analytic models to estimate both the neutrino luminosity of our disk and the efficiency for neutrino annihilation as a function of time (4.1.7). The result depends sensitively upon the accretion rate and Kerr parameter . For reasonable, but optimistic values, the total neutrino energy emitted by the disk, during 20 s of accretion is erg (note the similarity in this energy to that emitted in neutron star formation, but the luminosity here is about 10 times less. In neutrinos, these are not the most powerful explosions in the universe, though they are the brightest in photons). The total energy deposited by neutrino annihilation was erg. For less optimistic assumptions regarding the initial Kerr parameter and the neutrino transport, the emitted energy was as low as erg and the deposited energy, erg. We emphasize that these numbers are for one particular model, not chosen to be the optimal collapsar. Larger values are possible, especially if the accretion rate is just a little higher.
We simulated this energy deposition (5) and followed its consequences. Highly focused relativistic outflow - jets - developed. After a fraction of a second, the energy to mass ratio in these jets became very large, erg g-1, corresponding to a large asymptotic relativistic factor. The problem of “baryonic contamination” is circumvented because the energy deposition blows a bubble of low density. Momentum and energy from the annihilating neutrinos continues to be deposited in this bubble even as the baryon fraction becomes small. This energy is naturally directed outwards along the axis. The head of the jet moves much slower than the matter behind it that drives it. We followed this jet through an appreciable fraction of the star’s mass and radius and saw that it maintained a collimation of about 10 degrees (half angle). Certainly this part of our study needs to be redone using relativistic hydrodynamics, but our results suggest that a sustained jet is capable of breaking out of the star in 5 s, maintaining collimation and relativistic speeds, with no great difficulty.
The jet expends a lot of energy though, perhaps several times 1051 erg, clearing a channel through the star. This energy goes into lateral expansion perpendicular to the jet. Though we did not follow the explosion long enough to see the complete disruption of the star, it is probable that the accretion in the disk will be truncated at some point as the shock warps around and ejects matter in the equatorial plane. This may not happen for 10’s of seconds though - the sonic crossing time. As the jet breaks through the surface, mildly relativistic matter is for a range of polar angles down to 45 degrees. As this matter runs into the precollapse mass loss of the star, a relatively weak, soft GRB is created (Matzner & McKee 1998; Woosley, Eastman, & Schmidt 1998). This may also be the origin of hard x-ray precursors seen in some GRB’s and of GRB 980425.
The principal GRB commences though only after the jet has broken out of the star and continued long enough to evacuate a low density channel for the relativistic plasma. This may take additional time. Altogether it might be reasonable for the GRB producing jet to commence 10 s after the black hole forms. Of course the GRB itself is made far away from the star as the relativistic plasma runs into material (or into itself) at several hundred AU (6).
An intriguing new discovery is that the disk accretion rate while the burst is being made is not steady. We calculate an accretion rate of 0.07 0.03 M s-1 for about 15 s. The variations are time resolved in the numerical study and have significant power on the disk crossing time, 50 ms, but variations on all time scales up to a few tenths of a second is seen. The disk instabilities that give rise to these variations seem to be related to the location of a region of nuclear photodisintegration just inside the accretion shock that bounds the disk (4.1.4).
Because the accretion rate our model finds is coincidentally poised on the knife edge of advective dominated and neutrino dominated disks (PWF), the efficiency of neutrino deposition is highly time variable, much more so than the small variations in accretion rate might lead one to think. On time scales of 50 ms to 300 ms the jet essentially turns on and off many times. Even these short time scales are long compared to light and sound crossing times, so the jet responds almost instantaneously. One thus expects the energy of the jet, i.e., its , to be highly time variable. Models in which the GRB is produced by internal shocks in the jet are thus favored. Some of the time structure in Figs. 11 and 20 will be washed out because of collisions in the jet interior to the gamma-ray photosphere, but some may survive to produce the complex time history on a scale of 0.1 - 1 s.
This leads us to a key difference between the collapsar model and e.g., merging neutron stars and neutron stars plus black holes. The merging compact objects release all their energy in a time of order 20 ms, i.e., short compared to the duration of most GRB’s and result in a thin shell of relativistic matter. Any time structure in the GRB longer than about 10 ms thus reflects the circumstellar (or internal shock) interaction and light travel delays. The collapsar, on the other hand, is incapable of producing events shorter than about 10 s. It ejects matter not so much as a thin shell, but more like an intermittent nozzle. Much of the time structure in the GRB light curve may reflect conditions in the engine itself (i.e., the inner disk inside 200 km). Shorter bursts can only result in the collapsar model as a consequence of “seeing the tip of the iceberg” in what is actually an enduring, albeit fainter underlying burst with complex time structure. An exception might occur if the jet here precessed (6.1.2), but otherwise the existence of short hard bursts with mean duration 0.3 s (Fishman & Meegan 1995) may require merging compact objects for their explanation (Janka & Ruffert 1996; Ruffert & Janka 1998).
We have pointed out that the total energy inferred for the brightest known GRB to date GRB 971214; about erg in gamma-rays times beaming factor) and the faintest (GRB 980425; erg) are really not that different when all reservoirs of energy are taken into account. The kinetic energy of the supernova (hypernova?) accompanying GRB 970425 was about 1052 erg (Woosley, Eastman, & Schmidt 1998; Iwamoto et al. 1998; though see also Höflich, Wheeler, & Wang 1998). With beaming, the energy of GRB 971214 was probably also 1052 erg. The difference of course was how much energy went into making gamma-rays beamed in our direction.
During its propagation through the star, the jet deposits enough energy to explode, eventually, all the star that has not already collapsed to the disk. Lacking a full special relativistic calculation of the entire event, it is difficult to say exactly how much energy this is, but rough estimates (5) give a few erg. If the jet does not stay focused in a single direction, even more energy may be deposited. Then there is the wind produced by the viscous interaction in the disk (4.1.5), also 1051 erg, plus other sources of energy (MHD) not modeled here. So the star explodes, and a total energy 1052 erg may not be unreasonable. If a powerful jet continues (and stays focused) for another roughly 10 s after it has broken through the surface then a powerful GRB like that of 971214 may result, provided we are looking straight down the jet. Events like SN 1998bw may be more common though, and may be seen even more frequently because of the larger beaming angle. And finally GRB 980425 may have been a lot brighter in gamma-rays had we viewed it more nearly pole on.
We predict that all GRB’s produced by the collapsar model will also make supernovae like SN 1998bw. This is most likely those bursts that last longer than a few seconds. For bright GRB’s like 971214, the optical afterglow from jet deceleration may obscure the fainter supernova. Only a small fraction of supernovae make GRB’s, but it may be that most GRB’s make supernovae.
This brings us to the event rate and spatial distribution of collapsars. Clearly collapsars should be directly associated with star forming regions. They are the deaths of the most massive stars and should therefore be found only where such stars are being born. We have suggested that there may be some metallicity dependence as well. Lower metallicity makes the larger helium cores needed by the collapsar model more likely and may also diminish the loss of angular momentum. Still, even where they occur, we expect collapsars to be a small fraction of supernovae (or any subclass thereof, e.g., Type Ic). This is because the required mass is high and the requisite angular momenta may not always be present. A value of a few per-cent of the supernova rate, or 10-4 y-1 in a Galaxy like the Milky Way seems reasonable. Even with beaming this would provide enough GRB’s to satisfy the observations of the bright events that dominate the BATSE statistics. The number of fainter bursts like GRB 980425 would be much larger, but a) are only a small fraction of the current BATSE data base and b) emit to a larger solid angle. A more detailed study of the event rate of this and other models is in progress (Fryer, Hartmann, & Woosley 1998).
An interesting implication of the collapsar model, if it is to explain most GRB’s, is that at least a fraction of iron core collapse events in massive stars produce a neutron star that is initially rotating almost at break up. It may be that this is the common case. If so rotation would need to be included in models for ordinary supernovae, not just those for GRB’s.
Finally, though relatively rare, collapsars may provide an important nucleosynthetic component. We have not tracked with any care the composition of the accretion disks or jets studied here, but the entropy per baryon of the jet in Fig. 26 is about 104. Smaller values will characterize the mass ejection at larger angles. Our numerical resolution was inadequate to say just how much disk material is mixed into the jet and we have also not followed the evolution of the electron mole number, , in response to electron capture in the disk. But if even 10-5 M of material with is ejected with entropies 300, the contribution to the -process would be significant (Hoffman, Woosley, & Qian 1997).
References
- (1) Aloy, M. A., Müller, E., Ibanez, J. M., Marti, J. M., & MacFadyen, A. 1998, A&A, in preparation
- (2) Arnett, W. D. 1967, Can J. Phys, 45, 1621
- (3) Arnett, W. D. 1968, ApJ, 153, 341
- (4) Baade, W., & Zwicky, F. 1934, Proc. Natl. Acad. Sci., 20, 254
- (5) Bardeen, J. M. 1970, Nature, 226, 64
- (6) Bardeen, J. M., Press, W. H., & Teukolsky, S. A. 1972, ApJ, 178, 347
- (7) Blandford, R. D. & Znajek, R. L. 1977, MNRAS, 179, 433
- (8) Blinnikov, S. I., Dunina-Barkovskaya, N. V., & Nadyozhin, D. K. 1996, ApJS, 106, 171
- (9) Burrows, A. S. 1998, in Proc. 9th Ringberg Castle Workshop on Nuclear Astrophysics, eds. E. Müller & W. Hillebrandt, MPA Report P10, p. 76
- (10) Burrows, A., Hayes, J., & Fryxell, B. A. 1995, ApJ, 450, 830
- (11) Bodenheimer, P., & Woosley, S. E. 1983, ApJ, 269, 281
- (12) Colgate, S. A. 1968, ApJ, 153, 335
- (13) Colgate, S. A., & White, R. H. 1966, ApJ, 143, 626
- (14) Fishman, G. J., & Meegan, C. A. 1995, ARAA, 33, 415
- (15) Fowler, W. A., & Hoyle, F. 1964, ApJS, 9, 201
- (16) Fryer, C. L., 1998, proceedings of the 2nd International Workshop on Laboratory Astrophysics with Intense Lasers, to appear in ApJ supplements, ed. Remington
- (17) Fryer, C. L., Benz, W., & Herant, M. 1996, ApJ, 460, 801
- (18) Fryer, C. L., & Woosley, S. E. 1998, ApJL, 502, L9
- (19) Fryer, C. L., Woosley, S. E., Herant, M., & Davies, M. 1998, ApJ, submitted, astro-ph/9808094
- (20) Fryer, C., Hartmann, D. H., & Woosley, S. E. 1998, ApJ, in preparation
- (21) Fryxell, B. A., Müller, E., & Arnett, W. D. 1989, Max-Planck-Institut für Astrophysik Report 449, Garching, Germany
- (22) Fryxell, B. A., Müller, E., & Arnett, W. D. 1991, ApJ, 367, 619
- (23) Galama, T. J., and 44 others, Nature, in press, astro-ph/9806175
- (24) Hartle, J., Thorne, K., & Price, R. H. 1986, in Black Holes: The Membrane Paradigm, eds. K. Thorne, R. Price, & D. MacDonald, (Yale Univ. Press), p. 173
- (25) Hartmann, D. H., & Woosley, S. E. 1995, Advances in Space Research, 15(5), 143
- (26) Heger, A., Langer, N., & Woosley, S. E. 1998, ApJ, in preparation
- (27) Herant, M., Benz, W., Hix, W. R., Fryer, C., & Colgate, S. A. 1994, ApJ, 435, 339
- (28) Hoffman, R. D., Woosley, S. E., & Qian, Y. Z. 1997, ApJ, 482, 951
- (29) Höflich. P., Wheeler, J. C., & Wang, L. 1998, ApJ, submitted, astro-ph/9808086
- (30) Hoyle, F. 1946, MNRAS, 106, 343
- (31) Itoh, N., Adachi, T., Nakagawa, M., Kohyama, Y., & Munakata, H. 1989, ApJ, 339, 354
- (32) Itoh, N., Adachi, T., Nakagawa, M., Kohyama, Y., & Munakata, H. 1990, ApJ, 360, 741
- (33) Iwamoto, K., and 26 others, Nature, in press, astro-ph/9806382
- (34) Janka, H.-Th., & Müller, E. 1996, A&A, 306, 167
- (35) Janka, H.-Th., & Ruffert, M. 1996, A&A, 307, L33
- (36) Jaroszyński, M., 1996, A&A, 305, 839
- (37) Katz, J. 1994, ApJ, 422, 248
- (38) Katz, J. 1997, ApJ, 490, 633
- (39) Kulkarni, S. R., Frail, D. A., Wieringa, M. H., Ekers, R. D., Sadler, E. M., Wark, R. M., Higdon, J. L., Phinney, E. S., & Bloom, J. S. 1998a, submitted to Nature, astro-ph/9807001
- (40) Kulkarni, S., Djorgoski, S. G., Ramaprakash, A. N., Goodrich, R., Bloom, J. S., et al. 1998b, Nature, 393, 35
- (41) Langer, N. 1989, A&A, 220, 135
- (42) Larwood, J. D. 1998, astro-ph/9806348
- (43) Lindblom, L., Owen, B. J., & Morsink, S. M., 1998, Phys Rev. Lettr., 80, 4843
- (44) Marshall, F. E., Gotthelf, E. V., Zhang, W, Middleditch, J., & Wang, Q. D. 1998, astro-ph/9803214
- (45) Matzner, C. D. & McKee, C. F. 1998, ApJ, in press, astro-ph/9807046
- (46) Mészáros, P., & Rees, M. J. 1997, ApJ, 482, L29
- (47) McKee, C. R., & Colgate, S. A. 1973, ApJ, 181, 903
- (48) Mezzacappa, A., Calder, A. C., Bruenn, S. W., Blondin, J. M., Guidry, M. W., Strayer, M. R., & Umar, A. S. 1998, ApJ, 495, 911
- (49) Müller, E. 1998, in Computational Methods for Astrophysical Fluid Flow, 27th Saas-Fee Advanced Course, eds. O. Steiner & A. Gautschy, (Springer-Verlag), in press
- (50) Müller, E., & Steinmetz, M. 1995, Computer Physics Communications, 89, 45
- (51) Owen, B. J., Lindblom, L., Cutler, C., Schutz, B. F., Vecchio, A., & Andersson, N. 1998, Phys. Rev D, in press
- (52) Paczyński, B. 1998, ApJ, 494, L45
- (53) Paczyński, B. & Witta, P.J. 1980, A&A, 88, 23
- (54) Panaitescu, A., Wen, L., Laguna, P., & Mészáros, P. 1997, ApJ, 482, 942
- (55) Popham, R., Woosley, S. E., & Fryer, C. 1998, submitted to ApJ, astro-ph/9807028, (PWF)
- (56) Popham, R., & Gammie, C. 1998, ApJ, in press
- (57) Portegies-Zwart, S. F., Lee, C.-H., & Lee, H. K. 1998, astro-ph/9808191, submitted to ApJ
- (58) Rees, M. J., & Mészáros, P. 1992, MNRAS, 258, 41P
- (59) Rees, M. J., & Mészáros, P. 1994, ApJ, 430, L93
- (60) Ruffert, M., & Janka, H.-Th. 1998, A&A, submitted, astro-ph/9809280
- (61) Shapiro, P., & Teukolsky, S. 1983, Black Holes, White Dwarfs, and Neutron Stars, (New York: Wiley)
- (62) Shakura, N. I. & Sunyaev, R. A. 1973, A&A, 24, 337
- (63) Spruit, H. C., & Phinney, E. S. 1998, Nature, 393, 139
- (64) Tassoul, J.-L. 1978, Theory of Rotating Stars, (Princeton: Princeton University Press)
- (65) Waxman, E. & Loeb, A. 1998, ApJ submitted, astro-ph/9808135
- (66) Weaver, T. A., Zimmerman, G. B., & Woosley, S. E. 1978, ApJ, 225, 1021
- (67) Wilson, J. R. 1971, ApJ, 163, 209
- (68) Woodward, P. R., & Colella, P. 1984, J. Comp. Phys., 54, 115
- (69) Woosley, S. E., 1993, ApJ, 405, 273
- (70) Woosley, S. E., 1995, 17th Texas Symposium, Ann. N. Y. Acad., 759, 446
- (71) Woosley, S. E., & Baron, E. 1992, ApJ, 391, 228
- (72) Woosley, S. E., & Weaver, T. A. 1995, ApJS, 101, 181
- (73) Woosley, S. E. 1996, in Gamma-Ray Bursts: 3rd Huntsville Symposium, AIP Conf. Proc 384, eds. C. Kouveliotou, M. Briggs, & G. Fishman, AIP:New York, 709
- (74) Woosley, S. E., Eastman, R. G., & Schmidt, B. 1998, ApJ, in press, astro-ph/9806299
TABLE 1
| Conservative | Optimistic | ||||||
| Lν | L | efficiency | Lν | L | efficiency | ||
| M s-1 | 1051 erg s-1 | 1051 erg s-1 | % | 1051 erg s-1 | 1051 erg s-1 | % | |
| 0.05 | 0.50 | 1.2 | 0.00023 | 0.019 | 1.6 | 0.0012 | 0.075 |
| 0.05 | 0.75 | 2.2 | 0.0012 | 0.055 | 3.6 | 0.016 | 0.44 |
| 0.05 | 0.89 | 4.3 | 0.017 | 0.41 | 8.6 | 0.18 | 2.1 |
| 0.05 | 0.95 | 7.6 | 0.061 | 0.81 | 18 | 1.3 | 7.4 |
| 0.0631 | 0.95 | 23 | 1.9 | 8.2 | 35 | 3.7 | 10 |
| 0.0794 | 0.95 | 35 | 1.9 | 5.3 | 39 | 2.1 | 5.3 |
| 0.1 | 0.50 | 6.1 | 0.0083 | 0.14 | 7.8 | 0.027 | 0.34 |
| 0.1 | 0.75 | 13 | 0.071 | 0.56 | 18 | 0.27 | 1.6 |
| 0.1 | 0.89 | 33 | 1.2 | 3.6 | 36 | 1.2 | 3.5 |
| 0.1 | 0.95 | 41 | 1.3 | 3.2 | 46 | 1.7 | 3.6 |