First Observational Results from ALFA
with Natural and Laser
Guide Stars
Abstract
The sodium laser guide star adaptive optics system ALFA, which is installed at the Calar Alto 3.5-m telescope, has been undergoing an intensive optimisation phase. Observations using natural guide stars that are presented in this paper, show that for bright stars (mV8) it is now possible to reach K-band Strehl ratios in excess of 60% and to easily resolve binaries at the diffraction limit of the telescope. In more typical usage Strehl ratios in the range 10–15% can be achieved over a wide field (2′); and the limiting magnitude is currently mV12.5. We also present some of the first spectroscopy at diffraction limited scales, showing we are able to distinguish spectra of binary stars with a separation of only 0.26′′. Our last set of results are on Abell galaxy clusters, including a correction on a galaxy using the laser guide star as the reference. There are still a number of difficulties associated with the laser, but our best result to date is of the galaxy UGC 1347 in Abell 262. Correcting tip-tilt on a star 41′′ away and higher orders on the laser, we achieved in increase in peak intensity of 2.5, and a reduction in FWHM from 1.07′′ to 0.40′′. It is expected that further significant advances will be made in the next 6 months and beyond.
1 INTRODUCTION
During the last 6 months significant progress has been made in the quality of correction that can be achieved with ALFA, even for mediocre atmospheric conditions. This is a necessity at the Calar Alto observatory since the seeing is often 1′′ or worse. For a number of observing programmes, ALFA is now able to compete effectively with other adaptive optics systems.
Some progress has also been made with the laser guide star, although this is still limited by non-ideal observing conditions, being particularly sensitive to atmospheric transmission. We have been able to close the loop on the laser and correct the field around the galaxy UGC 1347 with an improvement in both peak intensity and FWHM of a factor of 2.5. There remain two main restrictions to regular observations with the laser. One of these is the beam jitter, which can often throw the LGS spots outside the centroiding regions on the wavefront sensor. The second is the LGS size (2.5′′), the cause of which we are currently investigating; an intended fibre link to replace the beam relay between the laser and the telescope may overcome this. As well as these we are implementing automatic control algorithms for laser tuning and focussing, and also WFS focussing. These should increase the observing efficiency by a large margin.
In this contribution we present the observational results that have been obtained so far. We begin by noting in Section 2 the best performance that ALFA has achieved. In Section 3 the first spectroscopy at diffraction limited scales is presented. Section 4 continues with observations of an ′′2 field around the Herbig Ae/Be star, to look at how the correction varies at large distances off-axis. Results from an imaging study of Abell cluster galaxies are given in Section 5. We concentrate in particular on two galaxies, correcting with a nearby natural guide star on one, and using the laser guide star as a wavefront reference for the other.
2 Best Performance
During 1998 the ALFA adaptive optics hardware, software, and personnel underwent intensive optimisation and the system is now beginning to deliver the specified performances. These criteria included achieving 40% Strehl in the K-band with median 0.9′′ seeing.
For the purposes of this contribution, Strehl ratios have been calculated from the ratio of peak to total fluxes in the PSF image, by comparing it to that calculated for the theoretical diffraction limited PSF (with a 3.5 m mirror and 1.37 m central obscuration). Unless stated, they take no account of where in the pixel the PSF is centred and hence may underestimate the actual Strehl. This error is rather variable: for example with 0.04′′ pixels and a high Strehl measurement might be %, or with 0.08′′ pixels a lower Strehl measurement could be %.
For seeing of around 1′′, K-band Strehls in excess of 60% can be reached for the brightest stars (mV6), while values in the range 25–50% can be attained for stars with mV8. These results are very impressive considering that even if 32 (Zernike) modes are corrected perfectly, the residual wavefront error is rad2 giving a maximum theoretical Strehl ratio of only 65%; and this does not include bandwidth limitations, noise, or mirror flatness and other residual static aberrations. The performance can be translated to other wavebands, and we have achieved a J-band Strehl of 12% on SAO 56114 (mV=7.0), and a resolution better than 0.10′′, close to the diffraction limit of 0.07′′ FWHM.
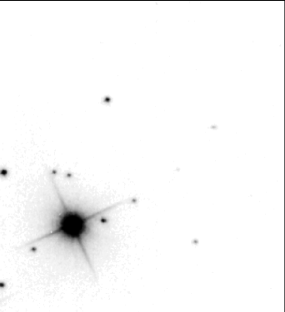
Any observation with a Strehl ratio greater than about 20% will effectively be diffraction limited. An excellent example of this is the serendipitous discovery of a double star in SAO 36784 as shown in Fig. 1, during testing of control parameters. This star is listed in the Washington Double Star Catalog (WDS, Worley & Douglass 1997) as the primary partner of a pair with separation of 20.5′′ and magnitudes mV=6.0 and 12.3; ALFA has now shown that the primary itself is double, although it is unclear whether this is a true binary system or a projection effect. The separation of the two components is 0.15′′, almost at the telescope’s diffraction limit (0.13′′ FWHM), and they can clearly be discriminated after deconvolution. The observation shows the vast potential for studies of stars in multiple systems, for determining orbits and system stability; as well as for characterising spectroscopic and speckle binaries, by measuring broad-band colours or individual spectra. An example of the latter is given in next Section 3.


3 Integral Field Spectroscopy: HEI 7
The potential for spectroscopy at diffraction limited scales represents an exciting aspect of adaptive optics. However, the inherent difficulties also make it a special challenge. Standard techniques with a longslit may no longer be feasible, since in order to make the most of the benefits of minimising both background and contamination from extended sources, the slit must be extremely narrow. Accurately positioning a target on such a slit can be very time consuming, and for faint sources this becomes impractical. The alternative method of integral field spectroscopy which involves re-ordering a 2-dimensional field onto a longslit, dispersing it, and reconstructing a datacube (2 spatial and 1 spectral axes) afterwards, opens considerable opportunities in this area.
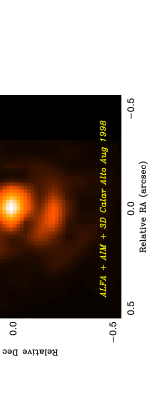
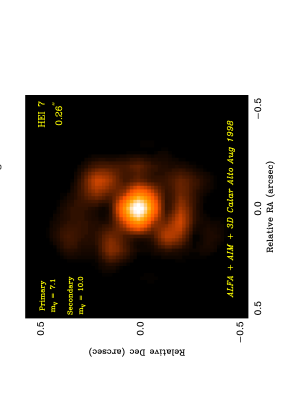
During August 1998, the MPE 3D imaging spectrometer (Weitzel et al. 1996), which obtains simultaneously H- or K-band spectra of an entire pixel field, was used with ALFA. In order to facilitate this, an aperture interchange module (AIM, Anders et al. 1998a) has been built as an interface to allow the pixel scale to be changed between 0.25′′ and 0.07′′ per pixel, as well as providing the ability for efficient sky observations with minimal overhead. Although the field of view is small (1.2′′), this is ideally matched for observations of AGN or close binaries. Here we present some of the first spectroscopy at diffraction limited scales (see Anders et al. 1998b), of HEI 7, a binary listed in the WDS Catalog. The primary, more commonly known as HD 197443, is itself a photometric/spectroscopic binary (denoted AB) with a period of about 6 hrs and has not been resolved. A third member of the system (denoted C) was suspected from variations in the time of minimum in the primary pair, and its orbit was first calculated by Hershey (1975) from changes in parallax of the primary with respect to a set of reference stars (later confirmed by observation). The data yielded both the parameters of the AB-C 30.5 yr orbit as well as the absolute parallax, which sets the distance as 24 pc (ie the current projected separation is only 6ȦU).
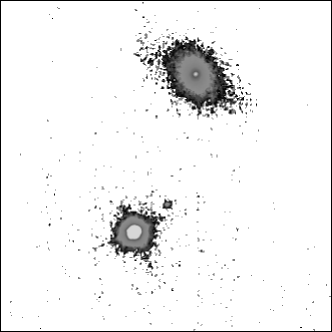
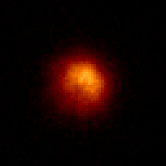
A PSF reference (HD 183051, left in Fig. 2) with the same mV=7.1 as the primary component of HEI 7 was observed 10 minutes before the binary using the same adaptive optics parameters. Although the first diffraction ring was complete when calibrating on the fibre at the beginning of the night, it is much more patchy in the stellar image. Even so, the difference between this and the reconstructed K-band image of HEI 7 is clear: the secondary can be seen to the top right (south east) at a radial separation of 0.26′′ and about a factor 15 fainter (mV=10.0).
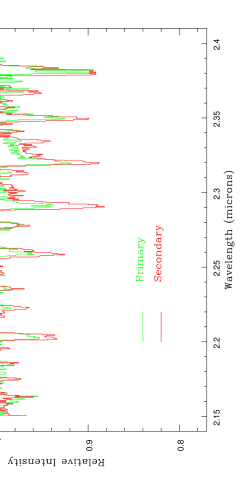
Spectra of the two components are shown in Fig. 3. The primary (AB) component has the expected absorption features for a K0 V star; the differences between this and the secondary (C) are expected from its spectral type of M0 V (estimated from colours). In particular the 12CO bandheads are almost a factor of 2 deeper, while the Mg line has a similar equivalent width. The depth of the Na (2.21 m) and Ca (2.26 m) lines also shows some variation. These spectra, then, are from two separate objects and not simply the same one extracted at different points. This example clearly demonstrates the feasibility of diffraction limited spectroscopy, although the technique remains difficult. It is fortuitous that the diffraction ring is faint in the region near the secondary star so that deconvolution is unnecessary. The next step is to develop methods which will allow overlapping spectra to be distinguished.
4 Wide Field Correction: BD +40∘ 4124
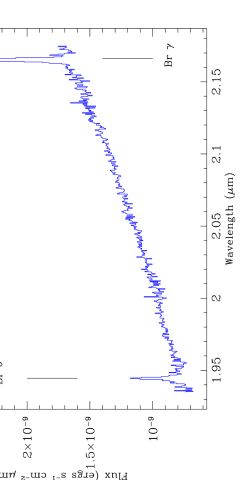
The 3D spectrometer was also used to obtain a K-band spectrum of the Herbig Ae/Be star BD +40∘ 4124 (mV=10.6, mK=5.6) (Fig. 4), while the field around this star was imaged in the JHK bands using -Cass (Fig. 5).

Herbig Ae/Be stars are the massive counterparts (3 M⊙) to the low mass T Tauri pre-main-sequence stars, typically being deeply embedded in gas and dust, but with strong hydrogen recombination lines. BD +40∘ 4124 lies in a small aggregate containing a few other similar stars (the nearest are another Herbig Ae/Be star V1686 Cyg, and the pair V1318 Cyg), but which is isolated from any large star-forming complex (Hillenbrand et al. 1995). Since it is by far the most massive (see Table 1) its effects on the local environment can be studied independently, and at a distance of marginally less than 1000 pc (1 AU) adaptive optics can provide the resolution on solar-system scales which is required for studying the dust envelopes around these stars. As all the stars in the group have ages in the range – yrs, this can be of some importance in understanding how massive stars are formed; and whether the winds, outflows, and radiation field around them influence the evolution of the aggregate.
| Star | Spectral Type | AV/mag | log L/ L⊙ | M/ M⊙ |
|---|---|---|---|---|
| BD +40∘ 4124 | B2 Ve | 3.6–3.8 | 4.10 | 13 |
| V1686 Cyg | B5 Ve | 4.2–6.7 | 2.77 | 4.5 |
| V1318 Cyg North | mid A–Fe | 7–15 | – | |
| V1318 Cyg South | mid A–Fe | 8–15 | – |
Note: all data from Hillenbrand et al. (1995)
The spectrum of BD +40∘ 4124 in Fig. 4 is remarkable in its lack of any features other than Brackett lines. The ratio of these lines Br/Br suggests an extinction of AV=29 mag assuming an intrinsic ratio of 1.52 (Osterbrock 1989) and either the A extinction law of Landini (1984) or the curves from Howarth (1983). This is rather higher than that given in Table 1 derived from optical lines, but is consistent with the AV=45 mag estimated via from 12CO and 13CO luminosities (Hillenbrand et al. 1995). These observations can be reconciled if the line-emitting gas is mixed with the dust obscuring it, so that the optical lines sample only the surface regions and underestimate the extinction-corrected flux. However, the dust must then be internal to the H ii region surrounding the star, and as much as 50–90% of the Lyman continuum photons would be absorbed before they could be processed into recombination lines (Wood & Chruchwell 1989) reducing the recombination luminosity at all wavelengths. An alternative scenario is that the dust exhibits a dense clumpy structure so that the optical lines can sample the H ii region through only the least-obscured lines-of-sight, the near-infrared lines denser regions, and the radio lines can probe through even the densest clumps.

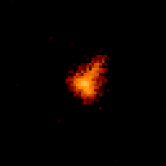
The wide field K-band image taken with -Cass at a pixel scale of 0.08′′ is shown in Fig. 5. BD +40∘ 4124 was centered in the wavefront sensor, allowing correction of 18 modes with a frame rate of 75 Hz. Although this star was saturated the Strehl ratios and FWHMs of 14 others in the field were measured, and these are plotted against their radial distance in Figure 6. The FWHMs were estimated using only vertical and horizontal cuts (the ‘errorbars’ are lines joining these points) since models suggest that the pixel size is already limiting the resolution: for Strehls of 10–15% an intrinsic resolution of 0.16′′ is expected, but the measurable resolution is 0.2–0.3′′ if the flux is binned into 0.08′′ pixels. The figure indicates that out to radii of at least 30′′ there is very little degradation in performance, since the wavefront error due to anisoplanaticism is small compared to the total error; and beyond this as far as can be measured, the correction is only marginally worse.


Figure 7 shows that the correction achieved here is useful: a star 20′′ away clearly has a sharp peak (as do all the single stars in the field), while another has a double peak, identifying it unambiguously as a previously unknown binary system with a separation of 0.32′′. Previous studies of multiplicity in Herbig Ae/Be stars (eg Leinert et al. 1997) have had to resort to speckle imaging, a slow and limiting process compared to adaptive optics. Importantly, examination of profiles of all the sources indicates that the speckle pattern in the halo appears to be stable over the whole field. This means that deconvolution should work well (yielding an effective resolution rather better than 0.2′′) and that the choice of PSF, at least in this case, is not critical. A further result from this image was that the southern star of the V1318 Cyg pair was resolved to be , without the expected sharp core. The extinction to this object derived from the 1-0 Q(3)/1-0 S(1) ratio (Aspin et al. 1994) is AV=4520 mag, using the same laws as above. Combined with very red JHK colours (–5 mag) this has led to interpretation as a dense circumstellar dust shell. We estimate the deconvolved size to be AU. Assuming the normal gas/dust ratio of 100, this is equivalent to cm-2, and a gas density on the order of cm-3. At such densities vibrational levels of H2 above are collisionally de-excited, leading to large ratios between the and higher levels whatever the excitation mechanism, for example 1-0 S(1)/2-1 S(1)10 (Aspin et al. 1994).
5 Natural and Laser Guide Star Observations
of Cluster Galaxies
Between December 1997 and August 1998 we observed 25 galaxies in the Abell 1367 and Abell 262 clusters, including two barred spiral galaxies UGC 1344 and UGC 1347.
UGC 1344 with a Natural Guide Star
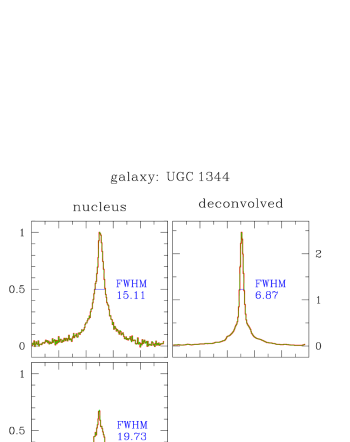
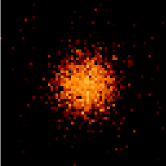
For UGC 1344 we used a nearby (27′′) natural guide star with V=11.0 mag, correcting 7 modes at a sampling rate of 150 Hz, achieving a disturbance rejection bandwidth of about 13 Hz. Cuts of the profiles through the star and galaxy, for both open and closed loop as well as deconvolved are shown in Figure 9. The peak intensity of the star increased by a factor of 3, and the FWHM improved from 1.0′′ to 0.4′′. For the galaxy, the peak increased by only 1.4, although the discussion for BD +40∘ 4124 indicates that the galaxy is well within the isoplanatic patch. The deconvolved image begins to indicate the reason: there is a narrow only marginally resolved core, and a wider bulge component so the increase in peak intensity will effectively be that due to the core only. The observations can be explained if the fluxes in the bulge and core are similar. The presence of a core suggests a recent localised burst of star formation in the galaxy’s nucleus.
UGC 1347 with the Laser Guide Star
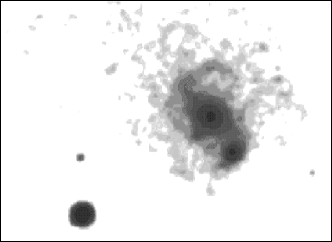
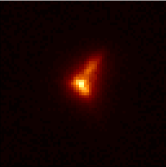
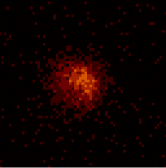
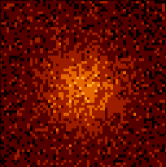
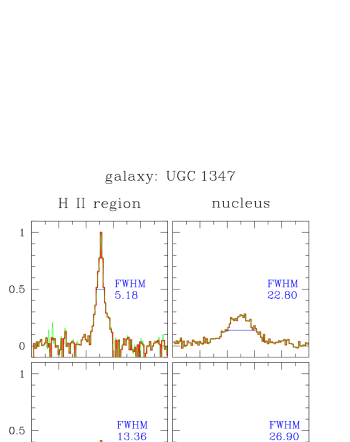
For UGC 1347 we corrected tip-tilt using a V=11.8 mag star 41′′ away, and pointed the laser guide star midway between this and the galaxy. High order corrections were achieved using the LGS, also with 6 subapertures but at a lower frame rate of 50 Hz (rejection bandwidth of only 4 Hz). Figure 12 shows for the star an increase in peak intensity of 2.5, and improvement in resolution from 1.1′′ to 0.4′′. Exactly similar enhancements are seen in the compact H ii region of the galaxy 11′′ from the nucleus, but almost no change is seen in the nucleus itself. All the evidence for recent star formation in this galaxy can be accounted for by the H ii region alone.
Galaxies in Abell Clusters
As summarised in Table 2, both these galaxies have projected positions close to the centre of the Abell 262 cluster, and both have large velocities with respect to the cluster average. However, only UGC 1344 is Hi deficient (Giovanelli & Haynes 1985).
| Galaxy | r/rAbella | cz/ km s-1b | Hi Def. | Mtotal/ M⊙ | LFIR/ L⊙ | LK/ L⊙(total) | LK/ L⊙(nuc.) |
|---|---|---|---|---|---|---|---|
| UGC 1344 | 0.20 | 4155 | 0.78 | (0.8–1.2) | |||
| UGC 1347 | 0.26 | 5543 | 0.07 | (0.5–1) |
Note: a r∘; b cz km s-1
Hi deficiency strongly correlates with distance from the cluster centre, the central region being the zone of depletion; and the fraction of deficient galaxies in a cluster correlates with the observed 0.5–3.0 keV X-ray luminosity of that cluster. The interpretation is that gas is stripped away due to environmental effects of the inter-galactic medium as the galaxy crosses the crowded central region, and the gas that is lost sinks to the centre of the cluster gravitational potential, heating up and giving rise to the hot intracluster gas observed in X-rays. The mechanism by which the gas is stripped is uncertain, although both ram pressure and evaporative stripping probably play some role. Our results for the whole sample indicate a correlation between nucleus core size with both Abell radius and Hi deficiency. A narrow core size is indicative of a localised burst of star-formation, occuring over a region perhaps 50-100 pc compared with the typical bulge size of 300 pc. The correlation suggests that a further effect is induced as a galaxy crosses the centre of the cluster, namely star formation. This should not be surprising since near the cluster centre tidal effects will be both much stronger (tidal force , D is galaxy separation) and more common due to the higher galaxy density. In this interpretation, the Hi deficient galaxy UGC 1344 has just passed the centre so that it has lost its gas and undergone a burst of star formation; UGC 1347 is approaching the centre and has not yet been depleted of its Hi nor has nuclear star formation been triggered.
6 Conclusion
We have presented an overview of recent results obtained with ALFA on the 3.5-m telescope at Calar Alto during the summer semester of 1998 using the MPE 3D integral field spectrometer and -Cass, including:
-
•
excellent performance on bright stars yielding, in the K-band, diffraction limited resolution (0.14′′) and high Strehl ratios (40–60%).
-
•
the first spectroscopy at diffraction limited scales, clearly distinguishing the spectra of both components of the binary system HEI 7 at a projected separation of 0.26′′.
-
•
spectroscopy of the Herbig Ae/Be star BD +40∘ 4124 and JHK images of an field around it, resolving a binary system and a circumstellar dust envelope.
-
•
a laser guide star corrected image of the galaxy UGC 1347 in the Abell 262 cluster which clearly highlights the difference between an unresolved compact H ii region in the galaxy and its resolved nucleus.
ALFA is now beginning to show its true capabilites, and for some observing programmes is able to compete effectively with other adaptive optics sytems. Observations with the laser guide star are still difficult, but improvements which will be implemented during the autumn of 1998 should stabilise closed loop operation and increase the observing efficiency.
ACKNOWLEDGMENTS
The MPIA/MPE team are grateful the Calar Alto staff for their help and hospitality; they also thank the rest of the ALFA team, as well as the 3D and -Cass teams for their invaluable assistance. RID acknowledges the support of the TMR (Training and Mobility of Researchers) programme as part of the European Network for Laser Guide Stars on 8-m Class Telescopes.
References
- [1] C. Worley and G. Douglass Astron. Astrophys. Suppl. 125, p. 523, 1997.
- [2] L. Weitzel, A. Krabbe, H. Kroker, N. Thatte, L. Tacconi-Garman, M. Cameron, and R. Genzel Astron. Astrophys. Suppl. 119, p. 531, 1996.
- [3] S. Anders, R. Maiolino, N. Thatte, and R. Genzel, “Aim: the aperture interchange module,” SPIE 3354, 1998a.
- [4] S. Anders, N. Thatte, L. Tacconi-Garman, A. Eckart, W. Hackenberg, T. Ott, R. Genzel, S. Hippler, R.-R. Rohloff, and S. Beckwith, “Diffraction limited spectroscopy with 3D and ALFA – first results,” Astronomische Gesellschaft 14, 1998b.
- [5] J. Hershey Astron. J. 80, p. 662, 1975.
- [6] L. Hillenbrand, M. Meyer, S. Strom, and M. Skrutskie Astron. J. 109, p. 280, 1995.
- [7] D. Osterbrock, Astrophysics of Gaseous Nebula and Active Galactic Nuclei, University Science Books, Mill Valley, USA, 1989.
- [8] M. Landini, A. Natta, P. Salinari, E. Oliva, and A. Moorwood Astron. Astrophys. 134, p. 284, 1984.
- [9] I. Howarth Mon. Not. R. astr. Soc. 203, p. 301, 1983.
- [10] D. Wood and E. Churchwell Astrophys. J. Suppl. 69, p. 831, 1989.
- [11] C. Leinert, A. Richichi, and M. Haas Astron. Astrophys. 318, p. 472, 1997.
- [12] C. Aspin, G. Sandell, and D. Weintraub Astron. Astrophys. Lett. 282, p. 25, 1994.
- [13] R. Giovanelli and M. Haynes Astrophys. J. 292, p. 404, 1985.