The Sloan Digital Sky Survey and dark matter
Abstract
-
Astronomy & Astrophysics Department, University of Chicago, 5640 S Ellis Ave, Chicago, IL 60637, USA
-
Abstract. The Sloan Digital Sky Survey (SDSS) will carry out a digital photometric and spectroscopic survey over steradians in the northern Galactic cap. An array of CCD detectors used in drift-scan mode will image the sky in five passbands to a limiting magnitude of . Selected from the imaging survey, galaxies, quasars and selected samples of stars will be observed spectroscopically. I describe the current status of the survey, which recently saw first light, and its prospects for constraining models for dark matter in the Universe.
-
Astronomy & Astrophysics Department, University of Chicago, 5640 S Ellis Ave, Chicago, IL 60637, USA
-
Abstract. The Sloan Digital Sky Survey (SDSS) will carry out a digital photometric and spectroscopic survey over steradians in the northern Galactic cap. An array of CCD detectors used in drift-scan mode will image the sky in five passbands to a limiting magnitude of . Selected from the imaging survey, galaxies, quasars and selected samples of stars will be observed spectroscopically. I describe the current status of the survey, which recently saw first light, and its prospects for constraining models for dark matter in the Universe.
1 Introduction
Systematic surveys of the local Universe can provide some of the most important constraints on dark matter, particularly through the measurement of the clustering of galaxies and clusters of galaxies on large scales. Most existing galaxy and cluster catalogues are based on photographic plates, and there is growing concern that such surveys might suffer from severe surface-brightness selection effects, so that they are missing a substantial fraction of the galaxy population. In addition, the limited volume of existing redshift surveys means that even low-order clustering statistics, such as the galaxy two-point correlation function, cannot reliably be measured on scales beyond , an order of magnitude below the scale on which COBE has measured fluctuations in the microwave background radiation.
A collaboration has therefore been formed with the aim of constructing a definitive map of the local universe, incorporating digital CCD imaging over a large area in several passbands and redshifts for around one million galaxies. In order to complete such an ambitious project over a reasonable timescale, it was decided to build a dedicated 2.5-metre telescope equipped with a large CCD array imaging camera and multi-fibre spectrographs. The Sloan Digital Sky Survey (SDSS) is a joint project of The University of Chicago, Fermilab, the Institute for Advanced Study, the Japan Participation Group, The Johns Hopkins University, Princeton University, the United States Naval Observatory, and the University of Washington. Apache Point Observatory, site of the SDSS, is operated by the Astrophysical Research Consortium. Funding for the project has been provided by the Alfred P. Sloan Foundation, the SDSS member institutions, the National Science Foundation and the U.S. Department of Energy.
2 Survey Overview
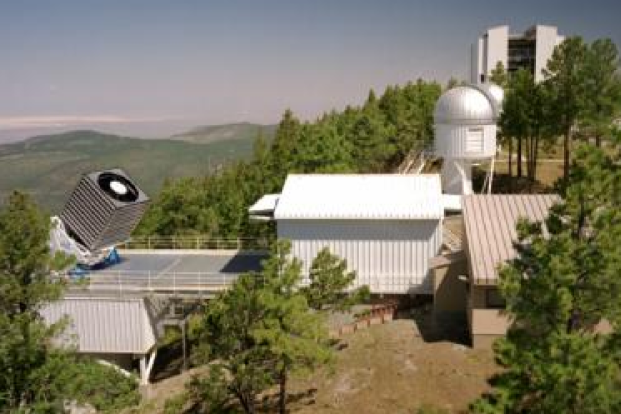
Figure 2: View of Apache Point Observatory, with the SDSS 2.5m telescope to the left, it’s roll-off enclosure in the centre and with the monitor telescope dome behind. The ARC 3.5m telescope is seen at the top right. Apache Point Observatory sits at 2800 metres elevation in the Sacramento Mountains of New Mexico (Fig. 2). The survey hardware comprises the main 2.5-metre telescope, equipped with CCD imaging camera and multi-fibre spectrographs, a 0.5-metre monitor telescope and a all-sky camera. On the best nights (new moon, photometric, sub-arcsecond seeing) the 2.5-metre telescope will operate in imaging mode, drift scanning the sky at sidereal rate, and obtaining nearly simultaneous images in the five survey bands , , , and [4]. On sub-optimal nights, which will comprise the bulk of observing time, the imaging camera will be replaced with a spectroscopic fibre plug-plate cartridge. It is planned that imaging data will be reduced and calibrated, spectroscopic targets selected, and plates drilled within the one-month lunar cycle, so that we will be obtaining spectra of objects that were imaged the previous month. We will spend most of the time observing within a contiguous steradian area in the north Galactic cap (NGC). For those times when the NGC is unavailable, about one third of the time, we will instead observe three stripes in the southern sky, nominally centred at RA , and with central declinations of , and . The southern equatorial stripe will be observed multiple times. The location of survey scans is shown in Figure 4.
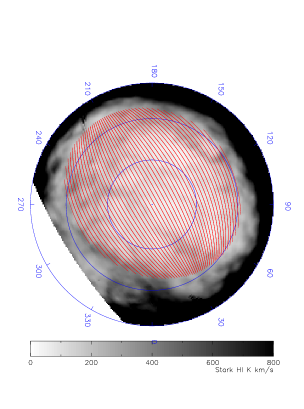
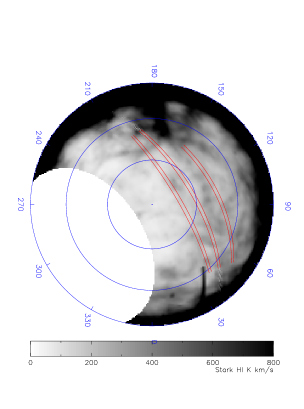
Figure 4: Location of SDSS imaging scans in the northern (left) and southern (right) galactic hemispheres. The concentric circles show galactic latitudes of , and . The grey scale map shows Stark HI column density in units of cm-2. The dark lines show the survey scan-lines, all of which follow great circles. We observe a contiguous area of sr in the north, and three separated stripes in the south. Note that the northern survey is tilted with respect to the contour to avoid regions of high HI column density. In the remainder of this section I discuss the various components of the survey in more detail.
2.5-metre telescope. The main 2.5-metre telescope is of modified Ritchey-Chrétien design [8] with a field of view, and is optimised for both a wide-area imaging survey and a multi-fibre spectroscopic survey of galaxies to . One of the most unusual aspects of the telescope is its enclosure. Rather than sitting inside a dome, as is the case with conventional optical telescopes, the enclosure is a rectangular frame structure mounted on wheels, which is rolled away from the telescope in order to take observations. By completely removing the enclosure from the telescope, we can avoid the substantial degradation to image quality due to dome seeing. The telescope is situated on a pier overlooking a steep dropoff so that the prevailing wind will flow smoothly over the telescope in a laminar flow, which will also help to ensure good image quality. A wind baffle closely surrounds the telescope, and is independently mounted and driven. This baffle serves to protect the telscope from stray light as well as from wind buffeting.
Imaging Camera. In order to image a large area of sky in a short time, we have built an imaging camera [6] that contains photometric CCDs, arranged in six columns. Each column occupies its own dewar and contains one chip in each of the five filters. Pixel size is . The camera operates in drift-scan mode: a star or galaxy image drifts down the column through the five filters, spending about 55 seconds in each. This mode of observing has two significant advantages over conventional tracking mode. 1) It makes extremely efficient use of observing time, since there is no overhead between exposures: on a good night we can open the shutter, drift-scan for eight hours and then close the shutter. 2) Since each image traverses a whole column of pixels on each CCD, flat-fielding becomes a one-dimensional problem, and so can be done to lower surface-brightness limits than with tracking mode images. This, along with the high quantum efficiency of modern CCDs, will enable us to detect galaxies of much lower surface brightness than can wide-field photographic surveys. There is a gap between each column of CCDs, but this gap is slightly smaller than the width of the light-sensitive area of the CCDs, and so having observed six narrow strips of sky one night, we can observe an interleaving set of strips a later night, and thus build up a large contiguous area of sky. The northern survey comprises 45 pairs of interleaving great circle scans, and so imaging observations for the north will require the equivalent of 90 full photometric nights. The camera also includes 24 smaller CCDs arranged above and below the photometric columns. These extra CCDs, equipped with neutral density filters, are used for astrometric calibration, as most astrometric standards will saturate on the photometric CCDs. Thus the photometric data can be tied to the fundamental astrometric reference frames defined by bright stars.
Spectrographs. The 2.5-metre telescope is also equipped with a pair of fibre-fed, dual-beam spectrographs, each with two cameras, two gratings and two CCD detectors. The blue channel will cover the wavelength range 3900–6100 Å and the red channel 5900–9100 Å and both will have a spectral resolving power . The fibres are in diameter and the two spectrographs each hold 320 fibres. Rather than employing robotic fibre positioners to place the fibres in the focal plane, we will instead drill aluminium plates for each spectroscopic field and plug the fibres by hand. We plan on spectroscopic exposure times of 45 minutes and allow 15 minutes overhead per fibre plate. On a clear winter’s night we can thus obtain 9 plates 640 fibres spectra. In order to allow such rapid turnaround between exposures we will assemble 9 fibre cartridges, so that each plate can be plugged with fibres during the day. It will not be necessary to plug each fibre in any particular hole, as a fibre mapping system has been built which will automatically map fibre number onto position in the focal plane after the plate has been plugged. This should considerably ease the job of the fibre pluggers, and we expect that it will take well under one hour to plug each plate.
Monitor telescope. In order to check that observing conditions are photometric, and to tie imaging observations to a set of primary photometric standards, we are also employing a monitor telescope. While the 2.5-metre telescope is drift-scanning the sky, the 0.5-metre monitor telescope, situated close by, will interleave observations of standard stars with calibration patches in the area of sky being scanned. Operation of this telescope will be completely automated, and each hour will observe three calibration patches plus standard stars in all five colours.
all-sky camera. As an additional check on observing conditions, a infrared camera will survey the entire sky every 10 minutes or so. Light cirrus, which is very hard to see on a dark night, is bright at , and so this camera will provide rapid warning of increasing cloud cover, thus enabling us to switch to spectroscopic observing rather than taking non-photometric imaging data.
Data-reduction pipelines. The last, but by no means least, component of the survey is a suite of automated data-reduction pipelines which will read DLT tapes mailed to Fermilab from the mountain and yield reduced and calibrated data with the minimum of human intervention. Such software is very necessary when one considers that the imaging camera will produce data at the rate of around 16 Gbytes per hour!
Pipelines exist to reduce each source of data from the mountain (photometric frames and “postage stamps”, astrometric frames, monitor telescope frames and 2-D spectra) as well as to perform tasks such as spectroscopic target selection and “adaptive tiling” to work out the optimal placing of spectroscopic field centres to maximize the number of spectra obtained. The pipelines are integrated into a purpose-written environment known as Dervish and the reduced data will be written into an object-oriented database.
3 Data Products
The raw imaging data in five colours for the steradians of the northern sky will occupy about 12 Tbytes uncompressed, but it is expected that very few projects will need to access the raw data, which will probably be stored only on magnetic tape. Since most of the sky is blank to , all detected images can be stored, using suitable compression, in around 80 Gbytes, and it is expected that these “atlas images” can be kept on spinning disc. The photometric reduction pipeline will meaure a set of parameters for each image, and it is estimated that the parameter lists for all objects will occupy Gbyte. The parameter lists for the spectroscopic sample will probably fit into 400Mb, and the spectra themselves will occupy Gb. Final access to the data will be through an astronomer-friendly interface, which will answer such queries as “Return all galaxies with and within 30 arcminutes of this quasar”, etc.
3.1 Spectroscopic Samples
The spectroscopic sample is divided into several classes. In a survey of this magnitude, it is important that the selection criteria for each class remain fixed throughout the duration of the survey. Therefore, we will spend a considerable time (maybe one year), obtaining test data with the survey instruments and refining the spectroscopic selection criteria in light of our test data. Then, once the survey proper has commenced, these criteria will be “frozen in” for the duration of the survey. The numbers discussed below are therefore only preliminary, and we expect them to change slightly during the test year.
The main galaxy sample will consist of galaxies selected by Petrosian magnitude in the band, . Simulations have shown that the Petrosian magnitude, which is based on an aperture defined by the ratio of light within an annulus to total light inside that radius, provides probably the least biased and most stable estimate of total magnitude. There will also be a surface-brightness limit, so that we do not waste fibres on galaxies of too low surface brightness to give a reasonable spectrum. This galaxy sample will have a median redshift .
We plan to observe an additional luminous red galaxies to . Given photometry in the five survey bands, redshifts can be estimated for the reddest galaxies to or better [3], and so one can also predict their luminosity quite accurately. Selecting luminous red galaxies, many of which will be cD galaxies in cluster cores, provides a valuable supplement to the main galaxy sample since 1) they will have distinctive spectral features, allowing a redshift to be measured up to 1.5 mag fainter than the main sample, and 2) they will form an approximately volume-limited sample with a median redshift . They will thus provide an extremely powerful sample for studying clustering on the largest scales and the evolution of galaxies.
Quasar candidates will be selected by making cuts in multi-colour space and from the FIRST radio catalogue [1], with the aim of observing quasars. This sample will be orders of magnitude larger than any existing quasar catalogues, and will be invaluable for quasar luminosity function, evolution and clustering studies as well as providing sources for followup absorption-line observations.
In addition to the above three classes of spectroscopic sources, which are designed to provide statistically complete samples, we will also obtain spectra for many thousands of stars and for various serendipitous objects. The latter class will include objects of unusual colour or morphology which do not fit into the earlier classes, plus unusual objects found by other surveys and in other wavebands.
4 Current Status
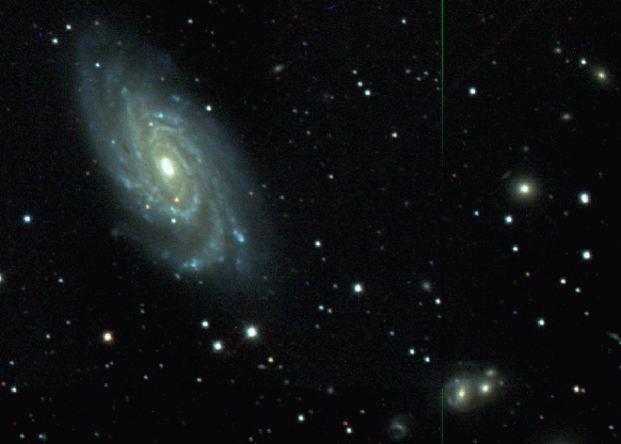
Figure 6: A small section of the first-light image obtained on the night of May 27-28, 1998 which includes the galaxy NGC 6070. The 2.5m telescope and imaging camera are complete and in place. First light with the imaging camera was obtained on 9 May 1998 during bright time and without the baffles; subsequently three imaging runs have been made during dark time and with the baffles in place. We obtained sub-arcsecond images on our most recent run (September 1998). A small sample of SDSS imaging data is shown in Figure 6. This and other colour images are available from the survey website: http://www.sdss.org/.
The spectrographs are both at the site and all optics have been completed and coated. One spectrograph has been fully assembled and some test spectra taken. A fully assembled fibre cartridge is ready and all the others are ready for assembly. The full complement of over 6,000 science fibres needed for the survey have been accepted and tested with a mean throughput of 92.0%. Test plug plates have been drilled with all positions well within tolerances. The various pieces of equipment for storing, handling, and transporting the cartridges are all in place. Once the telescope control system is in operation later this year, we will be able to take spectra on the sky.
All of the data reduction-pipelines are written, with ongoing work on minor bug-fixes, speed-ups and integration of the entire data processing system. The imaging/photometric reduction pipelines are being exercised with the data taken this May and June by the survey imaging camera. Tests are being carried out on the spectroscopic reduction pipeline using simulated data as well as daylight test spectra.
The intent of this project is to make the survey data available to the astronomical community in a timely fashion. We currently plan to distribute the data from the first two years of the survey no later than two years after it is taken, and the full survey no later than two years after it is finished. The first partial release may or may not be in its final form, depending on our ability to calibrate it fully at the time of the release. The same remarks apply to the release of the full data set, but we expect the calibration effort to be finished before that release.
5 Prospects for constraining dark matter
Since the main topic of this meeting is dark matter, I will highlight two of the areas in which the SDSS will provide valuable data for constraining dark matter.
5.1 Measurement of the Fluctuation Spectrum
The huge volume of the SDSS redshift survey will enable estimates of the galaxy power spectrum to scales. Figure 8a shows the power spectrum we would expect to measure from a volume-limited () sample of galaxies from the SDSS northern redshift survey, assuming Gaussian fluctuations and a CDM model. The error bars include cosmic variance and shot noise, but not systematic errors, due, for example, to galactic obscuration. Provided such errors can be corrected for, (and star colours in the Sloan survey will provide our best a posteriori estimate of galactic obscuration), then the figure shows that we can easily distinguish between and models, just using the northern main galaxy sample. Adding the the luminous red galaxy sample (Fig. 8b), will further decrease measurement errors on the largest scales, and so we also expect to be able to easily distinguish between low-density CDM and MDM models, and models with differing indices for the shape of the primordial fluctuation spectrum.


Figure 8: Left: (a) Expected uncertainty in the galaxy power spectrum measured from a volume-limited sample from the SDSS northern survey, along with predictions of from four variants of the low-density CDM model. Note that the models have been arbitrarily normalised to agree on small scales (); in practice the COBE observations of CMB fluctuations fix the amplitude of on very large scales. Right: (b) Power spectrum expected from the luminous red galaxy sample (BRGs), assuming that these galaxies have a bias factor twice that of the flux-limited galaxy sample. 5.2 Cosmological Density Parameter
By measuring the distortions introduced by streaming motions into redshift-space measures of galaxy clustering, one can constrain the parameter , where is the cosmological density paramter and is the bias factor relating fluctuations in galaxy number density to fluctuations in the underlying mass distribution. While existing redshift surveys, eg. IRAS [2] and Stromlo-APM [7], are hinting that (ie. that galaxies are significantly biased tracers of mass or that ), their volumes are too small to measure galaxy clustering in the fully linear regime reliably enough to measure to much better than 50% or so. With the SDSS redshift survey, we expect to be able to constrain to 10% or better.
There are several ways we might hope to determine the galaxy bias factor . By measuring galaxy clustering on scales as shown in Figure 8, we can compare with the COBE microwave background fluctuations directly, and so constrain large-scale galaxy bias in a model-independent way. Analysis of higher-order clustering statistics [5], and of non-linear dynamical effects [2] will also set constraints on galaxy bias. Knowing and . we will be in a good position to reliably measure the cosmological density parameter independent of models for the shape of the fluctuation spectrum.
6 Conclusions
It is probably no exaggeration to claim that the Sloan Digital Sky Survey will revolutionize the field of large scale structure. Certainly we can expect to rule out large numbers of presently viable cosmological models, as illustrated in Figure 8. As well as measuring redshifts for a carefully controlled sample of galaxies and quasars, the survey will also provide high quality imaging data for about 100 times as many extragalactic objects, from which one can obtain colour and morphological information. In addition to measuring the basic cosmological parameters and discussed in the preceding section, the SDSS will also allow us to measure the properties of galaxies as a function of their colour, morphology and environment, providing valuable clues to the process of galaxy formation.
The work described here has been carried out by people throughout the SDSS collaboration. It is a pleasure to thank the organisers of Dark98 for a most enjoyable meeting and for supporting my attendance.
References
- [1] Becker, R.H., White, R.L. and Helfand, D.J., 1995, ApJ, 450, 559
- [2] Cole, S., Fisher, K.B. and Weinberg, D.H., 1995, MNRAS, 275, 515
- [3] Connolly, A.J., et al., 1995, AJ, 110, 2655
- [4] Fukugita, M. et al., 1996, AJ, 111, 1748
- [5] Gaztañaga, E. and Frieman, J.A., 1994, ApJ, 437, L13
- [6] Gunn, J.E. et al., 1998, AJ, in press
- [7] Loveday, J., Efstathiou, G., Maddox, S.J. and Peterson, B.A., 1996, ApJ, 468, 1
- [8] Waddell, P., Mannery, E. J., Gunn, J., Kent, S., 1998, Proc. SPIE, Vol. 3352