CLUSTER IDENTIFICATION VIA VORONOI TESSELLATION
Abstract
We propose an automated method for detecting galaxy clusters in imaging surveys based on the Voronoi tessellation technique. It appears very promising, expecially for its capability of detecting clusters indipendently from their shape. After a brief explanation of our use of the algorithm, we show here an example of application based on a thin strip centered on the ESP Key Programme complemented with galaxies of the COSMOS/UKST Southern Sky Catalogue.
keywords:
galaxy clusters, cosmology1 Introduction
Wide field imaging is becoming increasingly common since new large format CCD cameras are (or soon will be) available at several telescopes. In particular, wide field imaging of the extragalactic sky allows systematic searches for clusters of galaxies. Reliable 2D catalog of clusters are of great cosmological importance since they are starting points for the study of the largest virialized density fluctuations in the universe. Several algorithms have been developed so far for the 2D identification of clusters, for example wavelets (Fadda et al. 1997), matched filters (Postman et al. 1996), adaptive smoothing (Pisani 1996). We propose a method for the identification of clusters based on the Voronoi tessellation. The main advantages of our method are the following: a) it is fast, b) it is completely non-parametric, c) galaxies are naturally assigned to structures. In section 2 we briefly summarize the Voronoi algorithm, while in section 3 we present an example of application of the method on galaxies in a thin strip centered on the ESP Key Programme (Vettolani et al. 1997) complemented with galaxies of the COSMOS/UKST Southern Sky Catalogue supplied by the Anglo-Australian Observatory.
2 The algorithm
The Voronoi tessellation creates a partition of the plane based on a 2-D distribution of points. The algorithm assignes to each point the region of the plane whose points are nearer to this point than to any other point (Figure 1). After having associated Voronoi tessels to all points, we compute a distribution of densities (see Figure 2, solid line). We define as density the inverse of the area of a Voronoi tessel:
| (1) |

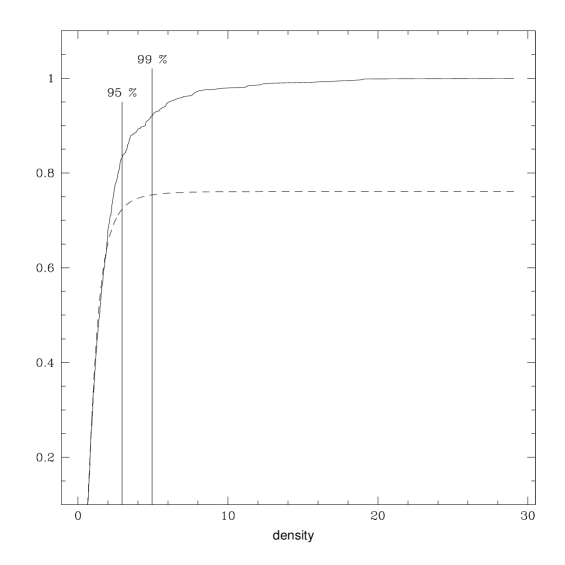
Clearly, clustered points are high density regions while “background” points constitute the low-density tail of the density distribution. Before proceeding further, we reject all boundary-points because they have an infinite area. Then, following Ebeling (1993), we fit the low-density tail of our observed distribution with the analytical form of the density distribution of a poissonian distribution of points (Kiang 1966). We assume that the fitted Kiang distribution (Figure 2, dashed line) is the density distribution of the background points and derive the density threshold for the detection of “clusters” at a chosen significance level, usually 95% and 99% (Figure 2, vertical lines). A cluster output by our procedure consists of an ensamble of data-points with their tessels (cluster members). Before accepting the cluster in the final catalog we add to the list of cluster members a number of points that produce a more regularly shaped cluster. For example, we list as members all points within the “convex hull” of the original cluster. Finally, we fit an ellipse to the cluster with the requirements that the area of the ellipse equals the total tessel area of the cluster members (Figure 3).
3 An example
As a first test of our method, we search for clusters in a thin strip overlapping the ESP Key-Programme (Vettolani et al. 1997). We complement the ESP data with galaxies of the COSMOS/UKST Southern Sky Catalogue supplied by the Anglo-Australian Observatory. The limits of the strip are and respectively; . We consider only galaxies brighter than b. In this strip we find 18 fluctuations at the 99% confidence level. Nine of these fluctuations (50%) correspond to clusters listed in the EDCC (Lumsden et al. 1992) with centers in the ESP strip. The only EDCC cluster we do not identify is EDCC 185 (=ACO supplementary list 1055) becasue of its very low redshift z = 0.0322 and the narrow width of our strip.
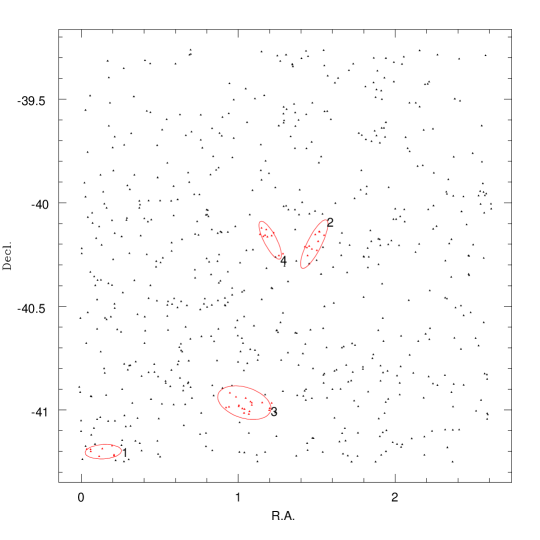

Six fluctuations (0.33%) correspond to rich groups of galaxies objectively identified in redshift-space (Ramella et al. 1998). These groups have at least 5 members and are more distant than z=0.05. Three structures (17 %) have no counterpart in the EDCC or ESP group catalogs. Figure 4 is a 2 degrees window centered on a 1 degree field in the ESP strip. Dots are galaxies, ellipses are our clusters, crosses at the center of dotted circles are EDCC clusters, the triangles at the center of dashed circles are ESP rich groups. We are currently running a more refined version of the algorithm on much deeper fields and on simulations of distant clusters.
References
- [1] beling, H., 1993, Ph.D. Thesis
- [2] adda, D., Slezak, E. & Bijaoui, A., 1997, A&A, 127, 335
- [3] iang, T., 1966, Z.f. Astroph. 64, 433
- [4] umsden, S.L., Nichol, R.C., Collins, C.A. & Guzzo, L., 1992, MNRAS, 258, 1
- [5] isani, A., 1996, MNRAS, 278, 697
- [6] ostman, M., Lubin, L., Gunn, J.E., Oke, J.B., Hoessel, J.G., Schneider, D.P. & Christensen, J.A., 1996, AJ, 111, 615
- [7] amella, M., et al., 1998, A&A, in press
- [8] ettolani, G., et al., 1997, A&A, 325, 954