Abstract
We report on dust measurements obtained during the seventh orbit of the Galileo spacecraft about Jupiter. The most prominent features observed are highly time variable dust streams recorded throughout the Jovian system. The impact rate varied by more than an order of magnitude with a 5 and 10 hour periodicity, which shows a correlation with Galileo’s position relative to the Jovian magnetic field. This behavior can be qualitatively explained by strong coupling of nanometer-sized dust to the Jovian magnetic field. In addition to the 5 and 10 h periodicities, a longer period which is compatible with Io’s orbital period is evident in the dust impact rate. This feature indicates that Io most likely is the source of the dust streams. During a close (3,095 km altitude) flyby at Ganymede on 5 April 1997 an enhanced rate of dust impacts has been observed, which suggests that Ganymede is a source of ejecta particles. Within a distance of about 25 (Jupiter radius, km) from Jupiter impacts of micrometer-sized particles have been recorded which could be particles on bound orbits about Jupiter.
1 Introduction
In 1992, when the Ulysses spacecraft flew by Jupiter, the Jovian system was first recognized as a source of intermittent streams of submicrometer-sized dust particles (Grün et al., 1993). Similar streams were later detected within 2 AU distance from Jupiter when Galileo was approaching the planet (Grün et al., 1996a). It was soon recognized that Jupiter’s magnetosphere could eject submicron-sized dust particles if they existed in the magnetosphere (Horanyi et al., 1993a,b; Hamilton and Burns, 1993).
The arrival direction of the particles detected with both spacecraft – Galileo and Ulysses – was correlated with the ambient interplanetary magnetic field which implied electromagnetic interaction of the particles forming the dust streams (Grün et al., 1993, 1996a). Only particles with a radius of about 10 nm can couple strongly enough to the interplanetary magnetic field to show the observed effects (Zook et al., 1996; J.C. Liou, priv. comm., 1997). The deduced particle impact speeds exceed 200 km/s.
Being now in a highly elliptical orbit about Jupiter, Galileo performs dust measurements in the inner Jovian magnetosphere and during close flybys of the Galilean satellites (Grün et al., 1997, 1998). In this paper we present data from Galileo’s seventh orbit about Jupiter (G7 orbit) which had a close (3,095 km altitude) flyby of Ganymede on 5 April 1997. In the time period of 10 days considered here, Galileo was within a distance of 50 from Jupiter.
2 The dust detector
The Galileo dust detector (DDS) is a multicoincidence impact ionization detector (Grün et al., 1992a; 1995) which measures submicrometer- and micrometer-sized dust particles. The instrument has been calibrated in the laboratory for impact velocities between 2 km/s and 70 km/s. DDS is identical with the dust detector on board Ulysses. For each dust impact onto the sensor, three independent measurements of the impact-created plasma cloud are used to derive the impact speed and the mass of the particle. The coincidence times of the three charge signals are used to classify each impact. Class 3, our highest class, are real dust impacts, and class 0 are noise events. Class 1 and class 2 events were true dust impacts in interplanetary space (Baguhl et al., 1993; Krüger et al., 1998). In the Jovian system, within about 20 from Jupiter, however, class 1 and class 2 are affected by noise. Noise events could be eliminated from the class 2 data (Krüger et al. in prep.), but class 1 events show signatures of being all noise events in the Jovian environment. In this paper, we discuss class 3 and denoised class 2 dust data. Apart from a missing third charge signal, there is no physical difference between dust impacts which are categorized into class 2 and class 3, respectively. Class 3 impacts have three charge signals, whereas only two are required for a class 2 event.
Galileo is a dual-spinning spacecraft, with an antenna that points antiparallel to the positive spacecraft spin axis (PSA, cf. inset in Fig. 1). During most of the orbital tour around Jupiter, the antenna points towards Earth. DDS is mounted on the spinning section of the spacecraft and the DDS sensor axis is offset by an angle of from the spin axis (an angle of has been erroneously stated before). The rotation angle measures the viewing direction of the dust sensor at the time of a particle impact. During one spin revolution of the spacecraft, the rotation angle scans through . DDS has a wide field of view. A reduction in the field of view has recently been recognized for a subset of the smallest dust impacts (Krüger et al. in prep.) which does not apply to the present analysis. Dust particles that arrive from within of the PSA can be sensed at all rotation angles, while those that arrive at angles from to from the PSA can only be sensed over a limited range of rotation angles.
3 Dust Measurements from Galileo’s G7 orbit
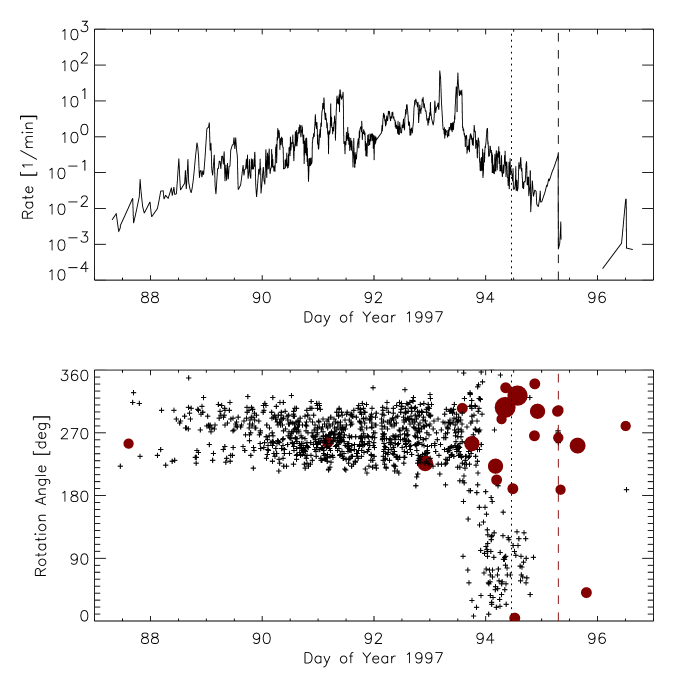
During Galileo’s approach to Jupiter DDS has detected a highly variable impact rate of dust particles. The upper panel of Fig. 2 shows the impact rate of our smallest dust impacts in classes 2 and 3 (ion collector charge C) for a period of 10 days. In the following we will call these particles dust stream particles. The closest approach to Ganymede was on 5 April 1997 (day 95). On day 88 – when Galileo was at about 50 distance from Jupiter – a dust impact rate of about 0.01 imp/min was detected. Closer to Jupiter the impact rate exceeded 10 imp/min a few times (days 91 and 93). Around perigee passage the impact rate dropped to about 0.1 imp/min. Between day 88 and day 94 the impact rate fluctuated by more than an order of magnitude with periods of about 5 and 10 hours. At Ganymede closest approach a sharp peak occurred which lasted only several minutes (Fig. 2).
The impact direction (rotation angle) of the dust particles as derived from the sensor orientation at the time of particle impact is shown in the bottom panel of Fig. 2. The impact direction of a single particle is only known to lie somewhere within the wide sensitive solid angle cone of DDS. The average of all the rotation angle arrival directions of dust particles belonging to a stream is known to much higher accuracy than is that angle for a single particle.
When Galileo was approaching Jupiter the dust impact direction (rotation angle) was concentrated between and . Half a day before perijove passage the impact direction of small particles shifted by and dust particles approached from the opposite direction. This change in impact direction is coincident with the drop in the impact rate on day 94.0 (cf. Fig. 2, upper panel). On day 94.8 impacts of small stream particles ceased. (One small event on day 96.5 is most likely caused by incomplete denoising of class 2). The vast majority of the particles were small submicrometer-sized dust particles which just exceeded the detection threshold (impact charges ). Only about 20 bigger particles () were detected within two days around perijove passage, i.e. within 25 from Jupiter.
Particles detected within about an hour of Ganymede closest approach came from the direction between and . Note that the dust streams had already vanished half a day earlier.
4 Discussion
Three types of dust particles have been detected within the Jovian system (Grün et al., 1997, 1998): (1) small submicron-sized dust particles with high and variable impact rates throughout the Jovian system, (2) a concentration of small dust impacts at the times of closest approaches to the Galilean satellites, and (3) big micrometer-sized dust particles concentrated in the inner Jovian system.
The dust streams observed in interplanetary space out to 2 AU from Jupiter have been explained as streams of tiny particles electromagnetically ejected from the Jovian system (Horányi et al., 1993a,b; Hamilton and Burns, 1993). The tiny dust particles we see within the Jovian system with highly time variable impact rates with periods of about 5 and 10 h (category 1 above) are the continuation of these dust streams detected in interplanetary space. Both types of dust particles show the same characteristics in terms of impact magnitude and impact direction, and there is a smooth transition of the impact rate from interplanetary space to within the Jovian magnetosphere (Grün et al., 1996b). The radii of the particles are around 10 nm and their velocities exceed 200 km/s (Zook et al., 1996) which is a factor of three beyond the upper limit of the instrument’s calibrated velocity range.
When Galileo is approaching Jupiter, a radial outflow of dust is initially detected from rotation angles of . When Galileo moves closer to Jupiter, the impact direction moves closer to the anti-Earth direction (cf. Fig. 1), and dust arrives parallel to Galileo’s spin axis. Shortly thereafter, the impact direction changes to rotation angles of . After perijove passage, Jupiter, Earth and the dust source are in the same hemisphere when viewed from Galileo and dust particles approach from a direction close to the negative spacecraft spin axis (Earth direction). From this direction, dust grains usually cannot enter the DDS sensor, and remain mostly undetected. This explains why DDS has sensed only a few dust particles on the outbound part of its orbit.
Fluctuations in the dust impact rate with 5 and 10 h periods (Fig. 2) have also been reported from other orbits of Galileo about Jupiter (Grün et al., 1998). In Fig. 3 we study the phase relation between the impact rate and Jupiter’s magnetic field at the position of Galileo in a subset of the G7 data. The upper panel shows Galileo’s distance from the magnetic equatorial plane ( position in Jupiter’s magnetic field). The lower panel shows 2 hour averages of the observed impact rate. The 5 and 10 hour periods are evident in the impact rate which indicates that the impact rate is modulated by the magnetic field. Other impact parameters like the rotation angle, the charge rise times and the charge amplitudes are also correlated with the magnetic field position. This indicates that the impact direction, impact velocity, and sizes of the impacting dust particles are also modulated by the magnetic field. Fourier analysis of the observed impact rates shows peaks in the frequency spectrum at about 10 hours (Jupiter’s rotation period) and at about half that period. No lower frequencies have been found in previous data sets (Grün et al., 1998).
The observed features can be qualitatively explained by a simple model of dust which is released in the inner Jovian system and electromagnetically coupled to the magnetosphere (Grün et al., 1998, Horanyi et al., 1993a,b, Hamilton and Burns, 1993). Here we recall only the most important aspects. Particles ejected from a source in the inner Jovian system (Io or the gossamer ring) enter the Io plasma torus and are later released from the torus with a typical charge of about +3V (Horanyi et al., 1997). Once a particle is positively charged it will be accelerated outward by the co-rotational electric field. Because Jupiter’s magnetic field is tilted by w.r.t. to the planet’s rotation axis the particles move in a warped dust sheet. The particle trajectories are typically bent out of the equatorial plane by 10 to . An observer in Jupiter’s equatorial plane detects dust particles when this dust sheet passes over its position. This occurs twice per Jupiter rotation and a periodic flux results with a 5 h period which explains the observed 5 and 10 h periodicities. The shift in impact direction by on day 94.0 is best explained by particles with a radius of about which move on highly bent trajectories.
The Jovian ring (Showalter et al., 1995) and Io (Collins, 1981) have been suggested as possible sources of the dust. If Io were the source, its footprint should be obvious in the data. The impact rate in the G7 data set (Fig. 2) shows indeed three large peaks, each about two days apart (days 89, 91 and 93). The times between these peaks are close to Io’s orbital period (1.77 days). For a proper analysis of the phase relation between the dust impact rate and Io’s orbital period one has to consider the relative motion between Galileo and Io. Because Galileo moves on an elliptical orbit, its velocity depends on its orbital position. Therefore, Io’s orbital period as seen from Galileo depends on Galileo’s distance from Jupiter: far away from Jupiter an observer on Galileo sees Io orbiting about Jupiter with nearly exactly its orbital period. Close to Jupiter, however, Galileo and Io have comparable orbital velocities which leads to an expansion of Io’s orbital period as seen from Galileo.
Figure 4 shows 12 hour averages of the dust impact rate as a function of time in units of Io’s orbital period as seen by an observer moving with Galileo. Periods shorter than 12 hours are suppressed in this diagram. At each dotted line the distance between Galileo and Io has a minimum. Minima in the impact rate occur at minima in the distance from Io, and maxima in the impact rate roughly coincide with maxima in the distance. This indicates that the impact rate of the dust stream particles is correlated with distance from Io. Fourier analysis of a large data set from Galileo’s primary mission (1996 and 1997, data from eleven Galileo orbits about Jupiter) also shows a peak at Io’s period, which was not visible in earlier smaller data sets.
The present results are compatible with Io being the source of the dust stream particles. In the simplest picture with Io being a point source for dust particles, one would expect a variation of the impact rate with Io’s period. The relatively weak modulation of the impact rate by Io indicates that Io’s period is smeared-out by the Io plasma torus which then acts as a more continuous source for dust particles. In this model one would expect maxima in the impact rate to coincide with minima in the distance from the source rather than maxima in the distance. This is explained by highly bent particle trajectories: particles which hit the detector were actually released from the source when the source was on the far side as seen from Galileo (cf. Grün et al., 1998, the trajectory of the 9 nm particle in their Fig. 11). Analysis of the gravitational and electromagnetic forces indicates that particles smaller than about may be able to overcome Io’s gravity and escape from the satellite (Ip, 1996).
As noted earlier (Grün et al., 1997, 1998), there is a second category of particles, which occurred within a few minutes of the closest approach (CA) to Ganymede. It has the signature of dust released from Ganymede: the impact rate is strongly peaked at the time of CA (day 95), and the impact direction is compatible with a satellite source. Only particles arriving from about can be explained by a Ganymede source, whereas is not compatible with such a source. The calibrated velocities of these particles are close to the relative velocity between Galileo and Ganymede. This indicates that our empirial calibration of the dust instrument (Grün et al., 1995) can be applied to these particles which is not the case for the stream particles. By adopting the empirical calibration the size of the particles is about . We interpret these as secondary ejecta particles which are generated by impacts of other particles onto the surface of Ganymede. Such a process has been suggested as being responsible for maintaining both the Jovian ring (Morfill et al., 1980; Burns, 1980, Horányi and Cravens, 1996) and Saturn’s E-rings (Hamilton and Burns, 1994). These ejecta particles, however, are not the main source of the dust stream particles described above. A detailed analysis of these secondary particles is forthcoming (Krüger et al., in prep.). Secondary particles are also noticeable during encounters with Europa and Callisto.
Impacts of large (micrometer-sized) particles have been recorded mainly in the inner Jovian system when Galileo was within a distance of about from Jupiter. Large-particle impacts behave quite differently from dust stream particles (cf. Fig. 2): their impact rate peaks near perijove passage where the shift of the rotation angle occurs. Beside a population of particles orbiting Jupiter on prograde orbits, which could be ejecta from the inner Jovian satellites, there has to be a population on retrograde orbits (Thiessenhusen et al., 1998). These particles could originate from Jupiter’s satellites or could be captured interplanetary and interstellar particles (Colwell et al., 1998). Such a population of particles has also been deduced from data by earlier spacecraft carrying dust detectors through the Jovian system: Pioneers 10 and 11 (Humes et al. 1974, Humes 1980) and Ulysses (Grün et al., 1992b).
5 Summary
During Galileo’s orbits around Jupiter, the dust detector on board recorded a highly variable impact rate. In this paper we have considered data from Galileo’s seventh orbit (G7).
1. The main signature of the data, namely the 5 and 10 hour periodicities of the impact rate are most naturally explained by the coupling of charged dust particles to Jupiter’s magnetic field.
2. In addition to the 5 and 10 h periods, Io’s orbital period (42.4 h) is recognized in the impact rate data. This result indicates that Io is most likely the source of the dust stream particles. Io does not appear as a strong point source, however, because particles initially ejected from Io can be dispersed all around the torus before being released from the torus and driven out of the Jovian system. This leads to a picture of an extended source (the torus) with additional point source features (Io itself). A more detailed analysis of the data is needed to finally answer this question (Graps et al. in prep.).
3. An enhanced impact rate within minutes of closest approach to Ganymede indicates a population of ejecta particles from this satellite. The impact directions and velocities are compatible with such an origin of the particles.
4. Within a distance of about 25 from Jupiter, impacts of large particles have been recorded. Some impacts are compatible with particles on prograde orbits, but there has to be a significant fraction of particles on retrograde orbits as well.
Acknowledgements We thank the Galileo project at JPL for effective and successful mission operations. This work has been supported by Deutsches Zentrum für Luft- und Raumfahrt (DLR).
References
- [] Baguhl, M., et al. Planet. Space Sci., 41, 1085-1098, 1993.
- [] Collins, S. A., J. Geophys. Res., 86, 8621-8628, 1981.
- [] Colwell, J. E., et al., Science 280, 88-91, 1998
- [] Grün, E., et al., Space Sci. Rev., 60, 317-340, 1992a.
- [] Grün, E., et al., Science, 257, 1550-1552, 1992b.
- [] Grün, E., et al., Nature, 362, 428-430, 1993.
- [] Grün, E., et al., Planet. Space Sci., 43, 941-951, 1995.
- [] Grün, E., et al., Nature, 381, 395-398, 1996a.
- [] Grün, E., et al., Science, 274, 399-401, 1996b.
- [] Grün, E., et al., Geophys. Res. Lett. 24, 2171-2174, 1997.
- [] Grün, E., et al., J. Geophys. Res., 103, 20011-20022, 1998.
- [] Hamilton, D. P. and J. A. Burns, Nature, 364, 695-699, 1993.
- [] Hamilton, D. P. and Burns, J. A., Science, 264, 550-553, 1994.
- [] Horányi, M., et al., Nature, 363, 144-146, 1993a.
- [] Horányi, M., et al., J. Geophys. Res. 98, 21,245-21,251, 1993b.
- [] Horányi, M. and Cravens, T. E., Nature, 381, 293-295, 1996.
- [] Horányi, M., et al., Geophys. Res. Lett. 24, 2175-2178, 1997.
- [] Humes, D. H., et al., J. Geophys. Res. 79, 3677, 1974.
- [] Humes, D. H., J. Geophys. Res. 85, 5841-5852, 1980.
- [] Ip, W. H., 23, 3671, 1996
- [] Krüger, H., et al., Planet. Space. Sci., in press, 1998.
- [] Morfill, G. E., et al., Planet. Sp. Sci., 28, 1101-1110, 1980.
- [] Showalter, M. R., et al., Nature, 316, 526-528, 1985.
- [] Thiessenhusen, K.-U., et al., Science, submitted, 1998
- [] Zook, H. A., et al., Science, 274, 1501-1503, 1996.