The Optical Counterpart of
the X-ray Transient
RX J0117.67330: Spectroscopy and Photometry
Abstract
We conducted spectroscopic and photometric observations of the optical companion of the X-ray transient RX J0117.67330 in the Small Magellanic Cloud, during a quiescent state. The primary star is identified as a B IIIe with a mass and bolometric magnitude . The main spectral features are strong H emission, H and H emission cores with absorption wings, and narrow He I and O II absorption lines. Equivalent width and full width at half maximum of the main lines are listed. The average systemic velocity over our observing run is km ; measurements over a longer period of time are needed to determine the binary period and the velocity of the primary. We determine a projected rotational velocity km for the Be star, and we deduce that the inclination angle of the system is .
1 Mount Stromlo Observatory, Private Bag, Weston Creek P.O., 2611, ACT,
Australia
roberto@mso.anu.edu.au
Keywords:
galaxies: Magellanic Clouds—stars: individual (RX J0117.67330)—X-ray: binaries
1 Introduction
The X-ray transient RX J was discovered by the Position Sensitive Proportional Counter on board ROSAT on October 1-2, 1992 (Clarke, Remillard & Woo 1996, 1997); it is located approximately south-east of the X-ray binary SMC X-. Its optical counterpart was observed by Charles, Southwell & O’Donoghue (1996), and by Clarke et al. (1997), and has the characteristics of a Be star; the system is therefore likely to be a High-Mass X-ray Binary (HMXB).
Systems with a Be-type primary are the largest group among the HMXBs, both in the Galaxy and in the Magellanic Clouds (van Paradijs 1995; Kahabka & Pietsch 1996). In these systems, X-ray outbursts lasting from weeks to months are caused by sudden enhancements of the equatorial mass loss of the Be star; during an active state, a modulation corresponding to the orbital period is often observed, with increased X-ray emission when the compact object transits near periastron in an eccentric orbit (van den Heuvel & Rappaport 1987). Active states are separated by longer inactive periods, often lasting several years.
The nature of the compact object in RX J is not yet known: its soft X-ray spectrum, its long decay time after the 1992 outburst and the absence of pulsations make this system a possible black-hole candidate (Clarke et al. 1997). A common way to determine whether the compact object in an X-ray binary can be a neutron star is to deduce its mass function from the radial velocity amplitude of the primary; such measurements are more difficult in HMXBs owing to the low velocity expected for the primary and to the long binary period (tens to hundreds of days).
2 Observations and Data Analysis
We observed the optical counterpart of RX J0117.67330 from August 20 to August 23, 1998, simultaneously with the 40inch telescope (photometry) and the ANU 2.3m telescope (spectroscopy) at Siding Spring Observatory. Conditions were photometric during the first half of the first night and on the last night.
2.1 High-resolution Optical Spectroscopy
Optical spectra of the primary were obtained with the Double Beam Spectrograph on the 2.3m ANU telescope at Siding Spring Observatory, with 1200 grooves/mm gratings for both the blue ( Å) and the red ( Å) spectral regions (resolution 1.2 Å FWHM); the detectors used were SITe CCDs in both arms of the spectrograph.
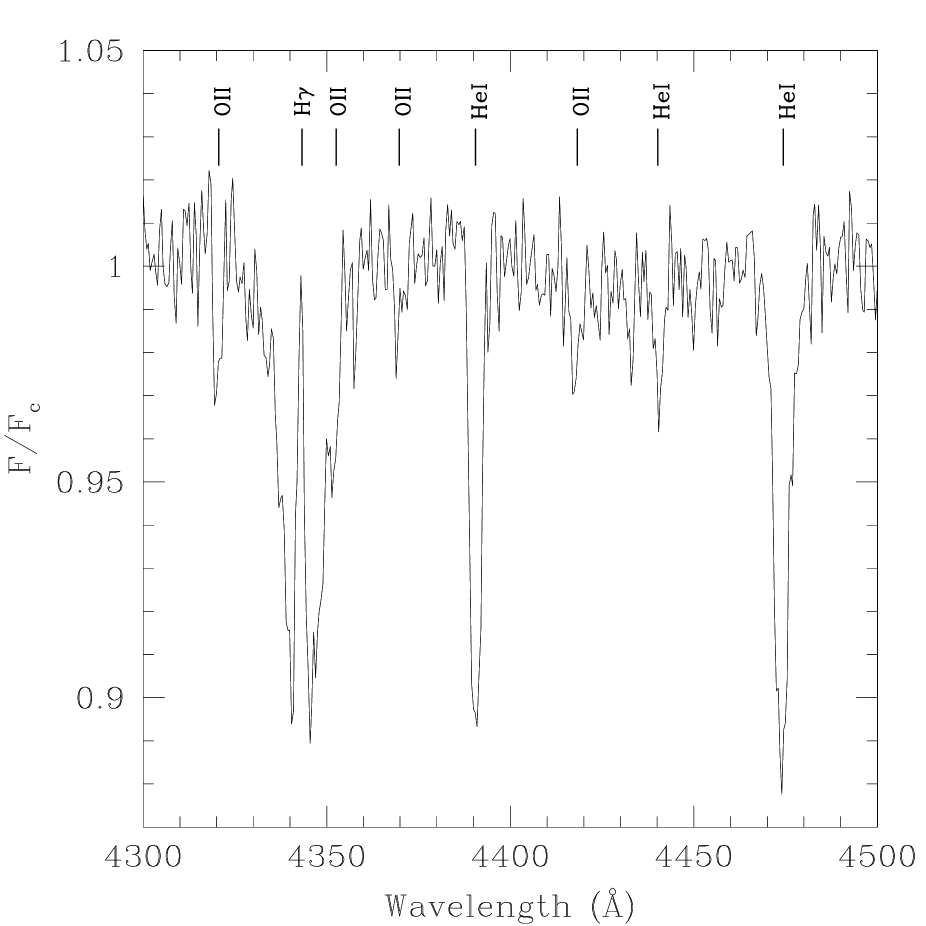
Figure 1 and Figure 2 show the average of seven 600s spectra taken on August 20 in photometric conditions, for the blue and the red part of the spectrum respectively. Atmospheric absorption bands at Å have been removed from the red spectrum using the spectra of the calibration star LTT7379. Wavelengths are heliocentric.


The most prominent feature in the blue spectral region is a strong H emission line: the equivalent width of the emission core, defined as in Dachs et al. (1981), is Å; broader photospheric absorption wings are also present. H is seen in absorption with a narrower and weaker emission core [EW Å]. Narrow absorption is observed from He I (EW Å), He I (EW Å) and He I (EW Å). Figure 3 and Figure 4 show the region of the blue spectrum (average of all four nights, normalised to the continuum) around H and H. Other weaker lines identified in the blue spectrum are listed in Table 1.
| Line | EW (Å) |
|---|---|
| He II | |
| O II | |
| O II | |
| O II | |
| O II | |
| He I | |
| O II | |
| He I | |
| He I | |
| S II | |
| N II/Si III | |
| Si III | |
| O II | |
| O II | |
| O II | |
| O II | |
| He II | |
| He I | |
| He I | |
| S II | |
| He I |
In the red spectral region (Figure 5) the strongest emission line is H (EW Å); weaker emission is seen from S II (EW Å); He I is seen in absorption (EW Å).
Based on these features, the primary star can be identified as a B IIIe, consistently with the results of Charles et al. (1996), and of Clarke et al. (1997).


2.2 Photometry
Photometric observations of the system were conducted from the SSO 40inch telescope; the detector used was a SITe CCD. We obtain apparent magnitudes , , and ; no significant variations in the brightness of the star were observed during the run. Following Clarke et al. (1997) [see also van der Klis et al. (1992)], we have adopted a reddening of ; adopting also a distance modulus for the SMC of (Feast 1991) we get absolute magnitudes , , .
We expect the Be star to appear redder than a non-Be star of similar temperature (Bessell 1993) because of the radiation from the circumstellar disk (colder than the star); Paschen continuum emission usually gives a particularly significant contribution in the near IR. Assuming that the magnitude is the least affected by this additional contribution, and using the theoretical isochrones of Bertelli et al. (1994) in the range of metallicities (Bessell 1993) we can estimate a bolometric magnitude and an effective temperature . These values correspond to the giant phase of evolution for stars of mass , and are therefore consistent with the spectral identification of the optical counterpart of RX J0117.67330 as a B IIIe star.
Using the results of Underhill et al. (1979), we can also infer a radius , although values for the same spectral types determined by Popper (1980) are lower by %.
2.3 Projected rotational velocity and radial velocity
An interesting feature of our spectra is the small full width at half maximum (FWHM) of all the lines; the narrowest absorption lines are He I and He I , for both of which we calculate an average FWHM km . The Doppler broadening of spectral lines is a function of the projected rotational velocity . The FWHM of the He I absorption line was used by Slettebak et al. (1975) as a parameter for a system of standard rotational velocity stars. We determine an average FWHM Å for He I in our spectra; correcting for the instrumental broadening (resolution Å), we estimate a FWHM Å km . Comparing this value with those listed in Slettebak et al. (1975) for the same spectral type, we estimate a projected rotational velocity km .
It is generally assumed (Hardorp & Strittmatter 1970) that all Be stars are fast rotators with approximately the same rotational velocity, the observed velocity spread being due to orientation effects. The largest values of measured from line profiles are in the neighbourhood of km (Sletteback 1982). If we assume a true rotational velocity at the equator km , we infer an inclination angle .
An empirical correlation between the full width at half maximum
of the emission component from H, its
equivalent widths and the projected rotational velocity was derived
by Dachs et al. (1986):
| (1) |
In this case, we measure a mean FWHM Å km , and a mean EW Å for H (Figure 5). This would lead to a projected rotational velocity km , in agreement with the more reliable value derived from the He I absorption line.
It is reasonable to assume (Dachs et al. 1986) that the equivalent width of the H emission line is proportional to the projected area of the disk orbiting the Be star in the equatorial plane; the disk is made of gas excreted from the star, and its outer radius is expected to increase during an active phase of the system. Using the empirical relation between H equivalent width and disk radius given by Dachs et al. (1996), we derive , where is the radius of the Be star and is the radius at which optical depth equals unity for H emission. As discussed in §2.2, we can take and .
If the circumstellar disk were geometrically thin and in keplerian rotation,
the emitting gas at its outer rim would have a projected rotational velocity
| (2) |
We would therefore expect to observe double-peaked line profiles for H and H with peak-to-peak separations km (Smak 1981). This value corresponds to a separation Å at H, and Å at H, well discernible with our Å resolution. We observe that both H and H emission line profiles are always symmetrical and single-peaked: this suggests that the circumstellar gas is not confined to a thin disk in the equatorial plane, but may form a thick torus or an envelope which extends to the polar regions of the stellar atmosphere. Alternatively, absence of double peaks could be due to non-keplerian motion in the outer disk, where radial outflows can dominate over rotation, or to a much larger disk radius [cf. the model proposed by Poeckert & Marlborough (1979)]. As shown in Dachs et al. (1996), the H emission lines from Be stars are almost always single-peaked for values of EW, FWHM and similar to those measured in this system.

The projected radial velocity of the system was determined by measuring the central position (using a Gaussian fit) of H, H, He I and He I in each spectrum (two or three consecutive 600s spectra were averaged together to increase the S/N); the values found are plotted in Figure 6. Although the variations in the measured radial velocity may be due to the orbital motion, the data are insufficient to determine the orbital period or the radial velocity amplitude from these data, or the eccentricity of the orbit (it can be in Be/X-ray binary systems). All known Be/X-ray binaries have orbital periods days, with periods of hundreds of days in some cases (van den Heuvel & Rappaport 1987). The average systemic velocity over the time of our spectral observations is km , confirming that the system is located in the SMC as suggested by Clarke et al. (1997).
3 Conclusions
We have presented spectroscopic and photometric observations of the optical counterpart of the X-ray transient RX J0117.67330 in the Small Magellanic Cloud, currently in an inactive state. The data allow us to identify the primary star as a B IIIe star, of mass , radius , effective temperature K and bolometric magnitude mag. We have derived an inclination angle of the binary system and an average projected radial velocity km ; we have also measured the equivalent widths of the main optical lines. Further observations at different orbital phases are necessary to determine the binary period and the mass function of the compact object. Comparison between this set of data and observations taken during an X-ray active state (phase of enhanced mass loss from the Be star) may be useful to determine the orbital parameters of the binary systems and to improve the current models of mass transfer in HMXBs.
Acknowledgements
I would like to thank Kinwah Wu who did some of the photometric observations at the SSO 40inch telescope; thanks also to Stefan Keller and Mike Bessell for their useful comments and suggestions about Be stars.
References
Bertelli, G., Bressan, A., Chiosi, C., Fagotto, F., & Nasi, E. 1994, A&AS, 106, 275
Bessell, M. S. 1993, in Precision Photometry, ed. D. Kilkenny, E. Lastovica & J. W. Menzies (Cape Town: The Observatory), 227
Charles, P. A., Southwell, K. A., & O’Donoghue, D. 1996, IAU Circ. 6305
Clarke, G. W., Remillard, R. A., & Woo, J. W. 1996, IAU Circ. 6282
Clarke, G. W., Remillard, R. A., & Woo, J. W. 1997, ApJ, 474, L111
Dachs, J. et al. 1981, A&AS, 43, 427
Dachs, J., Hanuschik, R., Kaiser, D., & Rohe, D. 1986, A&A 159, 276
Feast, M. W. 1991, in The Magellanic Clouds, IAU Symposium 148, ed. R. Haynes & D. Milne (Dordrecht: Kluwer), 1
Hardorp, J., & Strittmatter, P. A. 1970, in Stellar Rotation, ed. A. Slettebak (Dordrecht: Reidel Publishing Company), 48
Kahabka, P., & Pietsch, W. 1996, A&A, 312, 919
Poeckert, R., & Marlborough, J. M. 1979, ApJ, 233, 259
Popper, D. M. 1980, ARA&A, 18, 115
Slettebak, A. 1982, ApJS, 50, 55
Slettebak, A., Collins, G. W., Boyce, P. B., White, N. M., & Parkinson, T. D. 1975, ApJS, 29, 137
Smak, J. 1981, Acta Astron., 31, 395
Underhill, A. B., Divan, L., & Prévot-Burnichon, M.-L. 1979, MNRAS, 189, 601
van den Heuvel, E. P. J., & Rappaport, S. 1987, in Physics of Be Stars, ed. A. Slettebak & T. P. Snow (Cambridge: University Press), 291
van Paradijs, J., & McClintock, J. E. 1995, in X-Ray Binaries, ed. W. H. G. Lewin, J. van Paradijs, & E. P. J. van den Heuvel (Cambridge Astrophysics Series, Cambridge University Press), 536
van der Klis et al. 1992, A&A, 106, 339