Abstract
The coherent image distortions induced by weak gravitational lensing can be used to measure the power spectrum of density inhomogeneities in the universe. We present our on-going effort to detect this effect with the FIRST radio survey, which currently contains about 400,000 sources over 4,200 square degrees, and thus provides a unique resource for this purpose. We discuss the sensitivity of our measurement in the context of various cosmological models. We then discuss the crucial issue of systematic effects, the most serious of which are source fragmentation, image-noise correlation, and VLA-beam anisotropy. After accounting for these effects, we expect our experiment to yield a detection, or at least a tight upper limit, for the weak lensing power spectrum on 0.2-20 degree scales.
Weak Lensing by Large-Scale Structure with the FIRST Radio Survey
1Department of Astrophysical Sciences, Peyton Hall,
Princeton University, Princeton, NJ 08544
2Columbia Astrophysics Laboratory, 538 W. 120th Street, New York,
NY 10027
3Department of Physics & Astronomy, University of Victoria, P.O. Box
3055, Victoria, BC V8W sP6, Canada
4Institute of Geophysics and Planetary Physics, Lawrence
Livermore National Laboratory, Livermore, CA 94450
5Space Telescope Science Institute, 3700 San Martin Drive,
Baltimore, MD 21218
1 Introduction
The coherent image distortions induced by weak gravitational lensing can be used to measure the power spectrum of density inhomogeneities in the universe (see [4] for a review, and [5] for a bibliography). While most searches for this effect are conducted in the optical band, we are engaged in an effort to detect this effect with the FIRST radio survey. The main advantages of our experiment are the high redshift of the sources (), the wide solid angle covered by the FIRST survey (currently 4,200 deg2), and the reproducibility of the systematic effects. While a detailed account of our study will appear in ref. [7] (see also [5]), its theoretical framework and the study of one of the systematic effects are presented in refs. [3] and [6].
2 Survey and Methods
The FIRST radio survey [1, 9] was conducted at the VLA at 1.4 GHz in the B configuration. Its flux limit is 0.75 mJy, with a restoring beam FWHM of and a pixel size of . The survey currently contains about sources over deg2, with a mean redshift of . Observing time has been allocated to extend its coverage to 7,200 deg2, while its nominal area is 10,000 deg2.
We characterize each source by its ellipticity, , where and are the deconvolved major and minor axes, and is the position angle, derived from elliptical gaussian fits. For our weak-lensing search, we only keep resolved sources (, ), which represent 38% of the total number of sources and amount to a source density of deg-2.
The weak lensing shear is related to the source-averaged ellipticity by , where is the shear-ellipticity conversion factor, and is the variance of the intrinsic source ellipticities. For our sample, and . While the small source density in our sample prohibits a mapping of the shear, the lensing effect can be studied statistically. This can be achieved by measuring the shear correlation functions and , where the average is over source pairs with separation , and the rotated ellipticities are measured along the separation vector.
3 Theory and Sensitivity
To estimate the expected lensing signal, we consider the four CDM models listed in Table 1 [3]. While model 1 is COBE-normalized, models 2-4 are essentially cluster-normalized (, see [8]) and are thus more realistic. For each model, we list the rms shear in square cells of size , along with the signal-to-noise ratio SNR for detecting this excess variance with FIRST. For the cluster-normalized models, an rms shear of about 1.5% is expected to be detectable at the level, in this fashion.
| Table 1: Weak lensing signal expected for several CDM models with the | ||||||||
| FIRST survey (7,200 deg2) | ||||||||
| model | SNR | SNR | ||||||
| 1 | 1 | 0.50 | 1 | 0.012 | 1.21 | 0.022 | 9.9 | 31 |
| 2 | 1 | 0.50 | 0.8 | 0.025 | 0.71 | 0.014 | 4.0 | 10 |
| 3 | 0.4 | 0.65 | 1 | 0.015 | 0.65 | 0.013 | 3.5 | 8 |
| 4 | 1 | 0.35 | 1 | 0.015 | 0.74 | 0.015 | 4.6 | 11 |
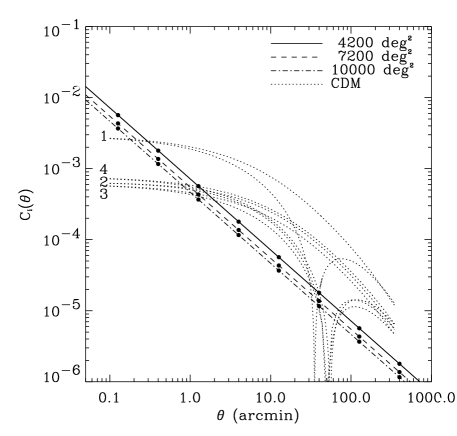
The shear correlation functions expected for each model are shown in Figure 1. Note that our linear predictions would be revised upward for if nonlinear evolution were included [2]. In the absence of lensing, the rms fluctuation of averaged in an interval of width , would be , where is the number of source pairs in this interval. As the straight lines in Figure 1 demonstrate, we will be able to detect a signal for and for ranging from 0.2 to 20 degrees. The complete lensing signal can be measured by performing a maximum likelihood analysis for the power spectrum amplitude [3]. The signal-to-noise ratio, SNR, expected with this method is listed in the last column of table 1 and is about 10 for cluster-normalized models.
4 Systematic Effects
Because the weak-lensing signal is only of the order of 1%, systematic effects must be carefully accounted for. The following briefly describes the major effects which can introduce spurious ellipticity correlations.
Source Fragmentation: A significant fraction of radio sources have a double-lobe structure, and are broken into two components by the object finder. Because these fragments tend to be aligned, this produces ellipticity correlations on small angular scales. An analysis of the excess signal in the correlation function of FIRST source positions reveals, however, that this effect is negligible for .
Correlated Noise: Because the FIRST survey was derived from interferometric observations, the noise in its images is spatially correlated, as is apparent in the presence of “stripes” in the noise. The consequence of noise correlation on source ellipticities was investigated in detais in ref. [6], where it was found that, while the effect is important on small scales, it is negligible for .
Beam Distortion: Spurious shape correlations can also be produced by spatial variations of the effective convolution beam. The beam shape mostly depends on the orientations of the VLA antennae at the time of the observation, and can thus be modeled and corrected for, a posteriori. We are currently studying the magnitude of this effect and its consequence for weak lensing measurements.
5 Conclusions
If, as we expect, the effect beam distortion can be corrected for, the FIRST survey will allow us to detect, or at least to set a tight upper limit on, the weak lensing power spectrum on 0.2-20 degree scales. Since these scales correspond to the linear regime, our measurement will be easy to compare to theoretical predictions. Our preliminary measurement of the shear correlation function already leads to upper limits that are close to the cluster-normalized CDM predictions. Our experiment will complement similar measurements in the optical band, which are mostly sensitive to smaller angular scales.
Acknowledgements. We thank Nick Kaiser, Frazer Owen, Jacqueline van Gorkom, David Schiminovich, and Don Neill for useful discussions. This work was supported in part by the NASA MAP/Midex program, the A.P. Sloan Foundation, grant DE-FG02-92ER40699, and NASA grant NAG5-3091.
References
- [1] Becker, R.H., White, R.L., Helfand, D.J. 1995, ApJ , 450, 559
- [2] Jain, B., & Seljak, U. 1997, ApJ , 484, 560
- [3] Kamionkowski, M., Babul, A., Cress, C., Refregier, A. 1998, submitted to MNRAS, preprint astro-ph/9712030
- [4] Narayan, R., & Bartelmann, M. 1996, preprint astro-ph/9606001
- [5] Refregier, A. 1998, weak lensing by LSS links and bibliography can be found at http://www.astro.princeton.edu/~refreg
- [6] Refregier, A., & Brown, S.T. 1998, submitted to ApJ , preprint astro-ph/9803279
- [7] Refregier et al. 1998, in preparation
- [8] Viana, P.T.P., & Liddle, A. 1996, MNRAS, 281, 369
- [9] White, R.L., Becker, R.H., Helfand, D.J., Gregg, M.D. 1997, ApJ , 475, 479