The effect of supernova heating on cluster properties and constraints on galaxy formation models
Abstract
Models of galaxy formation should be able to predict the properties of clusters of galaxies, in particular their gas fractions, metallicities, X-ray luminosity-temperature relation, temperature function and mass-deposition-rate function. Fitting these properties places important constaints on galaxy formation on all scales. By following gas processes in detail, our semi-analytic model (based on that of Nulsen & Fabian 1997) is the only such model able to predict all of the above cluster properties. We use realistic gas fractions and gas density profiles, and as required by observations we break the self-similarity of cluster structure by including supernova heating of intracluster gas, the amount of which is indicated by the observed metallicities. We also highlight the importance of the mass-deposition-rate function as an independent and very sensitive probe of cluster structure.
keywords:
galaxies: clusters: general – galaxies: formation – galaxies: evolution – cooling flows – X-rays: galaxies1 Introduction
Our understanding of galaxy formation through the hierarchical clustering of gas and dark matter (DM) has improved greatly over the past decade. The aim of models of galaxy formation is to account for the properties of all structure, from the first dwarf galaxy to the rich clusters of galaxies that are virialising now. The collapse of the dominant dark matter is relatively well understood, so that the major current problem is to model the complex gas processes that take place within collapsed and collapsing DM halos. Despite their success in accounting for some properties of galaxies, many semi-analytical models do not predict correctly the properties of groups and clusters of galaxies. In particular, these models should predict gas fractions, metallicities, the X-ray luminosity-temperature () relation, the temperature function and the mass-deposition-rate () function of clusters.
One problem is that the gas fraction in clusters, which is observed to be in the range 10–20 per cent (White et al. 1993b; White & Fabian 1995; David, Jones & Forman 1995; White, Jones & Forman 1997; Evrard 1997), is underestimated by those models that have low baryon fractions (e.g., most of the values considered by Kauffmann, White & Guiderdoni (1993), Cole et al. (1994), Heyl et al. (1995), Kauffmann & Charlot (1998) and Baugh et al. (1998)).
In this paper we show that additional heat input to the intracluster gas, which in our fiducial model we take to be due to supernovae, can consistently account for the major X-ray properties of groups and clusters of galaxies. This has a similar effect to ‘preheating’ as invoked by other authors (Kaiser 1991; Evrard & Henry 1991; Metzler & Evrard 1994; Navarro, Frenk & White 1995; Bower 1997; Jones et al. 1998). A well-known problem addressed by preheating is the slope of the relation. Models and simulations which do not involve preheating (and in general those which investigate galaxy properties do not) are generally ‘self-similar’ and give (Kaiser 1986), whereas clusters are observed to follow (David et al. 1993). Models which preheat the gas in clusters generally break the self-similarity. For example, a constant excess specific energy can have a large effect in the shallow potential wells of groups, while having little effect on the largest clusters. The excess energy raises the temperature as well as the potential energy of the gas by pushing it outwards, thereby flattening the gas density profile. This lowers and steepens the relationship between and .
During galaxy formation gas is heated and possibly ejected from galaxies by supernovae. It retains most of this ‘excess energy’ as thermal and gravitational potential energy (and possibly kinetic energy) as it passes through the collapse hierarchy, eventually becoming part of the intergalactic medium in groups and clusters. Gas that is ejected from a galaxy is expected to recollapse with the next ‘major merger’ (which in our model is the doubling, at least, of the mass of the halo that the galaxy resides in). This is reasonable since ejected gas would encounter the inter-galactic medium which subsequently forms part of a larger halo. In our fiducial model the only source of heating and metal enrichment is Type II supernovae (SNe II) associated with star formation (Nulsen & Fabian 1995, 1997; hereafter NF95 and NF97). There is some evidence that most of the metals in intracluster gas came from SNe II rather than SNe Ia (Mushotzky et al. 1996; Nagataki & Sato 1998), but a further reason for our assumption is because while both types inject about the same amount of energy, SNe Ia inject about 10 times more iron than SNe II. Hence for the iron abundance measured in intracluster gas, the associated energy injection is maximised by using only SNe II. We assume an energy injection of erg per supernova (Spitzer 1978) which is not radiated locally. The mean mass of iron produced per supernova is 0.07 M⊙, which leads to 3.7 keV/particle excess specific energy in gas with solar iron abundance. By choosing the initial metallicity in groups when they are first formed to be a suitable value, the iron abundance of clusters in our model is which corresponds to about 1.1 keV/particle of excess energy.
The semi-analytical model we use is based on that described in NF97, with an improved cosmological model and a more accurate form for dark matter halos. The model pays particular attention to gas processes, explicitly including the effects of cooling flows in its treatment of hot gas. When hot gas has had sufficient time to radiate its thermal energy it is assumed to preferentially form low mass stars, effectively baryonic dark matter (BDM), as observed in cooling flows in clusters. We assume that dark matter halos follow the NFW profile (Navarro, Frenk & White 1997; hereafter NFW97). Gas in the resulting potential wells is assumed to be isothermal and in hydrostatic equilibrium. The model clusters turn out to have gas density profiles closely resembling those in observed clusters.
In this paper we use an open cosmology with , H0 km s-1 Mpc-1and a cosmological constant of zero. Density fluctuations are obtained from a CDM model with primordial spectral index of , normalised to make . This normalisation, which is slightly lower than some estimates based on cluster numbers, is discussed in section 3. We note that our results would be largely unchanged in a flat cosmology with the same , since the mass function of clusters today would be the same. Likewise, our conclusions do not depend on when the excess energies were injected or the exact history of the clusters and their progenitors. We do however assume that the supernovae injected their energy into virialised gas, as opposed to the uncollapsed IGM.
2 Description of the model
The two main changes from the model described in NF97 are the use of an open cosmology and the improvement of the DM and gas profiles. The mass of a halo is defined as that inside the virial radius, , and the mean density inside is required to be 200 times the background density of an universe of the same age. (This is marginally different from NFW97, but follows the spherical collapse model strictly.) We use the NFW profile (NFW97) which takes the form
| (1) |
where , and the characteristic density and scale, and , are parameters. For a given mass virialising at some time in a given cosmology (which yields ), has only one degree of freedom, which can be fixed by applying the algorithm given in the Appendix of NFW97 to obtain the concentration, . is then fixed since we know the mean density inside . The algorithm used was shown by NFW97 to provide reasonable fits of to simulation results, where small halos were found to be more ‘concentrated’ than large ones. In our cosmology the value of typically ranges from 4.5–6.5 for clusters.
We consider the above profile to describe the total density of DM and gas, thus the gravitational potential is calculated from it, assuming that the halo is truncated at :
| (2) |
where . Since the gas fraction is small, the DM also follows the NFW profile to a good approximation.
In our model the gas is isothermal and in hydrostatic equilibrium, giving the gas density profile
| (3) |
where is the mean mass per particle in the gas, is its temperature and is Boltzmann’s constant. Inserting the expression for the potential gives
| (4) |
where is a constant and . The above profile, which we shall refer to as the NFW-gas profile, was shown by Makino et al. (1997) to closely approximate the conventional -model (with ). It tends to in the centre and to for large . Thus is, in practice, very small and the plateau at large is not noticeable. The parameter has the same units as velocity dispersion squared, thus it is apparent that is closely related to the widely-used parameter , the ratio of the DM kinetic energy to the thermal energy of the gas when both are isothermal.
The NFW-gas profile has been fitted to the surface brightness profiles of observed clusters and it models most clusters very well (Ettori & Fabian 1998). Values of in the largest clusters which have cooling flows (suggesting they are in a relaxed state, in contrast to non-cooling flows; Buote & Tsai 1996) average about 10.5, with a standard deviation of about 1.0 (Ettori, private communication). Direct comparison shows that the gas profile for closely follows the NFW profile from to 3. The profiles differ inside due to the flat core of the NFW-gas profile, which implies that the gas fraction increases as a function of radius, as observed in real clusters (e.g. White, Jones & Forman 1997). This last effect becomes more pronounced and spreads to larger radii for smaller values of , the major cause of which will be heating by supernovae.
Since gives both the gas temperature and the slope of the gas density profile, it is the structural parameter through which supernova heating exerts its influence on cluster properties. The procedure for setting is as follows. We postulate that the total specific energy of the gas (thermal plus gravitational) is proportional to the specific gravitational energy of the DM, and that any excess specific energy from supernova heating is added to the above gas energy, as its name implies. i.e.,
| (5) |
where is the DM density, which follows the NFW profile, and are the total gas and DM masses, and is the excess specific energy. The volumes of integration are spheres of radius . Given the constant , it is easy to show that is only a function of and . The constant of proportionality is calibrated so that is close to the observed value of 10.5 for the largest clusters, when . We use the value . (Note that varies by around 0.5 depending on collapse redshift, through its dependence on .) The reason for matching to the largest clusters is that if supernova heating does occur, we expect it to have least effect on the largest clusters. As varies little over cluster masses, this method ensures that clusters are self-similar when there is no excess energy (i.e., and are roughly constant). The trends for and are to increase slightly with decreasing mass, over all masses in our model (see below).
The mass deposition rates of clusters are estimated by finding the radius at which the cooling time is equal to the time to the next major merger (see below) or the present, and dividing the gas mass enclosed by to give . For clusters with cooling flows, i.e., those with significant , the hot gas which cools does not form stars but BDM.
The Cole & Kaiser (1988) block model is used to simulate the merging history of dark matter halos. The smallest masses in the hierarchy are M⊙ and there are 20 levels of hierarchy so that the total mass in one collapse tree is M⊙. When a ‘block’ in the hierarchy virialises, it merges into one halo both older halos and previously uncollapsed material. The new average metallicity and excess energy of the gas can therefore be calculated. Since blocks double in mass up the hierarchy, each collapse of a block roughly corresponds to a major merger. As already mentioned, we set the metallicities in groups to be high without considering the implications of this for star formation. Halos with masses in the range 15–120 M⊙ are given initial iron abundances of (̇This implies that the gas in some of the smaller halos is unbound.) As a result the average metallicities (for a given mass) range from 0.3 for clusters of mass M⊙ to 0.25 for the largest clusters. The range of scatter in metallicities is . These are in good agreement with the recent ASCA measurements by Fukazawa et al. (1998) of iron abundances in 40 nearby clusters and the measurements of Allen & Fabian (1998).
The gas fraction of the clusters in our model lie within one per cent of 14 per cent.
3 Results and Discussion

To illustrate the effect of heating from supernovae, we display in Fig. 1 the - distributions before and after the inclusion of supernova heating. We superimpose on the distributions the power law fit obtained by David et al. (1993), for bolometric luminosities. The excess energies bring the smaller clusters into agreement with the observed correlation, by increasing their temperature, flattening their density profiles and thereby decreasing their luminosities. For clusters of mass M⊙, decreases to around 9. The spread in the - distributions are significant and arise naturally in our simulation from the different formation histories of the clusters.
For comparison with Fig. 1, if we halve the excess energies injected, the average luminosity of a K cluster rises to erg s-1. Doubling the excess energies causes most of the clusters with K to be unbound, which clearly disagrees with data, and roughly halves the luminosity of K clusters. In future work we will investigate whether restricting the heating to the core of clusters can decrease the excess energies required (preliminary results suggest that this could reduce the total energy requirements by about a third).


In Figs. 2 and 3 we show the X-ray luminosity function (XLF) and temperature function respectively. The curves plotted for comparison are the best fit Schechter function to the ROSAT Brightest Cluster Sample (BCS) bolometric luminosity function, obtained by Ebeling et al. (1997), and the best power law fit to the temperature function obtained by Edge et al. (1990). The errors in the BCS XLF are very small, while the temperature function is currently uncertain by factors of around 2 or 3. A problem which follows from an incorrect slope of the - relation is that if the temperature function fits the data reasonably well, then the XLF is too steep compared to data (e.g. Kitayama and Suto 1996). Correcting the - relation thus improves the slope of the XLF significantly, though it is still slightly steeper than observed.
Estimates of from cluster abundances in general use a theoretically derived mass function and assume some mass-temperature () relation in order to compare with an observed temperature function. The calibration of the relation is thus crucial to the results, especially as the temperature function has a very steep slope. We find that with zero excess energy our model clusters obey the simple estimate (appropriate for isothermal gas and DM density profiles) of
| (6) |
to within a few per cent, where is the total mass within . Supernova heating raises the temperature slightly for small clusters. For a cluster of mass M⊙ collapsing at the temperature increases from K to K in the model described, close to 10 per cent higher. The resulting temperatures in our model are a necessary consequence of fitting the relation. In a recent paper, Eke et al. (1998) used a more elaborate form of Equation 6 and included scatter in the M-T relation, which brought down the predicted . With our CDM shape parameter of their Fig. 7 predicts a value of . Since preheating was not included, our value of appears consistent with their results.
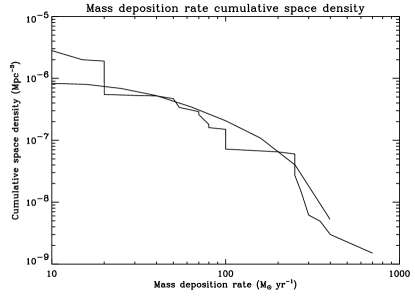
Turning to the mass deposition rates, we display the cumulative space density in Fig. 4. We have excluded clusters with temperatures less than K since such objects would be too faint in the 2–10 keV band to be included in the sample used by the two papers below. Our result agrees very well with the cumulative function obtained by Edge, Stewart & Fabian (1992) and lies slightly lower than that shown in Peres et al. (1997). The systematic uncertainties in measurements of in clusters are at present around a factor of 2. In particular the age of a cluster since its last major merger is unknown and in determining the age of the universe is generally used. Lowering this age in the analysis of Peres et al. (1997) from 13 Gyr to 6 Gyr, which is the typical age of a 5 keV cluster in our model, lowers and more than halves the values of in several clusters (Peres, private communication). In Fig. 4 we show the cumulative function from Peres et al. (1997) recalculated with this change in the age of clusters. There is very good agreement for all but small values of , which is not a serious concern since the clusters and their measurements are both sensitive to small perturbations in this range.
The mass deposition rate of a cluster is a highly sensitive probe of the gas density inside a radius of Mpc (the typical observed in cooling flows). On the other hand, the luminosity in all but the most massive cooling flows comes from inside a radius which is larger than the cooling flow region. Therefore and are independent probes of the gas density profile at different radii, and due to their sensitivity they are efficient at eliminating models. For example, while we can adjust the overall density inside by changing the temperature, the ratio of the densities inside the two radii described above have to be correct in order to match both the function and the XLF. We found that models which used gas density profiles of the form (see NF97) overpredicted the function by an order of magnitude or more. The agreement with the available data suggests that the NFW-gas profile is much closer to the right shape.
As a further example of the ability of to discriminate between models, without supernova heating we find an average value of M⊙yr-1 for cooling flow clusters with erg s-1 which is too high when compared with Fig. 2 of Peres et al. (1997). However, heating lowers the value to M⊙yr-1, which then agrees with their data. On the other hand, large clusters with erg s-1 have the correct with and without heating. Using a hydrodynamic and N-body simulation, Katz & White (1993) modelled a Virgo-like cluster with cooling of gas included, and obtained an excessively high value of M⊙yr-1. Our results suggest that non-gravitational heating could simultaneously help solve such a problem. The above results argue for flatter gas density profiles in small clusters, independently of the relation. We consider it very promising that by correctly fitting the relation, the predictions pertaining to naturally agree with the data.
4 Conclusions
We have presented a galaxy formation model in which the X-ray properties of clusters agree well with what is observed. The model is based on that described by Nulsen & Fabian (1997), and uses observed gas fractions and metallicities. Realistic gas density profiles were used, which sit in potentials given by the NFW profile. In particular, we obtained good fits to the relation, the X-ray luminosity function, the temperature function and the function, which we find to be a very sensitive diagnostic of cluster structure in the core.
To resolve a number of problems, including getting the correct slope for the relation and avoiding excessive mass deposition rates for low luminosity clusters, self-similarity of clusters has to be broken. In our model this is achieved by flattening the gas density profiles of the smaller clusters, which occurs naturally when we include heating of intracluster gas due to the retention of energy from supernovae in all previous collapse stages. We find that the energy required agrees well with the supernova energy released in producing the observed metallicities if most of this energy is retained in the intracluster gas. The result is that the above problems are simultaneously resolved once supernova heating is included.
We have highlighted the importance of the mass deposition rate and the function as diagnostics of cluster structure. The value of probes the gas density profile at smaller radii than and hence is able to give us independent information. Due to the sensitivity of quantities such as and to the structure and density of the hot gas, and the steep slopes of the three distribution functions we consider, detailed gas processes can be as important as cosmological considerations in determining what we observe.
Acknowledgements
We thank Stefano Ettori for the results of surface brightness profile fits, Clovis Peres for the new calculation of the function, and Vince Eke, Stefano, Clovis and Martin Rees for very helpful discussions. KKSW is grateful to the Croucher Foundation for financial support. ACF thanks the Royal Society for support. PEJN gratefully acknowledges the hospitality of the Institute of Astronomy during part of this work.
References
- [\citeauthoryearAllen & FabianAllen & Fabian1998] Allen S. W., Fabian A. C., 1998, MNRAS, 297, L63
- [\citeauthoryearBaugh et al.Baugh et al.1998] Baugh C. M., Cole S., Frenk C. S., Lacey C. G., 1998, ApJ, 498, 504
- [\citeauthoryearBowerBower1997] Bower R. G., 1997, MNRAS, 288, 355
- [\citeauthoryearBuote & TsaiBuote & Tsai1996] Buote D. A., Tsai J. C., 1996, ApJ, 458, 27
- [\citeauthoryearCole et al.Cole et al.1994] Cole S., Arágon-Salamanca A., Frenk C. S., Navarro J. F., Zepf S. E., 1994, MNRAS, 271, 781
- [\citeauthoryearCole & KaiserCole & Kaiser1988] Cole S., Kaiser N., 1988, MNRAS, 233, 637
- [\citeauthoryearDavid, Jones, & FormanDavid et al.1995] David L. P., Jones C., Forman W., 1995, ApJ, 445, 578
- [\citeauthoryearDavid et al.David et al.1993] David L. P., Slyz A., Jones C., Forman W., Vrtilek S. D., 1993, ApJ, 412, 479
- [\citeauthoryearEbeling et al.Ebeling et al.1997] Ebeling H., Edge A. C., Fabian A. C., Allen S. W., Crawford C. S., 1997, ApJ, 479, L101
- [\citeauthoryearEdge, Stewart, & FabianEdge et al.1992] Edge A. C., Stewart G. C., Fabian A. C., 1992, MNRAS, 258, 177
- [\citeauthoryearEdge et al.Edge et al.1990] Edge A. C., Stewart G. C., Fabian A. C., Arnaud K. A., 1990, MNRAS, 245, 559
- [\citeauthoryearEke et al.Eke et al.1998] Eke V. R., Cole S., Frenk C. S., Henry J. P., 1998, MNRAS, submitted (astro-ph/9802350)
- [\citeauthoryearEttori & FabianEttori & Fabian1998] Ettori S., Fabian A. C., 1998, MNRAS, submitted
- [\citeauthoryearEvrardEvrard1997] Evrard A. E., 1997, MNRAS, 292, 289
- [\citeauthoryearEvrard & HenryEvrard & Henry1991] Evrard A. E., Henry J. P., 1991, ApJ, 383, 95
- [\citeauthoryearFukazawa et al.Fukazawa et al.1998] Fukazawa Y., Makishima K., Tamura T., Ezawa H., Xu H., Ikebe Y., Kikuchi K., Ohashi T., 1998, PASJ, 50, 187
- [\citeauthoryearHeyl et al.Heyl et al.1995] Heyl J. S., Cole S., Frenk C. S., Navarro J. F., 1995, MNRAS, 274, 755
- [\citeauthoryearJones et al.Jones et al.1998] Jones L. R., Scharf C., Ebeling H., Perlman E., Wegner G., Malkan M., Horner D., 1998, ApJ, 495, 100
- [\citeauthoryearKaiserKaiser1986] Kaiser N., 1986, MNRAS, 222, 323
- [\citeauthoryearKaiserKaiser1991] Kaiser N., 1991, ApJ, 383, 104
- [\citeauthoryearKatz & WhiteKatz & White1993] Katz N., White S. D. M., 1993, ApJ, 412, 455
- [\citeauthoryearKauffmann & CharlotKauffmann & Charlot1998] Kauffmann G., Charlot S., 1998, MNRAS, 294, 705
- [\citeauthoryearKauffmann, White, & GuiderdoniKauffmann et al.1993] Kauffmann G., White S. D. M., Guiderdoni B., 1993, MNRAS, 264, 201
- [\citeauthoryearKitayama & SutoKitayama & Suto1996] Kitayama T., Suto Y., 1996, ApJ, 469, 480
- [\citeauthoryearMakino, Sasaki, & SutoMakino et al.1997] Makino N., Sasaki S., Suto Y., 1997, ApJ, 497, 555
- [\citeauthoryearMetzler & EvrardMetzler & Evrard1994] Metzler C. A., Evrard A. E., 1994, ApJ, 437, 564
- [\citeauthoryearMushotzky et al.Mushotzky et al.1996] Mushotzky R., Loewenstein M., Arnaud K. A., Tamura T., Fukazawa Y., Matsushita K., Kikuchi K., Hatsukade I., 1996, ApJ, 466, 686
- [\citeauthoryearNagataki & SatoNagataki & Sato1998] Nagataki S., Sato K., 1998, ApJ, in press (astro-ph/9807022)
- [\citeauthoryearNavarro, Frenk, & WhiteNavarro et al.1995] Navarro J. F., Frenk C. S., White S. D. M., 1995, MNRAS, 275, 720
- [\citeauthoryearNavarro, Frenk, & WhiteNavarro et al.1997] Navarro J. F., Frenk C. S., White S. D. M., 1997, ApJ, 490, 493 (NFW97)
- [\citeauthoryearNulsen & FabianNulsen & Fabian1995] Nulsen P. E. J., Fabian A. C., 1995, MNRAS, 277, 561 (NF95)
- [\citeauthoryearNulsen & FabianNulsen & Fabian1997] Nulsen P. E. J., Fabian A. C., 1997, MNRAS, 291, 425 (NF97)
- [\citeauthoryearPeres et al.Peres et al.1998] Peres C. B., Fabian A. C., Edge A. C., Allen S. W., Johnstone R. M., White D. A., 1998, MNRAS, in press (astro-ph/9805122)
- [\citeauthoryearSpitzerSpitzer1978] Spitzer L., 1978, Physical Processes in the Interstellar Medium. Wiley-Interscience, New York
- [\citeauthoryearWhite & FabianWhite & Fabian1995] White D. A., Fabian A. C., 1995, MNRAS, 273, 72
- [\citeauthoryearWhite, Jones, & FormanWhite et al.1997] White D. A., Jones C., Forman W., 1997, MNRAS, 292, 419
- [\citeauthoryearWhite et al.White et al.1993] White S. D. M., Navarro J. F., Evrard A. E., Frenk C. S., 1993, Nature, 366, 429