RXTE Observations of Cygnus X-3
Abstract
In the period between May 1997 and August 1997 a series of pointed RXTE observations were made of Cyg X-3. During this period Cyg X-3 made a transition from a quiescent radio state to a flare state (including a major flare) and then returned to a quiescent radio state. Analyses of the observations are made in the context of concurrent observations in the hard X-ray (CGRO/BATSE), soft X-ray (RXTE/ASM) and the radio (Green Bank Interferometer, Ryle Telescope, and RATAN-600). Preliminary analyses of the observations are presented.
1 Introduction
Cyg X-3 represents one of the most unusual X-ray binaries to have ever been observed (for a review see [Bonnet-Bidaud & Chardin 1988]). It does not fit well into any of the established classes of X-ray binaries. Its orbital period, 4.8 hours, is typical of a low mass X-ray binary, but infrared observations [van Kerkwijk et al. 1992] indicate that the mass donating star may be a Wolf-Rayet star, which would make the system a high mass X-ray binary. In addition, Cyg X-3 undergoes giant radio outbursts and there is evidence of jet-like structures moving away from Cyg X-3 at 0.3–0.9 [Gregory et al. 1972, Geldzahler et al. 1983, Mioduszewski et al. 1998a, 1998b].
Previous X-ray observations of Cyg X-3 have shown a strong 4.8 hour modulation associated with the orbital period. Modulations with the same period have been confirmed in the infrared [Becklin et al. 1972, Mason et al. 1986]. From Ginga observations [Watanabe et al. 1994], it appears that the giant radio flares occur only when the soft X-ray flux is high. Slow (0.02 – 0.001 Hz) QPOs have occasionally been seen in the X-ray [van der Klis & Jansen 1985].
1.1 Recent Discoveries
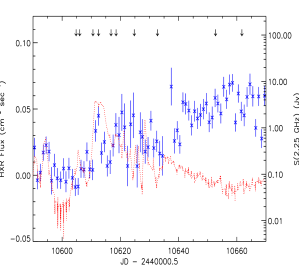
In recent studies [McCollough et al. 1997a, 1997b, 1998a] the 20–100 keV hard X-ray (HXR) emission, detected from Cyg X-3 by CGRO/BATSE, was compared with the radio data from the Green Bank Interferometer (GBI), radio data from Ryle Telescope, and the 2–12 keV soft X-ray (SXR) flux detected by the ASM on RXTE. These comparisons show that: (a) During times of quiescent radio emission (moderate radio brightness of mJy with low variability) the HXR flux anticorrelates with the radio. It is during this time that the HXR reaches its highest level. (see Fig. 1) (b) During periods of flaring activity in the radio the HXR flux switches from an anticorrelation to a correlation with the radio. In particular, for major radio flares and the quenched radio emission (very low radio fluxes of 10–20 mJy) that precedes these flares, the correlation is strong. (see Fig. 1) (c) The HXR flux has been shown to anticorrelate with the SXR flux. This occurs in both the low and high SXR states. (d) Watanabe’s [1994] results that the flaring periods in the radio occur during the high SXR states has been confirmed.
For the entire BATSE light curve of Cyg X-3 (over 2200 days) a comparison with the radio and SXR data show that the above discoveries hold over all of the overlaps between the data sets. It has also been shown that the onset of large radio flares ( 5 Jy) can be predicted by noting when the HXR drops below the BATSE detection limit for several days.
In February 1997 a large radio flare (10 Jy) was observed by GBI and Ryle after a period of quenched emission. The flare triggered VLBA observations to obtain high resolution radio images of Cyg X-3 during the major flare. The images showed a striking one-sided jet. For a distance of 10 kpc using a twin-jet model, Mioduszewski et al. [1998a, 1998b] find a jet with a velocity of 0.9 and an inclination of to our line of slight. Thus Cyg X-3 appears to be similar to the superluminal sources GROJ165540 and GRS1915+105.
2 RXTE Observations
To probe the various X-ray/radio states of activity in Cyg X-3 a series of target of opportunity (ToO) observations were made with RXTE. The ToO (a series of ten 6 ksec observations) was designed to start during an extended quenched radio state and follow Cyg X-3 through a large flare and into radio quiescent state. The times of the various RXTE observations are indicated on Fig. 1 along with HXR and radio measurements for this time period. There observations cover the time period from June–August 1997. During this timespan radio observations were also made with the Ryle and RATAN-600 radio telescopes [Trushkin 1998]. Some preliminary results are:

2.1 Lightcurves
All of the RXTE Proportional Counter Array (PCA) lightcurves show the 4.8 hr orbital modulation. In the first observation of the ToO, taken shortly after the radio came out of an extended quenched state (see Fig. 2), the lightcurve showed large scale fluctuations near the peak of the lightcurve and a smooth decline into minimum. This behavior is typical of the observations before the radio flare. In all other observations after the major flare, including a minor radio flare period and radio quiescent period, there were large scale fluctuations throughout the 4.8 hr cycle.
2.2 Temporal Variations
Preliminary temporal analysis of the RXTE data has not shown significant features in power spectra in any of the observations (see Fig 3). Scattering in the wind from the Wolf-Rayet companion can be expected to strongly suppress rapid X-ray variability by smearing, which explains the lack of short time scale variability. This lack of short timescale variability has also been noted by [Kitamoto et al. 1992] and [Berger & van der Klis 1996]. Modeling of the cut-off frequency of the variability is underway to estimate wind parameters.
2.3 Hardness Ratios
Hardness ratios were created from the ASM and BATSE data [McCollough et al. 1998b]. Hardness ratios from the ASM data alone show that during the radio quiescent periods the spectrum becomes harder. Coupled with an increase in the HXR seen concurrently in BATSE, this indicates that the spectrum is exhibiting a pivoting behavior. However, BATSE hardness ratios indicate that the spectrum above 20 keV becomes softer during times of radio quiescence, which implies something more complicated than simple spectal pivoting. This can be understood from examining the high energy spectra from RXTE (see below).
2.4 Spectra
Cyg X-3’s X-ray spectrum is known to be complicated and several components are needed to describe the spectrum [Nakamura et al. 1993]. The most prominate components are an absorbed power-law with an exponential cut-off at high energy (a Comptonized spectrum) and a broad iron emission line.
In Fig. 4 we show two count spectra overlayed. One is from just after a quenched radio state and the other from radio quiescent state. It can be seen that the Cyg X-3 X-ray spectrum substantially changes for the different radio states in a way consistant with both ASM and BATSE hardness ratios. Both spectra can be fit with the Nakamura et al. [1993] unified model. In all cases the Comptonized component dominates the spectrum.
Spectra for other observations during the flaring activity are similar to the spectrum of the first observation, but show a pivoting of the spectrum around 10 keV similar to what has been observed in Cyg X-1 [Zhang et al. 1997].


3 Summary
Preliminary analysis of the pointed RXTE observations has shown distinct differences between lightcurves and spectra that depend upon the activity in the radio. Temporal analysis of the data has yet to show any short timescale variability.
References
- Becklin et al. 1972 Becklin, E. E. et al. 1972, Nature Phys. Sci., 239,134.
- Berger & van der Klis 1996 Berger, M. and van der Klis, M. 1996, A&A, 292, 175.
- Bonnet-Bidaud & Chardin 1988 Bonnet-Bidaud, J. M. & Chardin, G. 1988, Physics Reports, 170 326.
- Geldzahler et al. 1983 Geldzahler, B. J. et al. 1983, ApJ, 273, L65.
- Gregory et al. 1972 Gregory, P. C. et al. 1972, Nature Phys. Sci., 239, 114.
- Kitamoto et al. 1992 Kitamota S. et al. 1992, ApJ, 384, 263.
- Mason et al. 1986 Mason, K.O. et al. 1986, ApJ, 309, 700.
- McCollough et al. 1997a McCollough, M. L. et al. 1997a, in “Transparent Universe”, ESA, SP-382, p. 265.
- McCollough et al. 1997b McCollough, M.L. et al. 1997b, 4th Compton Symposium, ed. C. Dermer et al. (AIP Press) p. 813.
- McCollough et al. 1998a McCollough, M.L. et al. 1998a, ApJ, submitted.
- McCollough et al. 1998b McCollough, M.L. et al. 1998b, in preparation.
- Mioduszewski et al. 1997 Mioduszewski, A. J. et al. 1998a, Proc. of IAU Colloqium 164, p. 351.
- Mioduszewski et al. 1998 Mioduszewski, A. J. et al. 1998b, in preparation.
- Nakamura et al. 1993 Nakamura, H., et al. 1993, MNRAS, 261, 353.
- Trushkin 1998 Trushkin, S. 1998, Pis’ma Astron. Zh., 24, 19.
- van der Klis & Jansen 1985 van der Klis, M. & Jansen, F. 1985, Nature, 313, 768.
- van Kerkwijk et al. 1992 van Kerkwijk, M. H. et al. 1992, Nature, 355, 703.
- Watanabe et al. 1994 Watanabe, H. et al. 1994, ApJ, 433, 350.
- Zhang et al. 1997 Zhang, S. N., et al. 1997, ApJ, 477, L95.