Probing the Cosmic Large-Scale Structure with the
REFLEX Cluster Survey : Profile of an ESO Key Programme
H. Böhringer1, L. Guzzo2, C.A. Collins3,
D.M. Neumann4, S. Schindler3,
P. Schuecker1,
R. Cruddace5, S. DeGrandi2, G. Chincarini2, A.C. Edge6,
H.T. MacGillivray7, P. Shaver8, G. Vettolani9, W. Voges1
1Max-Planck-Institut für extraterr. Physik, D-85740 Garching, Germany
2Osservatorio Astronomico di Brera, Milano/Merate, Italy
3Liverpool John-Moores University, Liverpool, U.K.
4CEA Saclay, Service d’Astrophysique, Gif-sur-Ivette, France
5Naval Research Laboratory, Washington, D.C., USA
6Durham University, Durham, U.K.
7Royal Observatory, Edinburgh, U.K.
8European Southern Observatory, Garching, Germany
9Istituto di Radioastronomia del CNR, Bologna, Italy
1 Introduction
To understand the formation of the visible structure in the Universe out of an initially almost homogeneous matter distribution is one of the most fascinating quests of modern cosmology. The first step to this understanding is of course an assessment of the matter distribution in the present Universe on very large scales extending over several hundred Mpc (for a Hubble constant of 50 km s-1 Mpc-1). Such large scales are interesting for two major reasons: the present day structures on this scale are directly comparable to the signature of the primordial structure detected in the microwave background by COBE with similar co-moving sizes, and at these scales the observed density fluctuations are just linear amplifications of the initial conditions in the early Universe. While the study of the galaxy distribution has already given us very interesting insights into the structure on scales of a few hundred Mpc an alternative approach using the next larger building blocks of the Universe, galaxy clusters, as probes for the cosmic structure can give us a ready access to even larger scales (see also Tadros et al. 1998 for the APM cluster survey in the optical).
X-ray astronomy has offered a unique tool to efficiently detect and characterize galaxy clusters out to large distances. Originating in the hot intracluster plasma that fills the gravitational potential well of the clusters, the X-ray emission is an equally robust parameter for a first estimate of the size and mass of clusters as the velocity dispersion measured from the galaxy redshifts. But, while the X-ray luminosity can be readily detected for many clusters in an X-ray sky survey, the collection of velocity dispersions requires very large and time consuming redshift surveys.
In the project described here we have embarked on a redshift survey of galaxy clusters detected in the ROSAT All-Sky Survey (Trümper 1993, Voges et al. 1996), the first complete sky survey conducted with an imaging X-ray telescope. In the frame of an ESO key programme (Böhringer 1994, Guzzo et al. 1995) we are seeking a definite identification of all possible cluster candidates found in the ROSAT Survey in the southern celestial hemisphere above an X-ray flux limit chosen such to provide a reasonably homogeneous sensitivity coverage of the sky area. Within this survey programme, which we call the ROSAT ESO Flux Limited X-ray (REFLEX) Cluster Survey, we are investigating about 800 galaxy clusters and have obtained more than 300 new cluster redshifts.
The present article describes methods of the cluster detection and identification as well as first preliminary results on the statistics of the cluster population and a view on the large-scale distribution of the clusters. In a following paper we describe in more detail the observing strategy and the spectroscopic results.
2 Cluster Detection and Follow-Up Observations
The X-ray sky atlas constructed from the ROSAT All-Sky Survey Mission with its more than 100,000 X-ray sources (Voges et al. 1996) contains thousands of mostly unidentified galaxy clusters. Since the majority of these sources are characterized by few photons, only the brightest, well extended X-ray cluster sources are readily identified, while the main part of the identifications has to be based on further optical information. For the REFLEX Survey we made mainly use of the COSMOS optical object catalogue (e.g. Heydon-Dumbleton et al. 1989) produced from the digital scans of the photographic UK Schmidt Survey ( providing star/galaxy separation for the sky objects with high completeness down to mag.). The cluster candidates are found as overdensities in the galaxy density distribution at the position of the X-ray sources (see Böhringer et al. in preparation). Not all the sources flagged by this technique are true galaxy clusters, however. The price paid for aiming at a high completeness in the final catalogue is a low detection threshold in the galaxy density leading to a contamination of the candidate list by more than 30% non-cluster sources. This large contamination can be reduced to about one third by a direct inspection of the photographic plates, the detailed X-ray properties, and using all the available literature information.
The subsequent work is the observational task of the ESO key programme comprising a total of 90 observing nights distributed evenly among the 1.5m, 2.2m, and 3.6m telescopes at La Silla. These follow-up observations have a two-fold purpose: we search for a definite identification for the unknown objects and collect redshifts for all clusters for which this parameter is not known. To make optimal use of the ESO telescopes we observe nearby, poor clusters and groups in single-slit mode with the smaller telescopes and use the 3.6m telescope with EFOSC in multi-slit operation to get multiple galaxy spectra of dense, rich clusters. Several coincident redshifts strongly support the cluster identification and the spectroscopy of central dominant early type galaxies at the X-ray maximum plays a particularly important role in this study.
The observing programme will be completed in fall of this year. Having observed the clusters with higher X-ray flux with highest priority, we can construct a first catalogue of clusters for the brighter part of the sample down to an X-ray flux limit of erg s-1 cm-2 (in the ROSAT band 0.1 - 2.4 keV) comprising 475 objects. 53% of these clusters can be found in the main catalogues of Abell (1958) and Abell, Corwin, & Olowin (1989) and further 10% in the supplementary list. Most of the remaining clusters are previously unknown objects. This result highlights the importance of the selection process in the construction of the sample: a significant fraction of the X-ray bright and massive clusters would have been missed had the X-ray clusters only been identified on the basis of existing catalogues. The fraction of known Abell clusters decreases further if one goes to lower X-ray flux limits e.g. in the extended REFLEX sample. We should also note here, however, that one part of the objects missing in Abell’s compilation are nearby, X-ray bright groups, which are not rich enough in their galaxy content to fulfill Abell’s criteria.
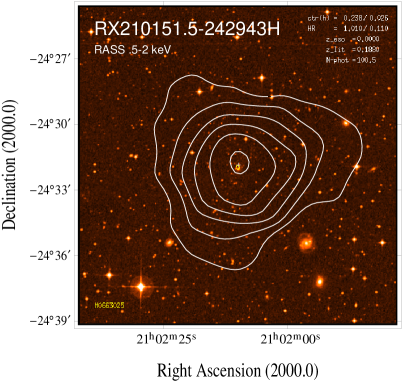
The high completeness of this sample is demonstrated by a counter-test, in which we searched for X-ray emission at the position of all Abell and ACO clusters in the ROSAT Survey independent of a previous detection of these sources by the survey source identification algorithm. Only 5 clusters () were found to have been missed by the cluster search based on the COSMOS data. Fig. 1 gives an example of a non-Abell clusters found at a redshift of . A fraction of the X-ray sources in the cluster candidate list are found to have non-cluster counterparts in the follow-up observations including AGN in clusters where the AGN provide the main source of the X-ray emission.
A few spectacular discoveries were made in the course of this programme including the most X-ray luminous cluster discovered so far, RXJ1347-1145 (Schindler et al. 1995,1996) and clusters featuring bright gravitational arcs, e.g. S295 (Edge et al. 1994).
3 Properties of the X-ray Clusters of Galaxies

In the following we are reporting results based on the X-ray bright sample of 475 galaxy clusters for which 413 cluster redshifts have been obtained and reduced so far. A plot of the number counts of the cluster population as a function of the limiting X-ray flux is shown in Fig. 2. The logarithmic graph has a slope that is in perfect agreement with an Euclidian slope of . This slope is easily explained by the fact that the majority of the clusters is not very distant - the peak in the redshift histogramme is at - and thus band-corrections and evolutionary corrections are not important. Fig. 3 shows the distribution in redshift and X-ray luminosity. While most of the clusters detected are not very distant (median redshift is ), a few very luminous clusters are found out to redshifts of with one outstanding object at a redshift of , the most luminous cluster mentioned above. One also notes clearly the break at a redshift of , which is caused by the limited depth of the optical plate material used for the cluster pre-identification. Thus we can expect that there are more, in fact very interesting luminous clusters in the X-ray source list for this flux limit with redshifts between to . But a more expensive imaging search programme would be necessary to find these objects.
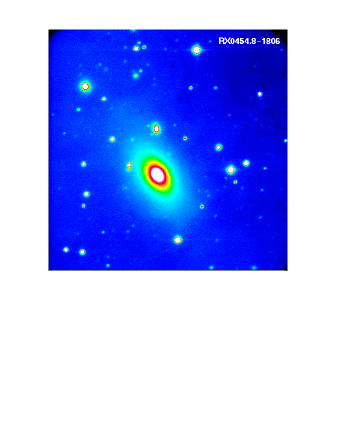
Another very interesting part of this X-ray cluster population is found among the nearby, low X-ray luminosity objects. These are groups of galaxies dominated by very giant cD galaxies which are often found to be two or three magnitudes brighter than the next brightest galaxy in the system. A CCD image of such a group is shown in Fig. 4.

The most straightforwardly obtained and important distribution function of the cluster sample is the X-ray luminosity function. This function is most closely related to the mass function of the clusters which is used as an important calibrator of the amplitude of the density fluctuation power spectrum of the Universe (e.g. White et al. 1993). A preliminary version of the X-ray luminosity function of the sample is shown in Fig. 5. Note that this function was derived for the sample when () of the redshifts had been obtained. But in spite of this incompleteness the luminosity function already recovers the densities reached in previous surveys (e.g. Ebeling et al. 1997, DeGrandi 1996) to which the present result is compared in the figure. The high quality of the present sample is also demonstrated by the fact that the slope of the number count function of Fig. 2 is Euclidian while the previous surveys showed a significantly lower value for the logarithmic slope of .

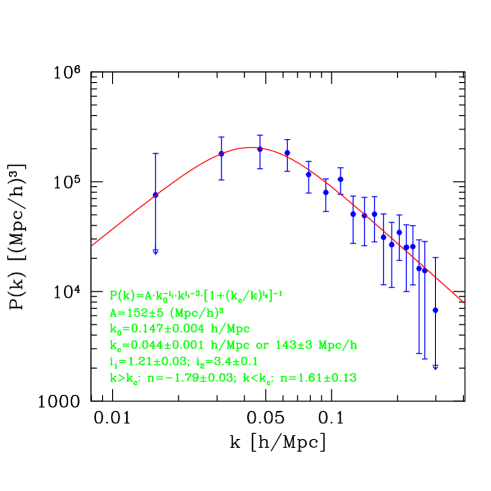
As pointed out in the introduction, the most exciting aim of this programme is to assess the large-scale structure of the galaxy cluster and matter distribution in the Universe. The currently most popular and important statistical function for the characterization of the large-scale structure is the density fluctuation power spectrum. A first preliminary result for this function obtained from 188 cluster of our sample in a box of 400 Mpc is shown in Fig. 6 (for details see Schuecker et al. in preparation). The function is featuring an interesting maximum at a scale of about 100 - 150 Mpc. The location of this maximum is related to the size of the horizon of the Universe at an epoch when the energy density of matter and radiation was equal and it is therefore a very important calibration point for the theoretical modeling of the evolution of our Universe. Note that the construction of the power spectrum shown in Fig. 6 is based on a luminosity (mass) selection of the clusters which varies with redshift. Therefore the quantitative interpretation of the this result is not straightforward and more work is needed to relate this function to the power spectrum of the matter density fluctuation in the Universe.
From the power spectrum shown we can also derive another statistical function which is more illustrative to non-experts, the rms-fluctuation level on different scales as provided by a filtering of the cluster density fluctuation field by a simple Gaussian smoothing filter. This function is shown in Fig. 7 where we note that at the scale of the maximum of the power spectrum (a scale of Mpc) the cluster density varies typically by about 10%, while at the largest scales ( Mpc) a fluctuation level of the order of 1% is indicated. This sets a high standard of requirements on the cluster survey, and while we are confident that the present sample contains no systematic biases on the 10% level, further tests and simulations are needed to explore the reliability of the results on the largest scales.

4 Conclusions
It is obvious from the above arguments that studies of the large-scale structure using clusters as probes require great care in the preparation of the sample of test objects. The first results of the REFLEX Survey presented here and some further tests that we have conducted already demonstrate the high quality of the present sample. This is the result of a very homogeneous and highly controlled selection process used to construct the sample. The challenge of the selection work in this survey is to combine the complementary information from X-ray and optical wavelength in the most homogeneous way. Contrary to several earlier studies that we have conducted (Pierre et al. 1994, Romer et al. 1994, Ebeling et al. 1997, De Grandi 1996) in which the identification process was optimized to find as many clusters as possible by using all available sources of information, we have now achieved a highly complete cluster selection by just combining the ROSAT All-Sky Survey data and the COSMOS optical data base in a homogeneous way, completely controlled by automated algorithms. Additional information is only used in the final identification but does not influence the selection. This is a very important achievement in this survey work.
The data presented are still not fully complete in redshifts. But with data already obtained in January and September 1998 we can practically complete this data set (to 96%). An extended sample of REFLEX clusters down to a flux limit of erg s-1 cm-2 is already prepared and redshifts are available for more than 70% of the objects. This extended set of about 750 galaxy clusters will help very much to tighten the constraints for the power spectrum and extend it to larger scales. It will further enable us to investigate the cluster correlation function - in particular the X-ray luminosity dependence of the clustering amplitude, which is an issue not yet resolved. Finally, a complementary ROSAT Survey cluster identification programme is being conducted in the Northern Sky in a collaboration of the Max-Planck Institut für extraterrestrische Physik and J. Huchra, R. Giacconi, P. Rosati and B. McLean which will soon reach a similar depth and provide an all-sky view on the X-ray cluster distribution.
References
- [1] Abell, G.O., 1958, ApJS, 3, 211
- [2] Abell, G.O., Corwin, H.G. & Olowin, R.P., 1989, ApJS, 70, 1
- [3] Böhringer, H., 1994, in Studying the Universe with Clusters of Galaxies, H. Böhringer and S.C. Schindler (eds.), Proceedings of an astrophysical workshop at Schloß Ringberg, Oct. 10-15, 1993, MPE Report No. 256, p. 93
- [4] DeGrandi, S., 1996, in Röntgenstrahlung from the Universe, H.U. Zimmermann, J.E. Trümper, H. Yorke (eds.), MPE Report 263, p. 577
- [5] A.C. Edge, H. Böhringer, L. Guzzo, et al., 1994, A&A, 289, L34.
- [6] Ebeling, H., Edge, A.C., Fabian, A.C., Allen, S.W., Crawford, C.S., & Böhringer, H., 1997, ApJ, 479, L101.
- [7] Guzzo, L., Böhringer, H., Briel, et al., 1995, in Wide-Field Spectroscopy and the Distant Universe, S.J. Maddox and A. Aragón-Salamanca (eds.), World Scientific, Singapore, p. 205
- [8] Heydon-Dumbleton, N.H., Collins, C.A. & MacGillivray, H.T., 1989, MNRAS, 238, 379
- [9] Pierre, M., Böhringer, H., Ebeling, H., Voges, W., Schuecker, P., Cruddace, R.G., & H.T. MacGillivray, 1994, A&A, 290, 725
- [10] Romer, A.K., Collins, C.A., Böhringer, H., Cruddace, R.G., Ebeling, H., H.T. MacGillivray, & Voges, W., 1994, Nature, 372, 75
- [11] Schindler, S.C., Guzzo, L., Ebeling, H., et al., 1995, A&A, 299, L9.
- [12] Schindler, S., Hattori,M., Neumann, D.M., & Böhringer, H., 1996, A&A, 317, 646
- [13] Tadros, H., Efstathiou, G., & Dalton, G., 1998, MNRAS, 296, 995
- [14] Trümper, J., 1993, Science, 260, 1769.
- [15] Voges, W., Boller, T., Dennerl, K., et al., 1996, in Röntgenstrahlung from the Universe, H.U. Zimmermann, J.E. Trümper, H. Yorke (eds.), MPE Report No. 263, p. 637
- [16] White, S.D.M., Efstathiou, G., & Frenk, C.S., MNRAS, 1993, 262, 1023.