A Hot Spot in Coma
Abstract
We study the temperature structure of the central part (′ Mpc) of the Coma cluster of galaxies using ASCA data. Two different analysis methods produce results in good agreement with each other and reveal the presence of interesting structures in the gas temperature distribution. Globally, the average temperature in the center of the cluster is keV in good agreement with previous results. Superimposed on this, we find a cool area with temperatures of 4-6 keV associated with a filament of X-ray emission extending southeast from the cluster center detected by Vikhlinin and coworkers. We also find a hot spot with a temperature of around 13 keV displaced north from the central peak of emission. The distribution of the gas temperatures and relative specific entropies suggests that the cool features are most likely gas stripped from a galaxy group centered on NGC 4874 falling toward the core from outside, while the hot spot located “ahead” of this in-falling gas is due to shock heating. Thus our results suggest that we are observing Coma during a minor merger with a small group of galaxies associated with NGC 4874 shortly before the initial core passage.
Subject headings:
galaxies: clusters: individual (Coma, A1656) — galaxies: ICM — X-rays: galaxies
1. INTRODUCTION
The rich, nearby Coma cluster (A1656) has long been considered as the archetype of a relaxed cluster system. However, with the advent of X-ray imaging satellites (Einstein and ROSAT), as well as extensive optical studies, it has become clear that Coma, like many other clusters (e.g., Geller & Beers 1982; Jones & Forman 1983; Bird 1994) exhibits significant substructure at various linear scales. At the largest scales ( Mpc), ROSAT observations have shown a large subcluster ′ to the southwest of the center associated with NGC 4839 (Briel et al. 1992; White et al. 1993; Burns et al. 1994). Optical studies ( Mellier et al. 1988, Biviano et al. 1996, hereafter B96; Colless & Dunn 1996, hereafter CD96) have found significant enhancements in the density of galaxies associated with this subcluster. At intermediate( kpc) and smaller scales these authors as well as several more (Fichett & Webster 1987; White et al. 1993; Mohr, Fabricant, & Geller 1993) have found significant substructure in the X-rays and complex velocity distributions in the optical and associated with the two dominant galaxies NGC 4874 and NGC 4889. Several authors (Davis & Mushotzky 1993; White et al. 1993; Vikhlinin et al. 1994) have found distinctive enhancements of X-ray emission associated with the galaxy concentrations around the two dominant galaxies, NGC 4889 and NGC 4874, for which they obtained mass estimates consistent with those from the velocity dispersion inside these galaxy groups (Mellier et al. 1988). A more detailed wavelet analysis of the ROSAT image (Vikhlinin et al. 1997, hereafter V97) has also revealed a gas filament extending southeast from the cluster core for Mpc. One explanation for this filament is as a trail of gas left in the wake of an in-falling galaxy group. Temperature maps of the X-ray emitting gas are a new and especially sensitive tool for the detection of dynamic activity. Hydrodynamic simulations indicate that mergers should produce characteristic temperature patterns that survive 4-6 times longer than perturbations in the gas density (e.g. Schindler & Müller 1993; Ricker 1997). Recent observations (Henry & Briel 1995; Henriksen & Markevitch 1996; Markevitch et al. 1996b, 1998; Donnelly et al. 1998) have found just such characteristic temperature structures in a variety of clusters, which have been interpreted as due to cluster mergers. A large-scale ( Mpc) temperature map of Coma has been presented by Honda et al. (1996), who used GIS data from fourteen different ASCA pointings. Their map has a resolution of (a GIS field of view) and reveals a hot region northwest of the cluster as well as several other significant deviations from isothermality. Watanabe et al. (1997) presented a preliminary analysis of the temperature structure at smaller scales. In this paper, we use the ASCA observation of the Coma center to obtain a more detailed, ′ resolution, temperature map of the central (′ Mpc) region of the cluster. All distance dependent quantities have assumed , , all coordinates are given in the J2000 system, and unless otherwise noted all error bars are 90% confidence level.
2. OBSERVATIONS & RESULTS
ASCA observed the core of the Coma cluster on June 14, 1993 (sequence # 80016000), and had useful exposures of 7.6, 7.6, 9.4 and 9.4 ksec for the SIS 0-1 and GIS 2-3 detectors respectively. We have not included the thirteen offset pointings centered on this cluster (see Honda et al. 1996) because they are subject to “stray light” contamination by photons scattered from the central area which we do not correct for in our analyses.
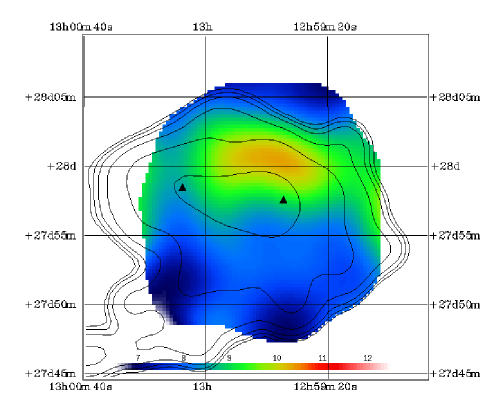
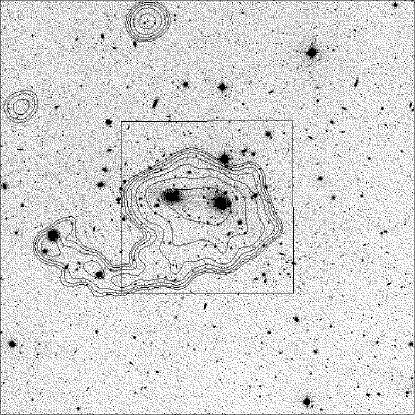
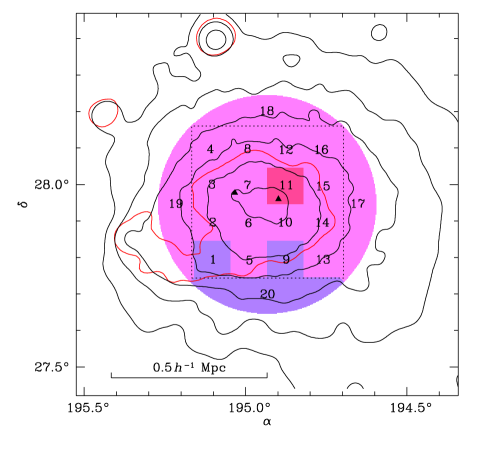
Correctly characterizing the temperature distribution from ASCA data for an extended source on scales smaller than the entire field of one of the detectors requires a correction for the energy dependent PSF of the telescope (Takahashi et al. 1995). To this end, we have employed two independent methods detailed elsewhere (Churazov et al. 1996, 1998, hereafter Method A; Markevitch et al. 1996a, 1998, hereafter Method B) to generate temperature maps with resolutions of ′. Method A provides a continuous temperature map, although the correction for the PSF is approximate (see Churazov et al. 1998 for details). Method B derives spectra in projected regions defined by the user and takes exact account of the ASCA PSF. Note that both methods use the same ASCA PSF model and therefore may be subject to the same systematic uncertainties. Figure 1a, developed using Method A applied to the ASCA GIS data, shows the approximate best fit temperature, excluding the outer regions of the field of view where the uncertainty in the temperature was large. The map has been smoothed to a spatial resolution of ′ to improve the signal-to-noise ratio. Contours in both panels of Figure 1 show the filamentary structure in the X-ray intensity revealed by V97 after the removal of large-scale cluster emission via wavelet smoothing of the ROSAT PSPC image (see Vikhlinin et al. 1994 and V97 for details). In Figure 1b the wavelet contours are overlaid on the optical image from the Digital Sky Survey. We have added a box to delineate the area shown in Figure 1a. The positions of the two especially prominent galaxies, NGC 4874 and NGC 4889, are indicated in Figure 1a with solid triangles. There are three prominent features in the temperature map: two areas % cooler than the average on the south and southeast edges of the map coincident with the filament, and a hot spot, % hotter, displaced ′ to the north from the peak of the intensity located ′ southeast of NGC 4874. To better understand the statistical significance of the thermal deviations found in Figure 1, we employed Method B to produce a binned map of the temperature (Figure 2) using data from both the GIS and SIS detectors. Integral to this method is the use of an intensity model which in this case we have chosen to be the ROSAT PSPC image. A 30″ relative offset between the ROSAT and ASCA images was corrected so that model and data would be correctly aligned. The lowest wavelet contour from Figure 1 has been overlaid in the figure in red, the ROSAT PSPC contours are overlaid in black, and the positions of NGC 4874 and NGC 4889 are marked with filled triangles. The area displayed in Figure 1a is outlined for comparison. A plot of the temperature versus region is provided in the upper right panel of Figure 2.
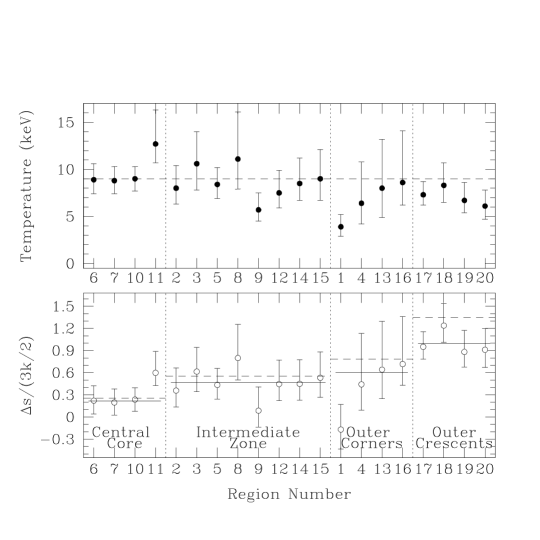
The integrated spectrum from within a 9′ radius of the cluster center yields a best fit average temperature of keV, consistent with previous results (Hughes et al. 1993, Honda et al. 1996). Figure 2 shows that, except for regions 1, 9, 11 and 20, there are no significant deviations from this average. Region 11 ( keV) coincides with the center of the hot spot found in Figure 1, while regions 1, 9 and 20 ( respectively) generally coincide with the cool regions along the filament in Figure 1. As with previous work (Donnelly et al. 1998), the temperatures determined by both methods are in good agreement.
3. DISCUSSION
The simplest interpretation of our temperature maps, in agreement with B96, is that Coma is experiencing a merger with a moderately sized group associated with NGC 4874 located south of the observed hot spot. The hot spot of emission is due to a bow shock generated by the group as it moves through Coma’s intercluster medium(ICM). As the group has fallen toward the core of Coma, it has left a trail of cool gas delineating its in-bound track, which we see as the filament detected by V97. This is similar, for example, to simulations by Roettiger, Loken & Burns (1997, hereafter RLB97), Roettiger, Burns & Loken (1996, hereafter RBL96) and Norman & Bryan (1998, hereafter NB98). Recently both CD96 and B96 reported significant evidence for substructure in the core of Coma associated with the galaxies surrounding both NGC 4889 and NGC 4874. CD96 argued that the group around NGC 4874 was the “true central peak”, and the outer halo of the cD– which would have been destroyed during core passage- has been re-aquired from merger debris during its long term residence in the core. They were, however, hard pressed to explain the large velocity offset ( km/s) relative to the overall field required from their model for NGC 4874. Alternatively, the presence of a cD galaxy in the form of NGC 4874 could indicate that the group is in an early stage of the merger prior to entering the core, and as such has not yet been disrupted by the merger process. B96 separated the cluster galaxies into “bright” and “faint” samples, and found– within the “bright” sample– two galaxy groups, one associated with each of the two dominant galaxies. This is similar to the results of Fitchett & Webster (1987). B96 then argued that the “faint” sample was a better representative of Coma’s overall velocity field and as such indicated that the two groups were “still in the process of merging with the cluster”. This model would explain the presence of the cD, the velocity offset for the NGC 4874 group as well as the temperature structures that we have found and the offset of the peak of Coma’s overall emission from the two dominant galaxies (White et al. 1993, Vikhlinin et al. 1994). Following Markevitch et al. (1996b), we used the temperature maps to estimate the local relative specific entropy (entropy per particle) to better understand the gas merger process and the energetics involved. The relative specific entropy is defined as
| (1) |
where , and are, in this case, the central values from an isothermal -model (, Cavaliere & Fusco-Femiano 1976). The emission-weighted average density in each projected region from the symmetric -model was crudely corrected for the cluster’s observed asymmetry by multiplying by the square root of the ratio of the actual brightness, as determined from the ROSAT data, to the predicted model brightness:
| (2) |
where is the value from the -model. This allows us to compare the specific entropy for regions of interest via the common benchmark of the -model, while taking into account the smaller scale non-uniformities. We used the best fit -model parameters and core radius ′ from Briel et al. (1992). The lower right panel in Figure 2 shows the relative specific entropy in each region with its 90% confidence error bar. The errors include contributions from the uncertainties in the surface brightness correction and the -model, but are strongly dominated by the contribution from the temperature determination. For clarity, we have segregated the regions into four groups, such that the relative specific entropy for the azimuthally symmetric isothermal model (shown as dashed lines) is constant within each group. The average relative specific entropy for each group (solid lines) is shown for comparison. Due to the obviously discrepant nature of both regions 1 and 11, they were excluded from the average for their respective groups. In the core, Region 11 (the hot spot) has a significantly higher relative specific entropy compared to the other central regions. Region 8 also has a high relative specific entropy relative to its group, although this deviation is only marginally significant. Assuming that this hot gas lies inside the core, and that initially it had a relative specific entropy equal to that of the rest of the core, we can estimate the total energy that has been injected into the gas as:
| (3) |
By comparison, a gas mass of associated with a group falling from 5 Mpc into the core will acquire approximately 10-30 times this amount in kinetic energy, part of which it should lose prior to reaching the core. The conversion of the gas’s gravitational potential energy is then a reasonable source for the energy required to produce the hot spot. We find that the temperatures in the cool regions (1, 9 and 20) are consistent with the allowed lower limit of 4 keV calculated by V97 for the filament. Regions 1 and (less significantly) 9 both also have low relative specific entropies compared to their group averages. Region 1 is especially notable in that it has a much lower relative specific entropy than even the core values of the -model. The low values of the relative specific entropy for regions 1 and 9 suggest that the gas in these regions only recently began to fall into the cluster and has not yet been completely mixed with or heated by the cluster’s ICM. These regions are all spatially associated with the filament seen in X-ray image. In their analysis of the filamentary emission, V97 offered two possible explanations for the filamentary enhancement in emission. Either the filament arises from gas stripped via ram pressure from a group passing through Coma, or from a local perturbation in the ICM due to dark matter that has been tidally stripped from a merging group. The distinctive relative specific entropy of gas in the filament supports the former explanation. RLB97’s simulations of a merger with a small group (see also RBL96 and NB98), find that the passage of a group through the cluster environment will lead to substantial vorticity along the path of the in-bound object. This would temporarily introduce an additional pressure term in the in-falling gas preventing it from thermally equilibrating with the overall ICM. It is also possible that the vorticity would retard the mixing of the in-falling gas into the overall ICM, thus prolonging the lifetime of the filament and addressing some the time scale issues raised in V97. On smaller scales, numerical simulations (RBL96, RLB97) indicate that, in a minor merger, the in-falling object will develop a protective bow shock, which will effectively shelter the galaxies from being ram pressure stripped of their gas. However, close to core passage the in-falling object’s ICM encounters a rapidly increasing density in the gas of the main cluster. This would lead to the group’s gas and galaxies decoupling from each other, and the galaxies experiencing an “impulsive burst of ram pressure” as they pass through the shock. This would naturally lead to the galaxies being stripped of their gas prior to their coalescence with the cluster. Contrary to this, Vikhlinin et al. (1994) find a large gas halo associated with NGC 4874, while Schombert (1988) finds the optical completely normal and unperturbed for a cD galaxy. Radio observations of the galaxy NGC 4869, southwest of NGC 4874, by Feretti et al. (1990) indicate that it is in orbit around the cD galaxy. They noted a major problem in the confinement of the radio tail associated with NGC 4869 due to its internal pressure strongly decreasing with distance from the center of the galaxy. One possible explanation is that, due to a projection effect, the pressure of the ambient medium is lower than that which they have computed. Feretti et al. (1990) reject this based upon the assumption that NGC 4874 is nearly at rest at the bottom of the cluster potential. If, however, NGC 4874 and NGC 4869 are part of a group still falling into Coma a significant projection effect may be at work. Given the large extent of the X-ray gas– more than 12′ in diameter– found by V97 around NGC 4874, it is plausible that NGC 4869 is being shielded from the overall cluster ICM (RLB97), and the relevant ambient medium is that of the in-falling group. These arguments suggest that the group has not quite arrived at the core. Further, the velocity studies of Mellier et al. , B96 and CD96 find a statistically significant offset for the NGC 4874 group relative to the Coma’s average velocity field. This suggests that that the group is falling in from the front side of Coma at a mild inclination to our line of sight. There are some complications to this simple model due to the nearby presence of another subcluster associated with NGC 4889, ′ to the east from NGC 4874. Baier et al. (1990) find that the group of galaxies associated with NGC 4889 is elongated along an axis from the southeast to the northwest, possibly indicating a recent dynamical/tidal interaction similar to that described by RLB97 as occurring after core passage. It is possible that the slightly high entropy in region 8 briefly mentioned above is related to this activity. The lack of an extended envelope around NGC 4889 also would be expected if the group has recently passed through the core. As with the NGC 4874 group, CD96 and B96 find a statistically significant velocity offset for the NGC 4889. This suggests that both the NGC 4889 and NGC 4874 groups – in that order– may be recent arrivals in the core. We are thus seeing the debris of the final stages of one minor merger, just as another minor merger is occurring. Other complications arise from what the model described above suggests that we should see. Nominally, we expect that the surface distribution of galaxies in an in-falling group would experience some distortion prior to core passage. In their simulations, RLB97 show just such a morphology at -0.25 Gyr for a 2:1 mass ratio merger, although the distortion is less for the secondary (i.e. in-falling) cluster than for the primary and it is not clear how this effect would scale with mass. However, Baier et al. (1990) find that the group of galaxies around NGC 4874 is circularly distributed suggesting no dynamical perturbations. This lack of distortion evident in the NGC 4874 group may be due to its being still quite far from core passage. Finally, we would expect the temperature and entropy results for Region 5– situated directly between regions 1, 9 and 20– to share in the properties of the filament as outlined above. However, we find that it is nearly identical to the non-filament gas. Perhaps this is due to a projection or dilution effect due to the increasing brightness of the overall ICM. Unfortunately, the resolution of our data is inadequate for further speculation.
4. SUMMARY
We have analyzed the ASCA pointing covering the central r=18′ area of the Coma cluster. Although, the temperature map of the gas in the core of the cluster does not exhibit the strong temperature variations observed in clusters undergoing major mergers, we find several significant features in the temperature map indicating recent and ongoing mergers with small groups. Our analysis indicates that gas to the south/southeast side of the cluster is significantly cooler and has a lower relative specific entropy than the average. The regions of low temperature and relative specific entropy coincide with the gas filament, detected by V97, extending from the cluster’s center to the south and east towards NGC 4911. This low entropy gas is most likely deposited in the wake of the NGC 4874 group as it falls toward the cluster. The temperature map also reveals a hot spot located to the north of the cD galaxy, NGC 4874, and the peak of the intensity profile. This is most likely a bow shock in the gas which has developed as this small group of galaxies has fallen in to the core of the cluster. Our rough estimate of the relative specific entropy of the shocked gas is consistent with heating from the conversion of the kinetic energy of a small group falling into the cluster. The X-ray and optical data suggest that a small group of galaxies associated with NGC 4874 is in-bound towards the cluster core from the southeast leaving a tail of cooler gas along its trajectory. The relatively unperturbed state of the group suggests that core passage has not yet occurred. The group associated with NGC 4889, although still in the process of being incorporated into the cluster, has already passed the core and most likely been resident in the core for some time, as evidenced by its dynamically disturbed state. Future observations of Coma with AXAF will allow us to study the characteristics of the ICM around these merger remnants at much higher spatial resolution. This will help us to understand the processes at work during and after mergers in much greater detail.
References
- (1)
- (2) Baier, F.W., Fritze, K. & Tiersch, H. 1990, Astron. Nach., 311, 89
- (3) Bird, C.M. 1994, AJ, 107, 1637
- (4) Biviano, A., Durret, F., Gerbal, D., Le Fèvre, O., Lobo, C. Mazure, A. & Slezak, E. 1996, A&A, 311, 95
- (5) Briel, U.G., Henry, J.P. & Böhringer, H. 1992, A&A, 259, L31
- (6) Burns, J.O., Roettiger, K., Ledlow, M. & Klypin, A. 1994, ApJ, 427, 87
- (7) Cavaliere, A., & Fusco-Femiano, R. 1976, A&A, 49, 137
- (8) Churazov, E., Gilfanov, M., Forman, W., & Jones. C. 1996, ApJ, 471, 673
- (9) Churazov, E., Gilfanov, M., Forman, W., & Jones. C. 1998, in preparation
- (10) Colless, M. & Dunn, A.M. 1996, ApJ, 458, 435
- (11) Davis, D.S. & Mushotzky, R.F. 1993, AJ, 105, 491
- (12) Donnelly, R.H., Markevitch, M., Forman, W., Jones, C. David, L.P., Churazov, E. & Gilfanov, M. 1998, ApJ, 500, 138
- (13) Feretti, L., Dallacasa, D., Giovanni, G. & Venturi, T. 1990, A&A, 232, 337
- (14) Fitchett, M.J. & Webster, R. 1987, ApJ, 317, 653
- (15) Geller, M.J. & Beers, T.C. 1982, PASP, 94, 421
- (16) Gilfanov, M., Churazov, E., Forman, W., & Jones, C. 1998, in preparation
- (17) Henriksen, M. & Markevitch, M. 1996, ApJ, 466, L79
- (18) Henry, J.P. & Briel, U.G. 1995, ApJ, 443, L9
- (19) Honda, H., Hirayama, M., Watanabe, M., Kunieda, H., Tawara, Y., Yamashita, K., Ohashi, T., Hughes, J.P. & Henry, J.P. 1996, ApJ, 473, L71
- (20) Hughes, J.P., Butcher, J.A., Stewart, G.C. & Tanaka, Y. 1993, ApJ, 404, 611
- (21) Jones, C. & Forman, W. 1983, in “Clustering in the Universe”, ed Gerbal, D. & Mazure, A., (Gif sur Yvette: Editions Frontieres), p.287
- (22) Markevitch, M., Mushotzky, R., Inoue, H., Yamashita, K., Furuzawa, A., & Tawara, Y. 1996a, ApJ, 456, 437
- (23) Markevitch, M., Sarazin, C. & Irwin, J.A. 1996b, ApJ, 472, L17
- (24) Markevitch, M., Forman, W., Sarazin, C. & Vikhlinin, A. 1998, ApJ, 503, 77
- (25) Mellier, Y., Mathez, G., Mazure, A., Chauvineau, B. & Proust, D. 1988, A&A, 199, 67
- (26) Mohr, J., Fabricant, D. & Geller, M. 1993, ApJ, 413, 492
- (27) Norman, M.L. & Bryan, G.L. 1998, astroph, 9802335
- (28) Ricker, P.M. 1998, ApJ, 496, 670
- (29) Roettiger, K., Burns, J.O. & Loken, C. 1996, ApJ, 473, 651
- (30) Roettiger, K., Loken, C. & Burns, J.O. 1997, ApJS, 109, 307
- (31) Schombert, J.M. 1988, ApJ, 328,475
- (32) Takahashi, T., ,Markevitch, M., Fukazawa, Y., Ikebe, Y., Ishisaki, Y., Kikuchi, K., Makishimi, K., & Tawara, Y. 1995, ASCA Newsletter, No. 3 (NASA/GSFC)
- (33) Vikhlinin, A., Forman, W. & Jones, C. 1994, ApJ, 435, 162
- (34) Vikhlinin, A., Forman, W. & Jones, C. 1997, ApJ, 474, L7
- (35) Watanabe,M., Yamashita, K., Tawara, Y. & Honda, H. 1997, ASCA/ROSAT Workshop on Clusters of Galaxies, 163
- (36) White, S.D.M., Briel, U.G. & Henry, J.P. 1993, MNRAS, 261, L8
- (37)